


Abstract
The spatial arrangement and metabolic activity of ‘Candidatus Competibacter phosphatis’ was investigated in granular sludge from an anaerobic—aerobic sequencing batch reactor enriched for glycogen-accumulating organisms. In this process, the electron donor (acetate) and the electron acceptor (oxygen) were supplied sequentially in each phase. The organism, identified by fluorescence in situ hybridisation, was present throughout the granules; however, metabolic activity was limited to a 100-μm-thick layer immediately below the surface of the granules. To investigate the cause of this, oxygen microsensors and a novel microscale biosensor for volatile fatty acids were used in conjunction with chemical staining for intracellular storage polymers. It was found that the limited distribution of activity was caused by mass transport limitation of oxygen into the granules during the aerobic phase.
1 Introduction
Aggregation of microorganisms is critical for the effective separation of suspended biomass from the effluent of wastewater treatment processes, particularly in activated sludge processes. Suspended aggregates are most commonly present as flocs, but granular sludge has also been employed in wastewater treatment systems, such as sequencing batch reactors (SBRs) [1,2] and upflow anaerobic sludge blanket (UASB) processes [3–5]. Granules are densely aggregated and differ from flocs in both physical properties and microbial arrangement. As opposed to flocs, granular sludge is better able to cope with high and fluctuating loading rates, and this is exploited in UASB processes for treatment of high strength wastewater [5]. Additionally, the rapid settling velocities of granules have been employed to reduce the size of anaerobic reactors and could be applied to activated sludge processes replacing large and costly settling tanks.
Dense aggregation of microorganisms forming granules and biofilms can facilitate the occurrence of steep chemical gradients within the biomass due to mass transport limitation, which leads to the formation of chemically different microenvironments in close proximity. This chemical stratification is the basis for the complex spatial arrangement of bacteria with different metabolic requirements observed in many granules and biofilms. Such arrangements have, for instance, been observed in methanogenic granules from UASB reactors where fermentative bacteria form an outer layer surrounding a matrix of methanogenic archaea in close association with microcolonies of obligate, hydrogen-producing, fatty-acid-oxidising bacteria [6,7]. Stratified populations have also been observed in aerobic granules where clusters of aerobic, ammonia-oxidising Nitrosomonas were only found to a depth of 70–100 μm into the granules due to diffusion limitation into the aggregates [8].
While most previous studies of heterotrophic granular sludges have been made under continuous aerobic or continuous anaerobic conditions, the present study investigated granules from a laboratory-scale SBR operated with alternating anaerobic and aerobic periods where acetate was fed at the beginning of the anaerobic period and fully removed from the bulk liquid before the onset of the aerobic period. Under these conditions, and particularly with low phosphorus concentrations in the feed, glycogen-accumulating organisms (GAOs) [9] can be enriched in favour of other heterotrophic organisms, due to their ability to take up acetate under anaerobic conditions. Acetate is taken up and converted to intracellular polyhydroxyalkanoates (PHAs), using energy from the internally stored glycogen. During the subsequent aerobic period, the stored PHA is used as electron donor in aerobic respiration, as a carbon source to replenish the glycogen store, and for cell growth. This characteristic cycling of carbon has to date only been described for GAOs and for polyphosphate-accumulating organisms (PAOs), the organisms responsible for enhanced biological phosphorus removal. GAOs are relevant to this process as they compete with PAOs for carbon [10].
This study used microscopic techniques to investigate granular sludge enriched for the GAO phenotype. The structure and microbial composition was determined and then correlated with the activity of the component microorganisms, using microsensors. Microsensors are powerful tools to describe the activity of microbial communities with high spatial resolution. In this study, we used a novel biosensor for volatile fatty acids (VFAs) [11] and we thus present the first measurements of the microscale distribution of acetate in bacterial granules. Investigation of the microscale properties of granules is essential to the understanding of such complex systems.
2 Materials and methods
2.1 Reactor set-up, operation, and batch tests
GAOs were enriched in a 4.2-l SBR in 4-h cycles that consisted of 1.5-h anaerobic, 2-h aerobic, 25-min settling and 5-min decant periods. The reactor was operated with a hydraulic retention time of 8 h and a solids retention time of 6.6 days. Reactor steady state was monitored by measurement of the mixed liquor suspended solids for 100 days and analysis of PHA and glycogen from samples taken at the end of the anaerobic and aerobic periods for the week prior to the experiments.
Synthetic wastewater was fed during the first 10 min of the anaerobic period. Acetate was used as the carbon source, fed to an initial concentration in the reactor of 3.06±0.07 mmol l−1 (6.12±0.14 C-mmol l−1). The acetate concentration at the end of the anaerobic period was monitored to assure that all acetate was taken up under anaerobic conditions. Prior to the cycle study, measurements of supernatant acetate, and hydrolysable carbohydrate and cellular PHA were made at the beginning and at the end of each cycle on four different days to assure reproducibility. During the cycle study, the same analysis were performed on samples collected at 15-min intervals. Hydrolysable carbohydrate is used to measure the intracellular glycogen though it may include glucose from other sources.
Batch tests were performed under anaerobic conditions to determine the acetate uptake rate. Two separate tests were performed with initial acetate concentrations of 3.14 mmol l−1 (initial concentration in the parent reactor) and 6.28 mmol l−1.
For further information about the composition of the feed, the reactor set-up, and procedures for chemical analysis, see Zeng et al. [12].
2.2 Size distribution of aggregates
A small volume of sludge was mounted on a microscope slide and a minimum of 100 images at 10×magnification were taken at random positions. Image analysis was performed using ImageJ (http://rsb.info.nih.gov/ij/) to calculate the area of each aggregate, and the diameter was determined by assuming a circular shape. The lower detection limit was set at a diameter of 20 μm.
2.3 Microsensors
Oxygen microsensors (tip diameter <10 μm) were constructed as previously described [13], and a biosensor (tip diameter=30 μm) for VFAs was constructed as recently described [11]. The principle of the biosensor is immobilisation of a pure culture of denitrifying bacteria in front of an electrochemical nitrous oxide sensor. The bacteria are supplied with nitrate and nutrients (except a carbon source) from a medium reservoir inside the sensor. Under anaerobic conditions the bacteria oxidise VFAs diffusing into the sensor from the surrounding environment and simultaneously reduce nitrate to nitrous oxide, which is detected by the electrochemical transducer.
The sensors were connected to picoammeters and mounted on a motor-controlled micromanipulator (Unisense, Århus, Denmark). Profiles were measured by moving the sensor stepwise into a granule placed on a mesh in a flow cell with an upward flow (Fig. 1) similar to the set-up previously described [14]. The medium in the flow cell had the same nutrient composition as the medium in the parent reactor. Only granules with a diameter larger than approximately 500 μm were used for microsensor measurements.

Diagram of the flow cell used for microsensor measurements.
Acetate profiles were measured at 0.20, 0.40 and 0.80 mmol l−1 acetate (3.14 mmol acetate l−1 was the initial concentration in the parent reactor). The flow cell was kept anaerobic during measurements by flushing with N2. A sample of sludge was taken at the beginning of the anaerobic period, and profiles were measured at one particular acetate concentration for the following hour. This was repeated with new granules until a number of replicate profiles were obtained at different acetate concentrations.
For oxygen profiles, granules were taken from the reactor at the end of the anaerobic period, and oxygen profiles were then measured after different lengths of exposure to air-saturated media without acetate. Oxygen profiles showing the endogenous respiration were measured after incubating the granules under these conditions for 18 h.
2.4 FISH and chemical staining
Samples for FISH and chemical staining were fixed with 4% paraformaldehyde [15]. The fixed samples were embedded for cryosectioning in OCT (TissueTek, Sakura, USA) by immersion for one day each in: sucrose (15% w/v), then 1:3 OCT:sucrose, 1:1 OCT:sucrose, 3:1 OCT:sucrose, then neat OCT. Embedded samples were then frozen and 5- and 20-μm sections were cut on a cryotome (Kryo 1720, Leitz, Germany) and transferred to microscope slides. The OCT was removed by immersion in distilled water. The samples were then dehydrated by sequential immersion of the slides for 3 min in 50%, 80% and 98% ethanol, and air-dried.
Fluorescence in situ hybridisation was performed [15], with probes EUBMIX, for all bacteria [16], and with GAOQMIX comprising equal amounts of GAOQ431 and GAOQ989, specific for ‘Candidatus Competibacter phosphatis’[17], henceforth referred to as Competibacter. Samples were visualised with a BioRad Radiance 2000 confocal laser-scanning microscope (CLSM) collecting 8-bit images for each fluorochrome sequentially. Fluorescein isothiocyanate and the iodocarboamide dyes Cy3 and Cy5 were excited with an argon laser (488 nm), a helium neon laser (543 nm) and a red diode laser (637 nm) and collected with 500–530 nm BP, 550–625 nm BP and 660 LP emission filters, respectively.
Quantification of the images was made with image analysis of 10 randomly selected fields from sections of five different granules. The area containing Cy3-labelled GAOMIX cells was quantified as a percentage of the area of Cy5-labelled EUBMIX cells. The area of specific cell signal was expressed as a mean percentage (±S.E.M.) of the area of bacterial cell signal for the 10 images. These methods are slight adaptations of those previously reported [17].
Granule sections analysed by FISH and documented by CLSM were subsequently washed in distilled water and stained with Nile blue A [18]. Fields visualised with FISH were again located and imaged on the CLSM using the Cy3 settings (above). Images obtained by FISH were used for organism identification and Nile blue A images were used to determine the cells containing intracellular PHA.
The time course of PHA utilisation was investigated by taking samples from the reactor at the end of the anaerobic period, at 30 min and 75 min into the aerobic period, and at the end of the aerobic period. Samples were fixed and sectioned (as above) and stained with Nile blue A. Epifluorescence images (Zeiss filter set 15) and differential interference contrast images were taken in the same microscopic field on a Zeiss Axiophot microscope with a VarioCam CCD camera (PCO Optics, Germany). The depth of PHA accumulation was determined as a average (n=21) of measurements from images of 10 individual granules.
2.5 Scanning electron microscopy (SEM) and toluidine blue staining of embedded sections
Samples were fixed in 3% glutaraldehyde (in 0.1 mol l−1 cacodylate buffer), and then postfixed in 1% osmium tetroxide (in 0.1 mol l−1 cacodylate buffer). The samples were then dehydrated through a graded acetone series.
Granules were embedded in Epon and sectioned at 1 μm using an ultramicrotome. Epon embedded sections were stained with toluidine blue and visualised using transmitted light microscopy. Intact dehydrated granules were also prepared and visualised by SEM.
3 Results
3.1 Reactor performance and characteristics
Samples taken periodically at the end of each cycle over the week prior to the cycle study (mean±1 S.D., n=4) showed PHA values 14.98±1.08 and 4.72±0.41 C-mmol l−1, and glycogen 22.60±0.78 and 30.47±1.18 C-mmol l−1 at the end of the anaerobic and aerobic periods, respectively. The cycle study (Fig. 3) confirmed that the reactor demonstrated the GAO phenotype and the acetate, PHA and glycogen values each fell within 1 S.D. of the mean values measured at the end of the aerobic and anaerobic periods over the week.
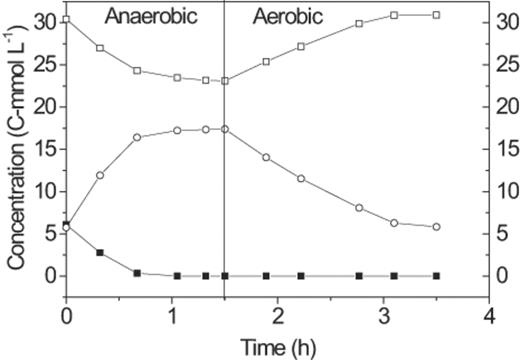
Carbon transformations of a typical anaerobic–aerobic cycle of the GAO-enriched SBR: hydrolysable carbohydrate (◻), PHAs (○), and acetate (▪).
The sludge consisted of aggregates from small flocs to granules, ranging in size between approximately 20 and 1200 μm in diameter (Table 1). The aggregations above about 500 μm in diameter had a distinctly granular structure (Fig. 2) while the particles smaller than 500 μm were more diffuse and only occasionally contained aggregation of the density seen in the larger granules.
Size distribution of the sludge aggregates in the reactor
| Size range (μm) | Relative abundance (by surface area) (%) |
| >800 | 12 |
| 400–800 | 20 |
| 200–400 | 33 |
| 20–200 | 35 |
| Size range (μm) | Relative abundance (by surface area) (%) |
| >800 | 12 |
| 400–800 | 20 |
| 200–400 | 33 |
| 20–200 | 35 |
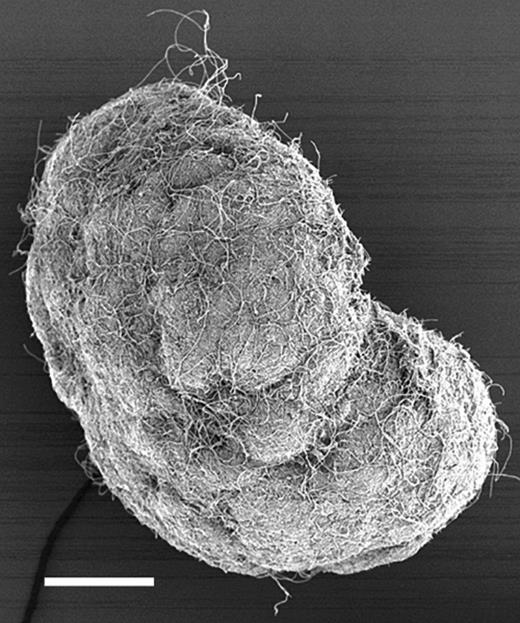
Scanning electron micrograph of a whole granule. Bar=100 μm.
Batch tests for determination of the acetate uptake rate showed a linear decrease in the acetate concentration over time from 6.28 mmol l−1 to approximately 0.60 mmol l−1 (Fig. 4), and the rate was thus zero order at concentrations above 0.60 mmol l−1.
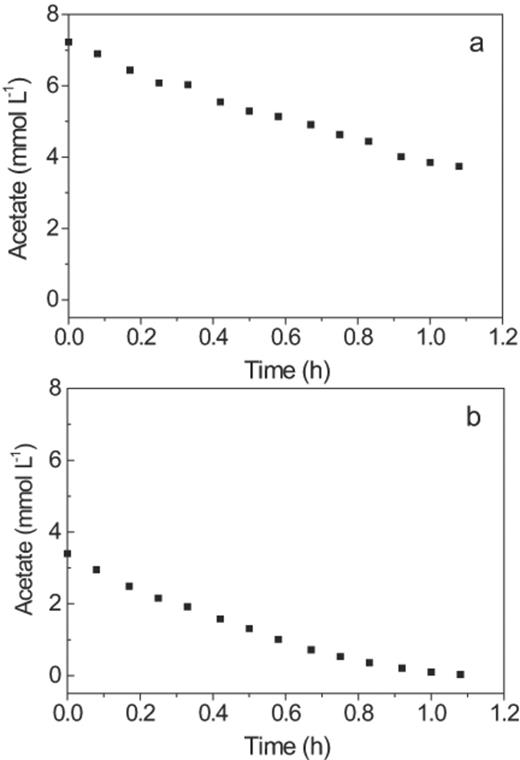
Batch tests for acetate uptake by the GAO-enriched sludge with initial concentrations of (a) 6.28 mmol l−1 and (b) 3.14 mmol l−1.
3.2 Microscale distribution of activity
The granules consisted of a dense layer of cells, surrounding a central region with only few cells (Fig. 5). This structural pattern was repeatedly observed in granules larger than 500 μm in diameter. FISH quantification showed that these granules were almost entirely composed of Competibacter (80±2.5%).
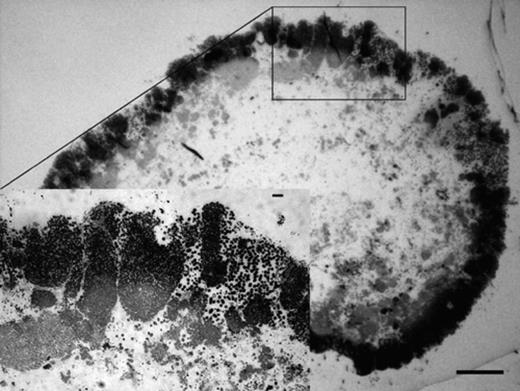
Transmitted-light images of Epon-embedded granule sections, stained with toluidine blue. The inset image shows the detail in the indicated region. Bar=100 μm and 10 μm (on the inset image).
Competibacter cells contained PHA at the end of the anaerobic period (Fig. 6), but not at the end of the aerobic period, hence they were producing and consuming PHA as per the GAO phenotype. Furthermore, they were the only organisms in the granules cycling PHA in this manner. Some unidentified filamentous organisms contained PHA but they were not observed to produce PHA anaerobically nor consume it aerobically, and were therefore contributing only in a relatively small amount to the overall PHA turnover that was occurring during each reactor cycle (Fig. 3).
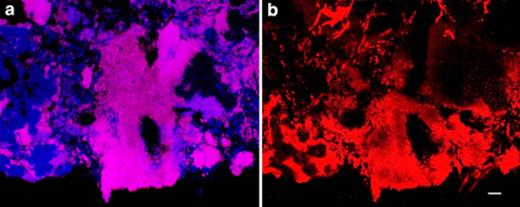
Confocal laser-scanning micrographs of (a) FISH and (b) Nile blue A (specific for PHA) stained cells, sampled at the end of the anaerobic period. Both images are taken for the same microscopic field. a: Competibacter (GAOQMIX) are magenta while all other Bacteria are blue. b: Areas that do not contain Competibacter cells as determined by FISH do not contain PHA. Bar=10 μm.
PHA accumulation by Competibacter occurred in a layer 85±12 μm in from the surface of the granule, while Competibacter cells further into the granule showed no accumulation (Fig. 6). Microsensor profiles (Fig. 7) showed that at 0.80 mmol l−1, (approximately 25% of the SBR operating concentration), acetate was present throughout the granule, but the concentration profile indicated that consumption of acetate occurred only near the surface of the granule. At bulk water concentrations of 0.20 and 0.50 mmol l−1 all of the acetate diffusing into the granule was being consumed and the concentration in the centre of the granule was zero.
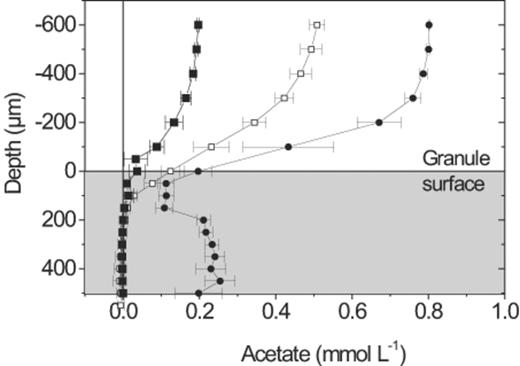
Acetate microsensor profiles measured at bulk liquid acetate concentrations of 0.2 (▪), 0.5 (○), 0.8 (●) mmol l−1. Error bars=S.D.
Samples taken at time points during the aerobic period (Fig. 8) demonstrated that PHA was initially consumed by cells at the surface of the granule and over time the zone of PHA consumption moved further into the granule. By the end of the aerobic period very little PHA was observed except that within the filamentous cells described above.
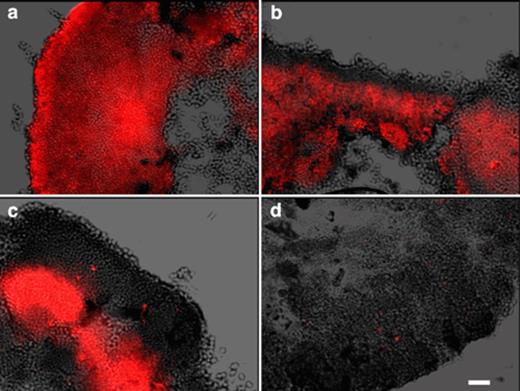
A superimposition of differential–interference contrast images and epifluorescence images taken of Nile blue A stained granule sections. Samples were taken at (a) the beginning of the aerobic period, (b) 30 min and (c) 75 min into the aerobic period and (d) at the end of the aerobic period. Bar=10 μm.
Microsensor profiles (Fig. 9) showed that the penetration depth of oxygen gradually increased during the aerobic period. However, all profiles measured within the first 2 h of oxygen exposure showed oxygen did not penetrate further than 100 μm. A sudden change in the oxygen profiles was observed if the exposure to oxygen was extended beyond 2 h, the time applied for aerobic period in a normal cycle of the SBR. At this time, oxygen diffused further into the granules, indicating that the uptake rate had decreased abruptly (data not shown). Oxygen profiles showed the maintenance respiration, which could be measured after exposing the granules to air for several hours (Fig. 9). These profiles indicated that even though oxygen penetrated the entire granule, endogenous consumption did not occur in the central region of the granule.
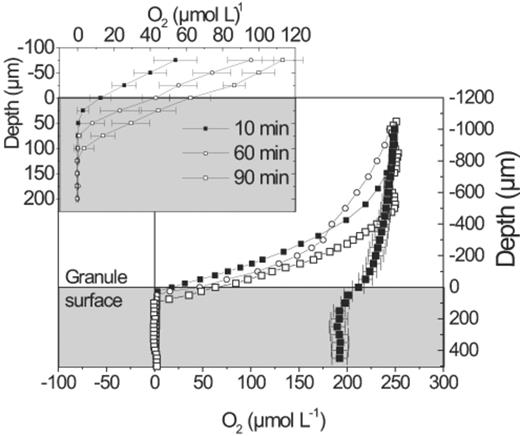
Oxygen microsensor profiles measured after 10 min (▪), 60 min (O), 90 min (◻), and 18 h of continuous aeration (♦). The insert shows the mean of three replicate profiles in the region of the granule surface. Error bars= S.D.
4 Discussion
4.1 Granule structure and distribution of metabolic activity
The biomass in the SBR grew abundantly as granules rather than as flocs, and such aggregation increases the potential for mass transport limitation due to the larger diameter of the aggregates, and the high cell density resulting in higher substrate uptake rates per volume of aggregate.
The granules investigated in this study were 500–1200 μm in diameter, however the activity of GAOs was limited to a zone of less than 100 μm from the granule surface due to mass transport limitation. The depth of this zone was quantified by the accumulation of PHA under anaerobic conditions, and supported by the distribution of acetate uptake (Fig. 7) under anaerobic conditions and the distribution of oxygen uptake under aerobic conditions (Fig. 9). The acetate profiles indicated an activity zone about 50 μm wider than that suggested by the other two methods, but this discrepancy was likely caused by the limited spatial resolution (50 μm) of the relatively large acetate biosensor. Furthermore, the hydrodynamic regime around such a thick sensor may have compressed the diffusive boundary layer, leading to the increased acetate penetration. The centre of some of the granules had elevated acetate concentrations and we expect this to be a result of convective flow of substrate through cracks in the granule surface, observed by SEM in some granules. However, this only caused acetate to enter the central part of the granules at bulk substrate concentrations above approximately 0.80 mmol l−1 acetate.
The activity of GAOs was restricted to the outer 100 μm, despite the fact that Competibacter were present further into the granules; and microsensor profiles showed that acetate was available throughout the granule, even at a bulk substrate concentration of 25% of the initial concentration in the anaerobic period. Only the penetration of oxygen could explain the distribution of GAO activity, and mass transport limitation of this substrate was therefore determining the distribution of metabolically active GAOs.
The GAO phenotype is defined by the ability to take up acetate anaerobically and convert it to PHA, utilising internally stored glycogen as an energy source. The PHA is subsequently used for energy production and replenishment of the glycogen store under aerobic conditions. In this metabolism, glycogen is the link between the electron donor (acetate) present during the anaerobic period, and the electron acceptor (oxygen) available during the aerobic period. As the cells in the layers deeper than 100 μm into the granules were not exposed to oxygen, glycogen would not be replenished and the capacity of the cells to take up acetate in the anaerobic period would be reduced. Continued lack of oxygen and inability of the cells to take up acetate would eventually cause reduction in cell activity and possibly death. The decrease in density in the centre of the granules was most likely caused by cell lysis due to lack of metabolic activity.
4.2 Causes of oxygen mass transport limitation
Penetration of oxygen into an aggregate depends mainly on the bulk substrate concentration and on the rate at which it is consumed by the biomass. In this study, the concentration of oxygen in the aerobic period was less than 10% (mol/mol) of the initial concentration of acetate in the anaerobic period, and it is thus not surprising that oxygen and not acetate was the substrate to be subject to mass transport limitation. The low solubility of oxygen in water does not allow oxygen to be present in a high concentration regardless of the aeration intensity.
In addition, the high oxygen uptake rate of the dense mass of GAOs initially caused oxygen to penetrate only a few micrometers into the active biomass. However, this high rate of activity could only be maintained while the cells still contained PHA. The supply of internal electron donor thus limited the oxygen uptake rate of each individual cell. Thus, oxygen gradually penetrated further into the granule during the aerobic period, as the cells closest to the surface became exhausted of PHA (Figs. 8 and 9). While the activity of each cell is limited by the amount of PHA it stored during the anaerobic period the overall volume of GAO activity is limited by the duration of the supply of oxygen. When the duration of oxygen exposure was extended beyond 2 h, equivalent to the aerobic period used in the operating SBR, the penetration depth rapidly increased as all the GAOs in the granule had been exhausted of PHA.
The penetration depth of oxygen was therefore not only a function of the uptake rate and the bulk substrate concentration, but also a function of the duration of the aerobic period. This characteristic movement of the location of activity further into the granule over a time period of minutes would be unique to granules composed of organisms that utilise an internally stored substrate for oxidation with an externally supplied electron acceptor.
A major fraction of the mass transfer resistance was caused by the diffusive boundary layer surrounding the granules. As seen in Fig. 9, the oxygen concentration at the surface of the granule is reduced by 70–90% compared to the bulk oxygen concentration (air saturation). The hydrodynamic conditions and hence the external mass transfer resistance of the granules in the reactor may differ from what is observed during microsensor measurements in the flow cell, but it is not readily possible to measure the thickness of the diffusive boundary layer surrounding the granules in suspension within the reactor. An accurate, quantitative comparison of substrate uptake rates and the temporal movement of the activity zone in the granules of the reactor and granules in a flow cell is thus not possible. However, the excellent consistency of the activity distribution results in the granules obtained by the different methods indicates that the substrate concentration profiles measured in the flow cell are likely representative of those found in the reactor.
4.3 Mass transport limitation and reactor kinetics
The effect of substrate transport limitation is important to consider when substrate uptake rates are used to describe kinetic parameters, such as the maximum uptake rate (Vmax) and the half-saturation constant (Km) for modelling of wastewater treatment processes. In this study, batch tests investigating the acetate uptake rates of the total biomass showed zero-order uptake kinetics at bulk substrate concentrations higher than 0.60 mmol l−1, while at concentrations below this threshold the acetate uptake rate decreased. A reduced uptake rate by the biomass at low substrate concentrations could be attributed to enzyme kinetics, or to substrate transport limitation occurring in at least a fraction of the biomass. The observed change in rate occurs at the substrate concentration, below which microsensor profiles show that mass transport limitation occurs and can at least partially be explained by this. Mass transport limitation thus complicates the determination of kinetic parameters of granule forming bacteria.
5 Conclusion
The presence of dense and highly active aggregates of microorganisms can lead to mass transport limitation, creating zones of different chemical environments. In the granules studied, diffusion of oxygen from the bulk liquid to the active biomass was found to limit the microscale distribution of activity within the aggregate to a layer no deeper than 100 μm from the surface. Furthermore, the separation in time of the availability of the electron donor and the electron acceptor facilitated a unique situation where the depth of oxygen penetration, and therefore the distribution of metabolic activity, was dependent on the duration of the aerobic period. The combination of microscopy with microsensors provided detailed insight into how substrate availability and the activity of the microorganisms affect the overall structure of these granules. The granules studied represent one example of aggregate-forming microorganisms, and bacterial aggregates in full-scale treatment plants vary in structure, composition, and activity depending on the conditions in the plant. However, the results pin-point the complexity of studying substrate uptake of aggregate-forming bacteria, particularly when the substrates for a particular process are not supplied at the same time. Such microscale investigations are an essential complement to large-scale process studies as they can distinguish between mass transfer effects and the biochemical characteristics of an investigated biomass, and should be used to generate accurate and generically applicable kinetic information essential to wastewater treatment plant modelling, design and optimisation.
Acknowledgments
We wish to thank Rick Webb, Centre for Microscopy and Microanalysis, University of Queensland, for performing the electron microscopy and Romain Lemaire for running the reactor. This project was funded by the CRC for Waste Management and Pollution Control, a centre established and supported under the Australian Government's Cooperative Research Centres Program and The Danish Technical Research Council.
References
