


Abstract
The mycelial growth form of eucarpic fungi allows for a highly effective spatial exploration of the soil habitat. However, understanding mycelial spread through soil has been limited by difficulties of observation and quantification of fungi as they spread through this matrix. We report on a study on the effects of soil structure by altering the soil bulk density, on the spatial exploration of soil by the fungus Rhizoctonia solani using a soil thin-sectioning technique. First we quantified fungal densities in microscopic images (0.44 mm2). At this scale, hyphae were either absent, or present as minor fragments, typically occupying less than 1% surface area of the thin section. From contiguous microscopic images we then produced large-scale (6.21 cm2) spatial distribution maps of fungal hyphae. These maps were superimposed onto soil structural maps, which quantify the degree of porosity in each microscopic image. Alterations in soil structure by changing the bulk density are shown to affect the distribution of the fungus within the soil. The volume of soil explored by the fungus increased with increasing bulk density. This was associated with a shift from a few large pore spaces to more evenly distributed small-scale pores. Fungal hyphae were present in all porosity classes within each bulk density, including areas that contain less than 5% visible pore space. However, fungal hyphae were more often found in areas with a higher porosity, in particular at low soil bulk densities. The results show that soil structure is a major component in the spatial exploration of soil by fungi.
1 Introduction
A basic characteristic of eucarpic fungi is their mycelial growth form, which enables a highly effective spatial exploration of habitats [1]. This is particularly important for saprotrophic and parasitic activity in soil [2,3]. As soils are a complex three-dimensional physical framework, mycelia must extend through the heterogeneous networks of pores, to enable them to locate nutrients. Most studies with fungal growth in soil have been carried out with little attention to the soil structure within which the mycelia grow and microbial interactions occur [4]. In this paper we report on growth patterns of the fungus Rhizoctonia solani introduced into a mineral soil.
Prior studies mostly dealt with the effects of temperature, water potential and other components on the dynamics of mycelial growth on artificial surfaces [5] or over soil surfaces [6]. Until recently, difficulties of observation and quantification of fungi have limited our understanding of mycelial spread through soil. Current studies have involved using a variety of techniques such as radiolabelled isotopes [7] or baiting [8] to quantify fungal growth in soil. Persson et al. [7] looked at the distribution of radiolabelled isotopes which had been incorporated into the mycelium of nematode-trapping fungi growing in sterile soil. Their results showed that the radioactive tracing technique reflected the growth of fungus from the sprinkle plate method, and that fungal growth was correlated with the size of the food base. However, the method is destructive as the soil had to be removed for detecting fungal presence and also no information on the relationship with the structure of the soil was provided. The baiting technique implemented by Andersson et al. [8] was a non-destructive method to quantify the three-dimensional growth of wood-rotting fungus in contaminated soil. This involved using temporary baits of wood in the soil, which were removed, grown on selective media and then the fungus identified by polymerase chain reaction/restriction fragment length polymorphism. The results provide quantitative data on the three-dimensional growth rate and pattern of the fungus in non-sterile soil. However, there is no information on the spatial distribution of the fungus in the context of the soil structure.
Recent studies have shown that mycelial exploration through soil is influenced by soil physical characteristics since hyphae must ramify through the complex heterogeneous network of pores [3,9,10]. The effects of physical conditions on hyphal spread are difficult to ascertain because of the geometric complexity of the pore networks [11]. Furthermore, soils are comprised of interdependent solid, liquid and gaseous phases, where altering one of the components could indirectly affect the other phases or associated processes. Many factors may modulate fungal growth in soils, such as nutrient availability, pH, aeration, and microbivory [12]. Previous studies of the spread of fungi through soil have shown that soil physical conditions can also play a significant role in controlling the growth of mycelia [3,4,10,13]. Glenn et al. [9,13] and Otten et al. [3] argue that one of the principal limiting factors to fungal growth in soil is the availability of air-filled pore space. The connectivity and tortuosity of air-filled pore networks are dictated by the architecture of the soil and the interaction between the pore networks and water [14].
Field soil exhibits significant spatial heterogeneity on many scales [15]. Even in controlled experimental systems it is therefore difficult to prescribe soil structure precisely. In this paper we describe the use of aggregate size and bulk density to manipulate soil structure as an experimental variable. This enabled us to define repeatable soil samples with identical air-filled pore volume in which the geometry of that pore volume was altered by aggregate size and bulk density. The fungus R. solani, a ubiquitous soil saprotroph and facultative parasite [16], was introduced locally into the replicated samples. We produce high-resolution thin sections to quantify how soil structure affected: (i) the amount of hyphae at microscopic scales (0.44 mm2), at which soil–hyphal interactions occur; (ii) the total hyphal biomass at the colony scale (6.21 cm2); (iii) the spatial distribution of hyphal biomass. We obtained spatial distribution maps of fungal hyphae from contiguous microscopic images, superimposed these maps onto soil structural maps which quantified the degree of porosity in each image, and tested if the microscopic heterogeneity in soil affects the spatial distribution of fungal hyphae.
2 Materials and methods
2.1 Production of fungal inoculum
Potato dextrose agar (PDA) plates were inoculated with anastomosis group 4 isolate (R3) of R. solani Kühn and incubated for 3 days at 23°C. Poppy seeds (Papaver somniferum L.) were autoclaved at 120°C at 1.1 atm for 1 h twice with a 2-day interval. The sterilised seeds were subsequently sprinkled over the PDA plates previously colonised by R. solani, and incubated at 23°C for 3 days.
2.2 Soil
An arable sandy loam (Caprow; organic matter, 2.6%; sand, 71%; silt, 19%; clay, 10%; pH 6.2) from Bullion Field, an experimental site at the Scottish Crop Research Institute, was used in this study. The soil was air-dried, sieved to an aggregate size of 1–2 mm, and sterilised by autoclaving at 120°C at 1.1 atm for 1 h twice with a 2-day interval. The particle density (γs=2.52 Mg m−3[10]) of the soil was used to calculate the porosity, ε, for soil at dry bulk densities, ρb, of 1.2, 1.3, 1.4, 1.5 and 1.6 Mg m−3 (ε=1−ρb/γs).
2.3 Preparation of soil cores
Appropriate masses of soil were packed into polypropylene cylinders (6 cm diameter, 5 cm high), to attain bulk densities of 1.2, 1.3, 1.4, 1.5 and 1.6 Mg m−3, with an air-filled pore volume of 0.17 for each bulk density. The bulk properties of the samples are summarised in Table 1. Three replicate cylinders per treatment were prepared. To obtain identical air-filled pore volume, the soil was wetted with an appropriate volume of sterile distilled water and left for 24 h to equilibrate prior to packing. Cylinders were packed using five 1-cm layers, and one pre-colonised poppy seed was centrally placed onto the surface of each successive compressed layer except for the final layer. The cores were sealed in polypropylene bags and incubated at 23°C for 5 days. This temperature was chosen, as it is the optimum temperature for this isolate and to ensure consistency with previous work involving the same isolate [4,17].
Physical characteristics of soil samples through which fungal growth was determined
| Bulk density (Mg m−3) | Gravimetric water content (g g−1) | Volumetric water content | Total porosity | Air-filled pore volume |
| 1.2 | 0.29 | 0.35 | 0.52 | 0.17 |
| 1.3 | 0.24 | 0.31 | 0.48 | 0.17 |
| 1.4 | 0.19 | 0.27 | 0.44 | 0.17 |
| 1.5 | 0.15 | 0.23 | 0.40 | 0.17 |
| 1.6 | 0.12 | 0.20 | 0.36 | 0.17 |
2.4 Preparation of soil thin sections
Soil thin sections were prepared according to the basic method of Nunan et al. [18] and Tippkötter and Ritz [19]. After incubation of the soil cores, they were placed into 250-ml polypropylene beakers raised from the base by two wooden rods.
2.4.1 Fixation and staining
A filtered (Whatman GF/F) aqueous solution of glutaraldehyde (2.5%) and fluorescent brightener 28 (0.2%) (Sigma, UK) was poured gently into the bottom of each beaker until the soil sample was immersed to fix and stain the mycelia. The beakers were then placed in a desiccator and a pressure of 0.6 bar applied for 10 min. The beakers were left to incubate at room temperature for a further 1.5 h at the end of which the solution was removed from the base of the beakers by gentle suction.
2.4.2 Dehydration
The samples were subsequently dehydrated with a graded series of acetone:water solutions, comprising 70% acetone for 24 h, twice in 90% acetone for 24 h each, three times in 100% acetone for 2 days each, and 100% dry acetone for 2 days. Dry acetone was obtained by adding molecular sieve type 3A pellets to a bottle of 100% acetone. Each solution was poured gently into the bottom of each beaker until the sample was immersed. After each acetone change the beakers were placed in a desiccator and a pressure of 0.6 bar applied for 10 min, then left to incubate at room temperature for the specific time interval allocated for each acetone concentration (as above).
2.4.3 Resin impregnation
The final acetone solution was removed and a formulation of Crystic XB52n9 resin, catalyst ‘M’ and accelerator ‘G’ (Scott Bader, Northants, UK), mixed at ratios of 100:0.6:0.3, by volume, was gently poured into the bottom of each beaker until the sample was immersed. The beakers were placed in a desiccator and a pressure of 0.6 bar applied overnight at room temperature. The beakers were removed from the desiccator and left to polymerise for 10 days at room temperature, and then at 40°C for 4 days to harden.
2.4.4 Sectioning
Sections were produced in the horizontal plane through the middle of the cured soil/resin samples. Rectangular blocks were cut from the impregnated and cured samples with a diamond saw (Buehler, Coventry, UK), using paraffin oil as a coolant. Blocks of approximately 3×4×2 cm were produced. A face of each block was flattened and polished using diamond then silicon carbide papers on a Metaserv 2000 grinder/polisher (Buehler). The polished surfaces were cleaned with Ecoclear, a non-solvent cleaning fluid (Logitech, Glasgow, UK), and isohexane. The clean surfaces were attached to a microscope slide (50×76 mm) using the resin mixture, prepared as above except at ratios of 50:0.6:0.3, by volume, and left to cure for 48 h. The bonded blocks were cut to a thickness of approximately 800 μm using a Petro-thin (Buehler, Illinois, USA), ground evenly to approximately 30 μm on the Metaserv 2000 grinder/polisher and polished by hand on paper coated with a 6-μm, followed by a 1-μm, diamond paste to finish. Finally, coverslips were bonded to the thin sections using Eukitt quick hardening mounting medium (Agar Scientific, Essex, UK).
2.5 Production and analysis of hyphal distribution maps
The system for image acquisition consisted of an epifluorescence microscope (Zeiss, Axiophan 2), with a high-pressure mercury bulb (HBO 103 W/2), filter block 1 (BP 365/12, FT 395, LP 397) and Plan-Neofluar ×10 lenses (magnification 100×) (Zeiss), and a digital video camera (JVC, model KY F55B) linked to a PC. By means of a computer-controlled scanning stage, the entire central area of 27×23 mm of each thin section was imaged at this magnification as a series of 1400 contiguous fields of view, each 0.77×0.58 mm (Fig. 1). The inoculum was situated in the centre of these sections. The image sets were stored onto CD-R for subsequent analysis. Hyphae were clearly present in images due to their distinct blue fluorescence as a result of staining by the fluorochrome (Fig. 1). To establish an appropriate classification for the degree of hyphal colonisation, 100 single images were selected at random for each bulk density. Each image was visually scored for hyphae and allocated to one of the following classes: 0 (no hyphae); 1 (minor fragments of hyphae); 2 (low hyphal density, c. 1–5% of image area containing hyphal fragments); 3 (medium hyphal density, c. 5–15%); 4 (very high density, c. 15–100%); or unscorable, where assessment was not possible due to crystallisation of the stain, resulting in a high degree of background fluorescent flare (Table 2). Since on average 90% of these 1500 images fell into classes 0, 1 or unscorable, the classification system was simplified to absence, presence or unscorable. For each replicated section, 1400 contiguous fields of view were then scored visually using this scheme, resulting in a series of maps of hyphal distribution within each section (Fig. 1).

The production of large-scale hyphal distribution map from contiguous microscopic images. Black kernels denote hyphae present and white kernels denote hyphae absent. The expanded microscopic image (0.77×>30 μm (light region) and fungal hyphae, which appear as white strings. The section shows typical low densities of fungal hyphae that are mainly observed in the pore space between more dense soil mass.
Hyphal densities that occur within a fungal colony spreading through soil
| Class | Approximate density (surface area covered %) | Relative frequency | |||||
| 1.2 Mg m−3 | 1.3 Mg m−3 | 1.4 Mg m−3 | 1.5 Mg m−3 | 1.6 Mg m−3 | Mean | ||
| 0, no fungal hyphae | 0 | 0.85 | 0.54 | 0.25 | 0.35 | 0.46 | 0.49 |
| 1, minor fragments | 0–1 | 0.09 | 0.30 | 0.51 | 0.44 | 0.44 | 0.36 |
| 2, low hyphal density | 1–5 | 0.02 | 0.03 | 0.13 | 0.19 | 0.10 | 0.09 |
| 3, medium hyphal density | 5–15 | 0 | 0 | 0.01 | 0.01 | 0 | 0.01 |
| 4, very high hyphal density | 15–100 | 0 | 0 | 0 | 0 | 0 | 0 |
| Crystals | N/A | 0.04 | 0.13 | 0.09 | 0.01 | 0 | 0.05 |
2.6 Production of pore network distribution maps
Pore maps for the corresponding central (27×23 mm) area of each thin section were obtained by successively imaging the areas using bright-field and cross-polar transmitted illumination. These sections were imaged in one pass, i.e. at a lower magnification, using a stereo microscope (Olympus MO21, Olympus Optical, London, UK) and digital colour video camera (JVC, model TK-1280E). The cross-polar image was subtracted from the bright field to segment transmission pore spaces (i.e. pores that penetrated the depth of the thin sections, c. 30 μm). The images were then thresholded using Zeiss KS300 Imaging System 3.0 to produce binary pore maps, where white represents pore space and black represents soil matter with pores of diameters less than 30 μm. In order to match the spatial resolution of the mycelial maps (i.e. 0.77×0.58 mm), the pore maps were then deresolved by dividing the images into 1400 contiguous quadrats, and calculating the mean pixel value to within 1% within each quadrat: this equates to the average porosity of each quadrat (Fig. 2). At this experimental scale we denote the average porosity hereafter as porosity class. The hyphal distribution and deresolved porosity maps were then overlain (Fig. 2). Thus it was possible to associate the presence of hyphae with the porosity of the soil at each location.
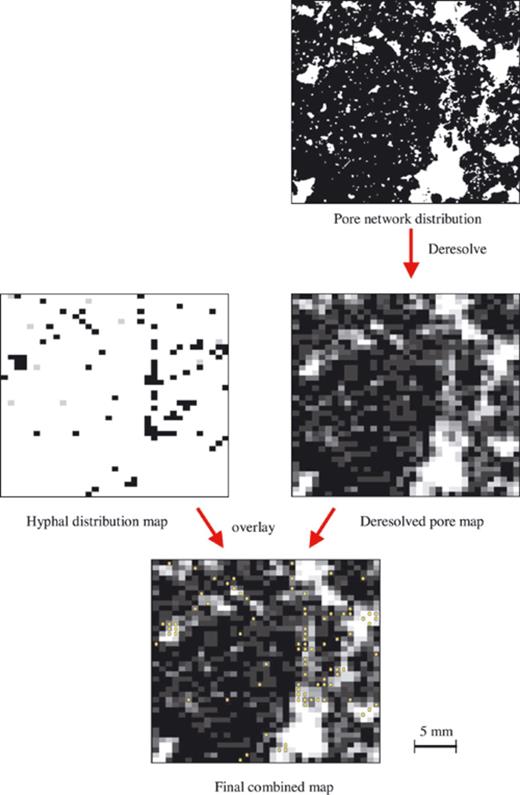
Diagram illustrating the stages in superimposing maps for pore and hyphal distributions.
2.7 Analysis of spatial distribution of hyphae
The spatial distribution of hyphae was tested for departure from complete spatial randomness using Ripley's K function [20] within the statistical package S+ SPATIAL STATS (S-PLUS Corp., Mathsoft, Seattle, WA, USA). The K function for the hyphal distribution maps was compared with the upper and lower K functions of 100 simulations of complete spatial randomness. Where the hyphal distribution maps lay within the complete spatial randomness envelope, the distribution was considered to be random. The distribution was considered clustered above the envelope and regular, below.
For each treatment the fraction of each porosity class that contained fungal hyphae, ph, was calculated as the ratio of the number of microscopic images (0.77×0.58 mm) that contain hyphae and the total number of images in a thin section belonging to a specific porosity class. Assuming a binomial distribution for this fraction, the generalised linear model procedure within the statistical package GENSTAT (Numerical Algorithms Group, Oxford, UK) was used to test for a correlation between the fraction of fungal presence and the porosity class, using a χ2 test at a level of significance of 0.05.
3 Results
3.1 Characterisation of the pore networks within the soil matrix
The soil thin sections were examined at two scales: (i) the mesoscopic scale (27×23 mm), corresponding to the size of a fungal colony, and (ii) the microscopic scale (approx. 0.77×0.57 mm), which is a scale suitable for quantification of hyphal density in soil (see below). Sections differed in visible pore space at the mesoscopic scale amongst the bulk density treatments. For all treatments, only the fraction of the pore space that contained transmission pores larger than 30 μm was visible. About 39% of the pore volume was visible in the sections (Table 3). The black areas in the section were interpreted as areas containing porosity with pore diameters smaller than 30 μm.
Visible pore space in the two-dimensional sections in relation to soil bulk density
| Bulk density (Mg m−3) | 1.2 | 1.3 | 1.4 | 1.5 | 1.6 |
| Mean visible pore volume | 0.20 | 0.21 | 0.18 | 0.15 | 0.13 |
| Ratio of mean visible pore volume to total porosity (Table 1) | 0.38 | 0.43 | 0.42 | 0.37 | 0.35 |
| Bulk density (Mg m−3) | 1.2 | 1.3 | 1.4 | 1.5 | 1.6 |
| Mean visible pore volume | 0.20 | 0.21 | 0.18 | 0.15 | 0.13 |
| Ratio of mean visible pore volume to total porosity (Table 1) | 0.38 | 0.43 | 0.42 | 0.37 | 0.35 |
At each bulk density, the mean value (n=3) of visible pore space in a thin section, given as a fraction of the area of the thin section transmitting light, is compared with the porosity in the three-dimensional soil sample. The total three-dimensional porosity is calculated from the bulk density using a particle density of 2.52 Mg m−3. The ratio gives the fraction of the three-dimensional pore volume that is visible in a two-dimensional section.
The bulk density also affected the small-scale structure of the soil (Fig. 3). Soil packed at the lowest bulk density contained large gaps surrounded by more dense areas. Increasing the bulk density led to a progressive reduction in large voids. A quantitative measure of the small-scale heterogeneity in soil structure was obtained by quantifying the porosity in contiguous microscopic images (0.77×>95% pore space within each section (comprising 1400 images) decreased from 4.5% at a bulk density of 1.2 Mg m−3 to <0.2% for densities of 1.4 Mg m−3 and higher, indicating the significant differences in pore geometry amongst the bulk density treatments.
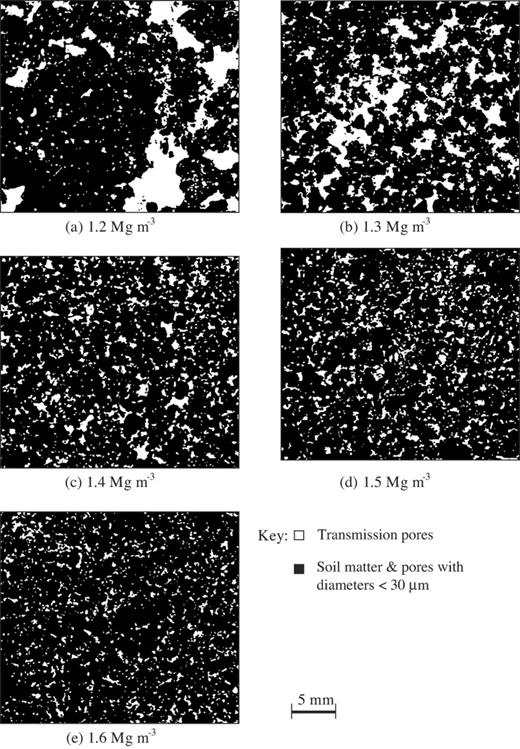
>30 μm within the soil matrix generated by different bulk densities.
3.2 Microscopic quantification of fungal hyphae in soil
Fungal hyphae of R. solani were easily detected by microscopic observation of the thin sections (magnification 100×, field of view 0.77×0.57 mm). At this scale, R. solani was visible under fluorescent light as fragments of fungal hyphae in the soil matrix (Fig. 1). Typically, hyphae were present in void spaces between more dense solid mass (Fig. 1). Closer and thorough observation of the soil matrix at higher magnifications did not reveal fungal hyphae within these structural elements, indicating that R. solani preferentially followed the larger pores usually provided by inter-aggregate pore space. With the exception of a few areas close to the inoculum source, all fields of view contained either no hyphae, or small fragments (<1%, cf. Fig. 1 and Table 2). At the scale of observation the hyphal density classes were therefore effectively the same, and hence it is reasonable to use the proportion of sites occupied by the fungus as a qualitative measure of hyphal density within the different treatments.
Sterile soil was used in this study to facilitate the detection of R. solani. In preliminary studies, autoclaved sterile soil was not inoculated with R. solani. Analysis of thin sections derived from these soils at 100× magnification showed that there was no fungal presence and images viewed at 630× confirmed an absence of other microbial cells. Observation at high-power magnification confirmed that the cores remained axenic with respect to Rhizoctonia. Bacteria, clearly visible at high magnification [18], were never observed. All hyphae observed were of similar appearance and their morphology was characteristic of that of Rhizoctonia spp., i.e. hyphal diameter between 3 and 17 μm and branches produced at right and acute angles to the main hypha [16]. Therefore, we are confident that the fungal fragment observed in the thin sections did belong to R. solani.
The fluorescent brightener used stained β1,4-glucan links [21] and hence is not a vital stain. However, the study above provided evidence that any dead hyphae present in the soil, prior to growth of Rhizoctonia, do not normally stain.
3.3 The effect of bulk density on the distribution of hyphae within the soil matrix
At the mesoscopic scale, the bulk density of the soil had a significant impact on the spread and spatial distribution of R. solani hyphae. The percentage of the mapped areas containing hyphae increased as the bulk density of the soils increased from 1.2 to 1.4 Mg m−3, but stabilised thereafter at around 60% (Fig. 4). The spatial distribution of hyphae was patchy at lower soil bulk densities (Fig. 5). Analysis of hyphal distribution using Ripley's K function showed randomness in the distribution of hyphae in the soil sections when large-scale distribution maps of fungal hyphae were superimposed onto the deresolved porosity map (Fig. 5). It was apparent that hyphae were situated in fewer sites within the available pore space, and appeared to be associated more with the edges of larger void spaces at low bulk densities (Fig. 5a,b). An association between small-scale porosity and fungal presence was less apparent at higher bulk densities, possibly because areas of large void spaces were not present, and overall hyphal density was higher (Fig. 5c–e).
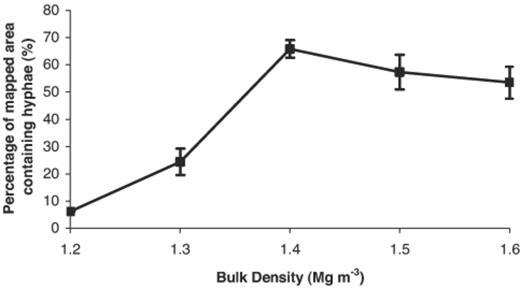
Presence of hyphae of R. solani within mapped areas of thin sections (27×23 mm) at different bulk densities (point show means, n=3; S.E.M. shown).
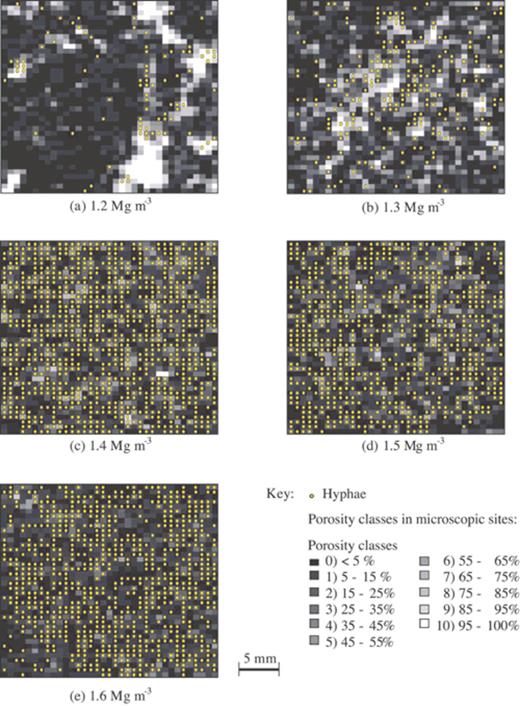
Distribution maps of mycelia of R. solani overlaying porosity maps at different bulk densities.
To quantify the relationship between small-scale porosity class and fungal presence we calculated the proportion of images in each porosity class that contained hyphae. This revealed that: (i) fungal hyphae were present in all porosity classes, including images that contained <>30 μm), and (ii) there was more often fungus in areas with lower porosity classes. The strength of the relationship, measured by the regression coefficient of this proportion against porosity class on the logit scale, decreased with bulk density (Fig. 6a), indicating that predominance in areas with more pore space was more apparent at low bulk densities. To illustrate this more clearly we back-transformed the data and plotted the relative predominance against bulk density (Fig. 6b). The relative predominance is here defined as the ratio of the proportion of fungal presence at the highest porosity class (sections with 95–100% visible pore space) and the proportion of fungal presence in the lowest porosity class (sections with <5% visible pore space). The relative predominance is in agreement with the visual observation of the hyphal distribution maps (Fig. 5), and shows that fungal hyphae are predominantly located in larger void spaces when soil is packed at low bulk densities.
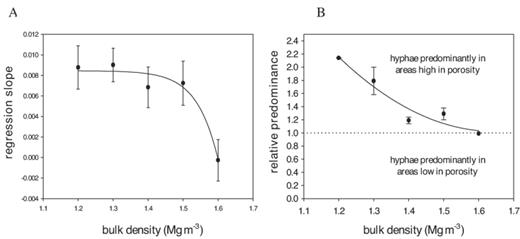
Summary of the analysis of the relationship between fungal presence and the small-scale porosity for soil samples that were packed at mean bulk densities ranging from 1.2 to 1.6 Mg m−3. The mean strength of the relationship (n>95% visible porosity) and the lowest porosity class (<>1 indicates a preference for sites with a higher porosity.
4 Discussion
The growth of fungi through soil involves spreading through a heterogeneous three-dimensional framework of tortuous pores [4,22]. Manipulation of the soil framework is one of the principal means by which microbial dynamics, in particular fungi, can be regulated at the small scale with effects that may be realised in the field [23]. Regulation of microbial dynamics by this means occurs through the fragmentation in habitat space, water and substrate distribution and the spatial arrangement of pore pathways [14].
In this study, we changed the soil bulk density to alter the geometry of the pore volume as clearly illustrated by the pore network maps (Fig. 3). The water content was also selected to ensure that the air-filled pore volume through which R. solani predominantly spreads is identical amongst the bulk density treatments.
Soil bulk density had a significant impact upon the spatial organisation of R. solani growing through the soil volume. The spatial distribution of hyphae was patchy at lower bulk densities and the volume of soil that contained hyphae increased with bulk density, between 1.2 and 1.4 Mg cm−3. Generalisation of these results must be done cautiously: the results are concerned with a central radial region of the fungal colony (20 mm) in which density of hyphae is expected to be high in non-sterile soil. Nevertheless, the results are consistent with previous studies with R. solani by Glenn and Sivasithamparam [9] and Otten et al. [3]. Glenn and Sivasithamparam [9] demonstrated that the density of hyphae within soil differed with bulk density, with more hyphae per gram of soil in compacted than in uncompacted soil. Otten et al. [3] showed that small colonies with high biomass densities are formed when the spread of the fungus is restricted by blockage of pores with water. Higher hyphal densities were also reported for the take-all fungus Gaeumannomyces graminis when spreading through compacted soil [13]. We conjecture that this is caused by a reduction in the continuity of the macro- and meso-pore space as the soil is compacted (Fig. 3).
The spatial architecture of the pore networks and the distribution of water within the pore volume can also restrict the flow of gases, such as oxygen and carbon dioxide. The aeration of the soil plays an important role in the distribution of soil micro-organisms, especially fungi [14]. R. solani is known to be more sensitive to carbon dioxide accumulation than most other soil microbes [9]. The rate of diffusion of oxygen is 104 times faster through air than water; therefore the amount and spatial distribution of water has serious consequences for the diffusion rate of oxygen [24]. Glenn and Sivasithamparam [9] and Otten et al. [3] demonstrated that the air-filled pore volume is a significant factor in dictating fungal spread. Further work is necessary to discriminate between soil structural and other physical processes, such as gaseous diffusion, on the growth of soil fungi.
The technique of soil thin sectioning was used for this study as it allowed for the visualisation of hyphae within the context of the soil matrix. The fidelity of the system, in terms of preserving the mycelial network, is high. Visual observations of the thin sections show that the mycelial networks appear intact and that they are characteristic of living mycelial systems observed in undisturbed soil microcosms. Small fragments of hyphae were predominantly present in the images from the thin sections. However, the mycelia were observed to be structurally intact as hyphae were clearly visible across the pore space; therefore loss during preparation is unlikely.
Hyphae might not be visualised due to ineffective staining. This could be due to the predominant presence of older mycelia and melanised hyphae, as fluorescent brightener reacts more effectively with actively growing fungi and bacteria [21,25,26]. However, in this study, fungal growth occurred over 5 days resulting in a prevalence of young hyphae, which bind stain more efficiently. From the visual observations of the thin sections the results obtained are qualitatively similar to Otten et al. [3], where they use monoclonal antibody-based immunosorbent assay to quantify the amount of active fungal biomass in a soil sample. The thin section technique provides novel information about the spatial distribution of the fungus and soil structure, and a visual representation of where micro-organisms reside within the pore network at high resolution [18,27]. However, the technique is time-consuming to produce the final sections and only transmitted pores above 30 μm in diameter are visible, thus compared to other techniques such as the dispersal method [28] it is not appropriate for estimating the amount of fungal biomass present.
The distribution and size of the pore pathways generated by different bulk densities had a significant impact on the distribution of hyphae within the soil matrix. Increasing the bulk density led to a shift from a few large pore spaces to more evenly distributed small-scale pores and hyphae becoming more abundant. This suggests that there is a degree of association between mycelial distribution and pore networks.
There are many factors that can influence fungal growth, such as resource availability and microbivory [12]. The system used in our study was axenic. However, in non-sterile soil other organisms are present which compete with each other for oxygen, nutrients and habitat space. Competition is high for nutrients within non-sterile environments and almost invariably, introduced micro-organisms, such as R. solani, are outcompeted by adapted and established indigenous organisms [4,29]. As well as the other organisms regulating each other, they are also being regulated by the structure of the soil and the distribution of water within the pore network.
The distribution, size and quality of substrate present in the soil can affect the activity of soil-borne fungal mycelia [30]. The quality and quantity of substrate was unlikely to be the limiting factor in fungal spread, as the soil was sterilised by autoclaving. Autoclaving causes the soil to release large quantities of soluble carbon as well as ammonium N and amino acids [31], therefore providing an abundant source of nutrients. A larger total quantity of substrate would have been present at the higher soil bulk densities since a larger mass of soil was packed into the cores. However, the distribution of nutrients within the pore networks may also have varied and could affect the spread of the mycelium as mycelial growth (energy expenditure) is often proportional to substrate availability [30,32]. The results here were consistent with studies of fungal colony growth using non-sterile soil, suggesting that substrate availability was unlikely to be the dominant factor in our experiments [4,9,13]. The correlation between spatial distribution of mycelium and the microscopic structure of the soil further indicates that the soil structure had an effect on the fungal exploration of soil (Fig. 5).
Fungi play an essential role in maintaining critical ecological balances in soil, upon which many environmental processes depend. Until now, our understanding of fungal dynamics in soil has been limited by difficulties of observation, identification and quantification of these micro-organisms as they grow through the complicated structure of soil and in bridging the gaps between the microscopic scale and the larger scale processes. In this paper we have linked experimentation in soil physics (to control and quantify soil structure) with soil microbiology (to quantify hyphal and colony growth in situ) in order to quantify soil–fungal interaction at scales ranging from millimetres to centimetres. We showed that soil structure is a major component governing the spatial exploration of soil by fungi.
Acknowledgements
This work is part of a linked research grant between the Scottish Crop Research Institute (SCRI) and the Epidemiology and Modelling Group in the University of Cambridge, funded by the Biotechnology and Biological Sciences Research Council (BBSRC), which we gratefully acknowledge. SCRI receives grant-in-aid from the Scottish Executive Environment and Rural Affairs Department. We would like to thank Dr Naoise Nunan from SCRI for his advice and assistance in the use of the spatial statistics.
References
