


Abstract
Viscosinamide from Pseudomonas fluorescens DR54 exerts a biocontrol effect on the plant pathogenic microfungi Pythium ultimum and Rhizoctonia solani. Evidence for physiological changes in these and four other fungi was obtained by vital fluorescent staining with Calcofluor white, Nile red, Syto 13, 3,3′-diheptyloxacarbocyanine, 5-(and-6)-carboxy FDA and 5-(and-6)-carboxy SNARF-1, acetoxymethyl, acetate. Based on studies of the fungi grown on solid agar medium and Calcofluor white staining, all isolates responded to viscosinamide treatment by an increased branching, sometimes including hyphal swelling and an increased septation. Further, the staining pattern indicated changes in the esterase activity, intracellular pH and mitochondrial organization and activity. Several of the fungi showed a reduced Nile red staining indicating a general decrease in hydrophobicity of cellular membranes or cell walls. In contrast, only Pythium spp. were stainable with the nucleic acid stain Syto 13 and showed changes in the nuclei in response to viscosinamide. Finally, it was shown that Calcofluor white, Nile red and Syto 13 could also be used to study fungal stress in situ using soil microcosms. The study demonstrated that combinations of vital fluorescent stains are suitable for detailed studies of fungal stress as induced by, e.g., bacterial antibiotics.
1 Introduction
Much evidence indicates that the biocontrol effect of antagonistic microorganisms on fungal plant pathogens depends to a large degree on the action of enzymes [1] or secondary metabolites [2]. There are, however, only a few studies of cellular responses of microfungi to such metabolites [3]. Monitoring of such cellular effects on target organisms is important in order to study biocontrol mechanisms, to detect the effects of applied antagonists in soil systems, to commercialize a biocontrol agent and to screen for new anti-fungal metabolites.
There is currently a large increase in the number of fluorescent stains developed for animal or human cell physiology and many of them may also be useful in the fungal physiology [4]. Fluorescein diacetate (FDA) staining of cell esterase activity and Calcofluor white staining of cell walls are commonly used in fungal studies, although the latter cannot be regarded as a true vital stain as it interferes with the fungal chitin synthesis [5]. Several recent examples of the use of vital fluorescent stains in fungi [3,6–9] further demonstrate their potential to study the fungal stress physiology. Finally, the advantages of using the commercially available vital fluorescent stains in ecological studies are also numerous. Many of them show highly specific reactions with cell components. The stains are normally used in low concentrations and do not interfere significantly with the activity of the organism under study. Several stains are stable for a relatively long period of time making them useful in time-course studies.
In the present study, the main objective was to select a battery of vital fluorescent probes detecting cellular changes in the two plant pathogenic fungi Pythium ultimum and Rhizoctonia solani, when these were challenged by the new antibiotic viscosinamide. The compound is a cyclic lipopeptide [10] produced by Pseudomonas fluorescens DR54 and is reported to be a biocontrol agent against P. ultimum and R. solani [11]. Non-target fungi, Pythium oligandrum, Rhizopus arrhizus, Trichoderma harzianum and Antrodia vaillantii, were included in the study to compare the staining reactions and the effect of viscosinamide. In the selection of stains, we first tested a larger number of candidate compounds to obtain a set of stains targeting a number of structural components including organelles or serving as indicators of cellular activity. Further, two criteria were important in the stain selection to study the fungi in situ in soil microcosms. Firstly, differences observed after staining between viscosinamide-treated and untreated control hyphae should be visible at a low magnification. Secondly, the application of the stains in in vitro studies should be simple, thus avoiding permeability agents, stain removal or counterstaining. The selected stains were eventually applied to P. ultimum and R. solani growing in a soil microcosm to test their applicability for in situ studies.
2 Materials and methods
2.1 Microorganisms and media
The test fungi were the oomycetes P. ultimum Trow HB2 (var. ultimum) from the Højbakkegård field station in Denmark and P. oligandrum Dreschler 1010 (Plant Pathology Section, The Royal Veterinary and Agricultural University, Copenhagen, Denmark), the zygomycete R. arrhizus Fischer 83,467 (Department of Microbial Ecology, Lund University, Lund, Sweden), the ascomycete T. harzianum Rifai T3 from a Pythium suppressive sphagnum peat [12] and the basidiomycetes R. solani Kühn AG-4 from a diseased sugar beet root (Danisco Seed, Holeby, Denmark) and A. vaillantii De Candolle from a railway sleeper in Sweden (Department of Forest Products, Swedish Agricultural University, Uppsala, Sweden).
The fungi were maintained on potato dextrose agar (PDA) (Difco Laboratories, Detroit), but were otherwise grown on GAsnM (glucose, asparagine and mineral medium) according to Olsson (1995) [13]. In this low nutrient medium, microscopy was facilitated because the mycelial density was relatively low. In experiments for determination of the biomass in liquid culture, the 5×GAsnM medium without agar was used.
2.2 Vital fluorescent stains
The following stains were tested but did not meet our criteria for stain selection for this study: Fluo-3 (Molecular probes F-1241), ethidium bromide (Sigma E-8751), FDA (Sigma F-7378), Oregon green (Molecular probes O-6151), Syto live-cell nucleic acid stains 11-16 and 20-25 in the sampler kits # 1 (S-7572) and # 2 (S-7554) and YO-PRO (Molecular probes Y-3603). These stains either did not stain the fungi, showed no difference between viscosinamide-treated hyphae and untreated hyphae, showed significant probe bleaching or were expensive compared with other probes with similar features.
From the initial tests, the following stains were selected: Calcofluor white (Sigma F-3397), Nile red (Sigma N-3013), Syto 13 (Molecular Probes S-7575), 3,3′-diheptyloxacarbocyanine (DIOC7(3)) (Molecular Probes D-378), 5-(and-6)-carboxy FDA (CFDA) (Molecular Probes C-195) and 5-(and-6)-carboxy SNARF-1, acetoxymethyl, acetate (Snarf-1) (Molecular Probes C-1271). Stock solutions of the stains were made at 1 mg ml−1 in DMSO except for Calcofluor white (Sigma Fluorescent Brightener 28) which was made at 1 mg ml−1 in 50 mM phosphate buffer. The working concentration in staining solutions (μl stock solution ml−1 MilliQ water) and staining times were as follows: Calcofluor white at 3 μl ml−1 for 15 min, Nile red at 2 μl ml−1 for 20 min, Syto 13 at 0.1 μl ml−1 for 15 min, DIOC7(3) at 0.02 μl ml−1 for 60 min, CFDA at 4 μl ml−1 for 20 min and Snarf-1 at 1 μl ml−1 for 30 min.
The effect of fluorescent stains on the radial growth of P. ultimum and R. solani was tested. The fluorescent stains were incorporated into GAsnM agar at the working concentrations. Three replicates per treatment were performed and controls were grown on pure GAsnM and on GAsnM supplemented with 4 μl DMSO ml−1 medium as this was the highest amount of carrier used in any of the experiments. Fungal inocula were applied as 8-mm agar plugs from a PDA plate. The radius of the fungal colonies was determined after growth at 25°C.
2.3 Fluorescence staining on agar plates
Fungal inocula were picked from young cultures growing on GAsnM agar plates. A total of 90 μg HPLC-purified viscosinamide from a stock solution in methanol (9 μg μl−1) was applied to glass fiber filters (7 mm diameter) (GF/C, Whatman). The filters were left in the laminar flow bench for 15 min to evaporate the methanol before being placed at a distance of 1 cm from the fungal inocula on GAsnM plates. After incubation at 20°C overnight, the plates were flooded with the staining solutions.
2.4 Fluorescence staining in soil microcosms
In the soil microcosm shown in Fig. 1, the same amount of viscosinamide as above was applied to the center of a 42.5-mm GF/C (Whatman) filter and the methanol was allowed to evaporate. An 1×1-cm agar plug with fungal inoculum was placed in a Petri dish. The filter with viscosinamide was wetted in tap water and placed on top of the fungal inoculum. The Petri dish was then filled with sandy loam soil (13% water, w/w, homogenized by sieving through a 2-mm sieve) from a fallow field at the Højbakkegård field station. The plates were incubated at 20°C for 2 days.
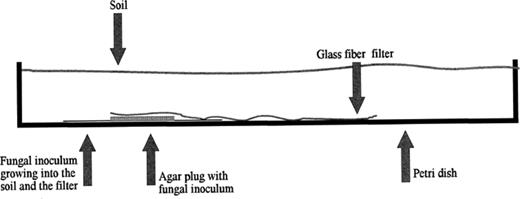
Schematic drawing of the soil microcosm. The fungal inoculum was placed in the bottom of a Petri dish. A pre-wetted glass fiber filter with viscosinamide in the center was placed on top of the agar plug with fungal inoculum. The Petri dish was then filled with soil. See the text for details on incubation and staining of fungal mycelium.
The staining solutions were applied to the fungi in the soil microcosm by pipetting three times 100 μl solution into the glass fiber filters. The solutions were readily absorbed and spread within the filter. By applying the solutions to three places in the filter, a fairly even staining of the fungi was obtained in the whole filter. The fluorescent stains were applied in the same concentrations as in the agar studies. If no staining of the fungi was observed, the stain concentration was increased 10-fold.
2.5 Fluorescence microscopy
A Zeiss Axioplan epifluorescence microscope mounted with a 50-W Osram light bulb was used to detect the fluorescence staining of fungi growing on agar plates using objectives with the following magnifications and numerical apertures: 10/0.3, 20/0.5 and 40/0.75. The filters used for fluorescence microscopy were as follows. Green H546: excitation filter BP 546/12, chromatic beam splitter FT 580 nm, barrier filter LP 590 nm; Blue 450–490 nm: excitation filter BP 450–490 nm, chromatic beam splitter FT 510 nm, barrier filter LP 520 nm; UVG365: excitation filter G365, chromatic beam splitter FT 395 nm, barrier filter LP 420 nm. Photographs were taken with Fujicolor 400 ISO films using an attached Olympus OM-4Ti camera body.
For the soil microcosm studies, a Nikon Eclipse TE 300 inverted microscope mounted with a super high pressure Hg 100-W lamp was used. The following filters were used for fluorescence microscopy: UV excitation filter 330–380 nm and a barrier filter 420 nm; Blue light excitation filter 450–490 nm and a barrier filter 520 nm; Green light excitation filter 510–560 nm and a barrier filter 590 nm.
2.6 Effects of viscosinamide on the radial growth and biomass production of the fungi
Growth experiments with P. ultimum and R. solani on plates challenged with viscosinamide were carried out essentially as described above. The radial growth was determined after incubation for 2 days at room temperature (20–22°C) by measuring the distance from the edge of the agar plug to the edge of the fungal colony. Six replicates of the different treatments were made.
The biomass production of R. solani was studied in a liquid culture. Here, the inoculum was made by growth of the fungus on a sheet of sterile cellophane placed on PDA plates. After incubation of the PDA plates at 25°C for 3 days, 8-mm (in diameter) plugs of the mycelium were placed in Petri dishes which received 5 μl viscosinamide dissolved in DMSO (8.7 mg ml−1) at the start of the experiment or pure DMSO (5 μl per plate) for the control. The plates were incubated at 25°C for 3 days before the mycelium was harvested. The mycelium was then removed and after rapid drying on a filter, the mycelial mats were dried by incubating at 55°C for 24 h before the dry weight was determined.
3 Results
3.1 Selection of vital fluorescent stains for studies of growth and cellular activities in microfungi
Calcofluor white, Nile red, Syto 13, DIOC7(3), CFDA and Snarf-1 met our criteria for stain selection, thus representing a range of fluorescent stains that could be used for the detection of selected hyphal structures as well as cellular activities. Hence, the growth of the fungi on media containing the fluorescent stains generally showed that the radial extension was not affected by any of the stains. One exception was P. ultimum where the radial growth was reduced from 24 mm to 12 mm in the presence of Syto 13 and to 17 mm in the presence of CFDA. In contrast, Calcofluor white, which has previously not been regarded as a true vital stain due to its effects on the chitin synthesis [5], did not affect either P. ultimum or R. solani as studied by the radial growth and microscopic examination of the fungal hyphae. Finally, in the actual assays, the exposures of the fungi to the stains were always short (5–120 min) before examination and the negative effects on fungal activities were thought to be negligible.
Application of the panel of stains to the test fungi of widely different taxonomic affiliation showed distinct differences in staining patterns. The microscopic observations of the six fungi (untreated with viscosinamide) are summarized in Table 1. Further, Figs. 2A–7A show selected micrographs of observations made with the six stains on untreated hyphae of the oomycete P. ultimum and the basidiomycete R. solani.
Microscopic observations of P. oligandrum, P. ultimum, R. arrhizus, T. harzianum, A. vaillantii and R. solani
| Group | Species | Structural components | Organelles | Intracellular activities | ||||||
| Wallsa | Septaa | Hydrophobic membraneb | Lipid bodiesb | Nucleic | Mitochondriad | Esterasee | pH-sensitive esterasef | Mitochondriad | ||
| Oomycete | P. oligandrum | + | + | + | + | + | + | + | ||
| Oomycete | P. ultimum | + | + | + | + | + | + | + | ||
| Zygomycete | R. arrhizus | + | + | + | + | + | + | + | ||
| Ascomycete | T. harzianum | + | + | + | + | + | + | + | + | |
| Basidiomycete | A. vaillantii | + | + | + | + | + | + | + | ||
| Basidiomycete | R. solanii | + | + | + | + | + | + | + | ||
The table shows structural components, organelles and intracellular activities of undisturbed fungal hyphae visualized with the stains: Calcofluor white (walls and septa), Nile red (membranes and lipid bodies), Syto 13 (nuclei), DIOC7(3) (mitochondria), CFDA (esterase activity) and Snarf-1 (pH-sensitive esterase activity).
aCalcofluor white.
bNile red. Images of membranes were optimal with green light excitation (green H546), whereas lipid bodies were optimal with blue light excitation (blue 450–490).
cSyto 13.
dDIOC7(3).
eCFDA.
fSnarf-1.
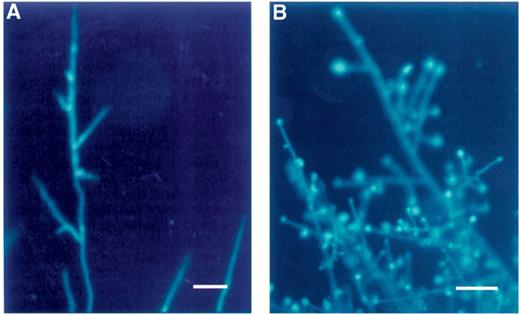
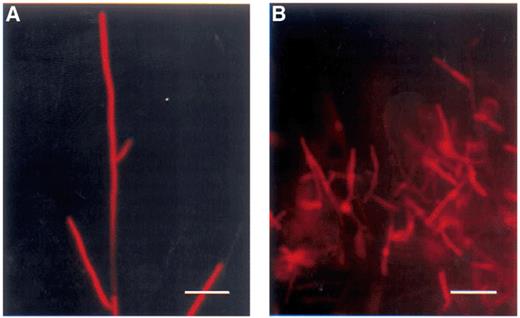
Cell walls and septa of R. solani stained with Calcofluor white. (A) Untreated fungus. The hyphae were straight with few branches. (B) Treated with viscosinamide. The hyphae were highly branched. An UVG365 filter was used for fluorescence microscopy. Bar=40 μm.
Nile red-stained R. solani hyphae visualized in blue light excitation. (A) Untreated fungus. Intensive yellow fluorescence of the hyphal tips. Very small spots (lipid bodies) are distributed within the hyphae. (B) Treated with viscosinamide. The apical parts of the hyphae show a reduced fluorescence compared to the control. A blue 450–490 filter was used for fluorescence microscopy. Bar=20 μm.
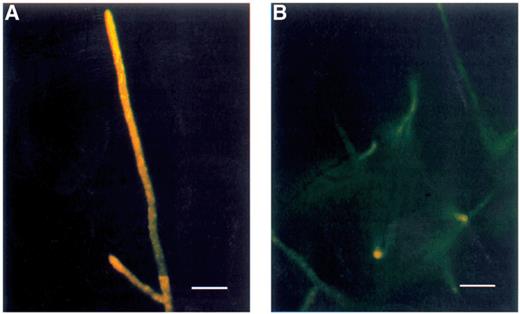
CFDA staining of R. solani for detection of esterase activity. (A) Untreated fungus. A high fluorescence intensity in untreated hyphae indicates a high esterase activity in these actively growing hyphae. A general cytoplasmic staining is seen in the tips whereas the esterase activity or the fluorescent product is retained in interconnected vesicle type structures in the older parts of the hyphae. (B) Treated with viscosinamide. The hyphae show a strongly reduced fluorescence intensity. Light microscopy of the shown hyphae showed no significant difference in the hyphal diameter. The apparent size difference between the hyphae in Fig. 7A and B is due to differences in fluorescence intensity. A blue 450–490 filter was used for fluorescence microscopy. Bar=50 μm.
R. solani hyphae stained with Snarf-1. (A) The fluorescence intensity of the tips is high in untreated hyphae whereas other parts of the hyphae are non-fluorescent. This indicates a high esterase activity in these actively growing hyphae. (B) In viscosinamide-treated hyphae, the fluorescence was largely reduced or absent. A green H546 filter was used for fluorescence microscopy. Bar=50 μm.
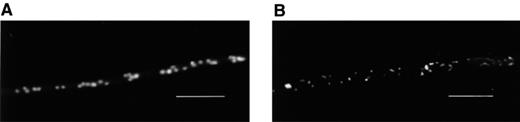
Nucleic acids of P. ultimum stained with Syto 13. (A) Untreated fungus. Nuclei were randomly distributed in the coenocytic hyphae. (B) Hyphae treated with viscosinamide. The randomly distributed nuclei were smaller than in the control and extranuclear staining was apparent. A blue 450–490 filter was used for fluorescence microscopy. Bar=15 μm.
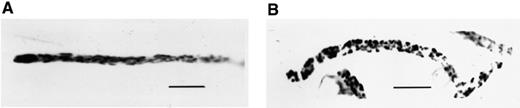
Mitochondria of P. ultimum stained with DIOC7(3). Negative image. (A) Untreated fungus. Filamentous mitochondria were present in the hyphae. In the tips, the densities of metabolically active mitochondria were high. (B) Treated with viscosinamide. The mitochondria in these hyphae, arrested in growth, appear as short rods compared to mitochondria in the non-disturbed hyphae. A blue 450–490 filter was used for fluorescence microscopy. Bar=15 μm.
Calcofluor white is commonly used to stain chitin- and glucan-containing cell walls in fungi [3] and growth patterns as hyphal branching may thus be easily observed in R. solani (Fig. 2A). The stain showed excellent wall staining in all the fungi and septation and the hyphal form could easily be studied at a higher magnification.
Nile red stains hydrophobic components of cell walls and intracellular membranes including lipid bodies [7]. Wall and membrane structures were invisible in the two oomycete Pythium spp., but were clearly visible at the hyphal tips in both the zygomycete R. arrhizus and the ascomycete T. harzianum. The basidiomycetes A. vaillantii and R. solani were also stained with Nile red, although the staining of walls and intracellular membranes was here diffuse throughout the mycelium (Fig. 3A). Although the hyphal fluorescence was the most intense with green light excitation, more details were frequently seen by blue light excitation. When exposed to blue light, large lipid bodies with yellow or red fluorescence [7] were seen in aerial hyphae of P. ultimum and in normal mycelia of P. oligandrum, R. arrhizus and T. harzianum, but were generally absent in the basidiomycetes A. vaillantii and R. solani (Table 1).
Syto 13 has been used for staining of nuclei in bacterioplankton [14] and animal cells [15–17] but stained only the oomycete Pythium spp. in our study (Table 1). The randomly distributed nuclei of approximately 1–3 μm size in the coenocytic hyphae of P. ultimum are seen in Fig. 6A.
DIOC7(3) has been used for visualization of mitochondria in many different cell types including fungal hyphae [6] and the fluorescence intensity has been positively correlated with mitochondrial activity [18]. In our study, DIOC7(3) stained the mitochondria in all the tested fungi (Table 1) as shown by the example in Fig. 7A. The mitochondria were typically shorter than the hyphal diameter in the fungi, except in A. vaillantii where the mitochondria were considerably longer. Individual mitochondria were generally difficult to resolve in the hyphal tip where their density was the highest, but could easily be distinguished within the older parts of the hyphae. In the septate fungi, we could observe that the mitochondria were often located in chains and along the periphery of the cell wall.
CFDA has been used for staining of esterase activity [19] and could be detected in the whole cell lumen of the two oomycete Pythium spp. (Table 1). In R. arrhizus, T. harzianum, A. vaillantii and R. solani, the whole cell lumen of hyphal tips was stained whereas the fluorescence seemed to be concentrated in vesicle-like, interconnected structures at distances greater than 100–500 μm from the tips [19]. An example is shown for R. solani in Fig. 4A.
Snarf-1 fluorescence staining also depends on cleavage of the compound by intracellular esterases. However, Snarf-1 is a pH indicator and may be used to assay the intracellular pH by ratio-imaging [4], since the stain shows no fluorescence at a pH below approximately 6.5. Staining with Snarf-1 was obtained in all fungi, but was sometimes concentrated in the actively growing tips of the hyphae (Table 1) as shown by the example of Snarf-1 staining of R. solani (Fig. 5A). The results indicated a higher pH in the hyphal tips of this fungus as the fluorescence was the strongest at the apex and disappeared at distances greater than 50–200 μm from the tip. The presence of a pH gradient behind the hyphal tip seemed likely, but would require a ratio-imaging technique [8] for verification including a correction for the efficiency of stain loading in different parts of the mycelium.
3.2 Cellular changes in P. ultimum and R. solani exposed to viscosinamide on agar plates
The inhibition experiments with P. ultimum and R. solani growing on agar were designed to simulate how the two plant pathogenic fungi react when they are challenged with the anti-fungal metabolite in soil. Viscosinamide was introduced at some distance from the fungal inoculum in order to let the tips meet the compound during active growth. As viscosinamide shows a low solubility in aqueous media [10], it remained in the filter on the agar surface, even after overnight incubation.
The results obtained with the vital fluorescent stains in viscosinamide-treated P. ultimum and R. solani are shown by the micrographs of cellular responses in Figs. 2B–7B and by the summary of results in Table 2. Extensive branching, an increased hyphal septation and swelling, an altered mitochondrial activity and structure, a decreased hydrophobicity of cell walls and membranes, a decreased intracellular esterase activity and a decreased intracellular pH were the typical responses to viscosinamide in the test fungi. The effects are described in detail for P. ultimum and R. solani in the following using all six fluorescent stains.
Microscopic observations of responses of P. ultimum and R. solani to viscosinamide
| Group | Species | Structural components | Organelles | Intracellular activities | ||||||
| Wallsa | Septaa | Hydrophobic membraneb | Lipid bodiesb | Nucleic | Mitochondriad | Esterasee | pH-sensitive esterasef | Mitochondriad | ||
| Oomycete | P. ultimum | Increased branching and swelling | No change | Smaller and extranuclear staining (6) | Shorter (7) | Lower activity | Lower activity | Lower activity | ||
| Basidiomycete | R. solanii | Increased branching and swelling (2) | Increased septation (8) | Weaker staining (3) | No change | Shorter | Lower activity (4) | Lower activity (5) | Lower activity | |
Fungal hyphae were stained with Calcofluor white, Nile red, Syto 13, DIOC7(3), CFDA and Snarf-1. THe table summarizes the typical responses to viscosinamide in comparison with untreated controls. (The numbers in brackets refer to micrographs in Figs. 2–8).
aCalcofluor white.
bNile red (see Table 1).
cSyto 13.
dDIOC7(3).
eCFDA.
fSnarf-1.
Calcofluor white. Structural changes in mycelia could easily be seen by the staining of walls and membranes with Calcofluor white and Nile red. Staining of P. ultimum and R. solani with Calcofluor white was particularly useful for the detection of morphological changes and growth patterns in the mycelium. Interestingly, R. solani responded to viscosinamide by a dramatic increase in hyphal branching (Fig. 2B). A highly increased number of septa and the appearance of hyphal swellings were also seen in this fungus, while a much less dramatic response was seen in P. ultimum (data not shown).
Nile red. Staining of P. ultimum with Nile red was unaffected by the viscosinamide treatment, while R. solani demonstrated a decreased fluorescence in the tips of treated hyphae (Fig. 3B) compared to those untreated.
Syto 13. Staining of P. ultimum with Syto 13 after exposure to viscosinamide generally showed smaller or more condensed nuclei than in the untreated control (Fig. 6B).
DIOC7(3). The DIOC7(3) staining showed that the mitochondrial activity and structure were strongly affected by viscosinamide in both fungi showing apparently shorter mitochondria than the normal filamentous ones in untreated mycelium. This is exemplified by the response of P. ultimum shown in Fig. 7B.
CFDA. Staining with CFDA for the detection of intracellular esterase activity was in both fungi weaker or absent in the hyphae challenged with viscosinamide as compared to the untreated hyphae. An example with R. solani is shown in Fig. 4B.
Snarf-1. Finally, the Snarf-1 stain indicated that viscosinamide caused a decrease of the intracellular pH in P. ultimum and R. solani after Snarf-1 staining (Fig. 5B).
3.3 Cellular changes in P. ultimum and R. solani exposed to viscosinamide in a soil microcosm
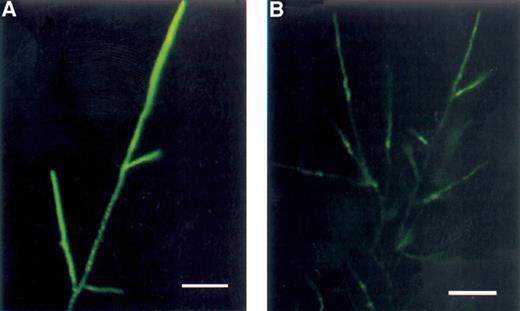
The six selected stains were finally tested with microfungi growing in soil microcosms. The plant pathogenic P. ultimum and R. solani were again the target organisms and the stains were generally applied in the same concentrations as in the agar growth experiments. However, if no signal was seen using the standard protocol, the stain concentration was increased 10-fold. Calcofluor white staining of R. solani growing in the soil microcosm was successful (Fig. 8A) and viscosinamide application to the soil microcosm induced increased branching and septation in R. solani (Fig. 8B) as observed in the agar growth experiments. Nile red staining of R. solani was also suitable and gave similar results to those obtained on agar, while P. ultimum could not be stained (data not shown). Syto 13 staining of P. ultimum in the soil microcosm was only possible at 10-fold stain concentrations while Syto 13 did not stain R. solani at either concentration (data not shown). Finally, staining of the fungi in the soil microcosms was also possible (but not optimal) with DIOC7(3), CFDA and Snarf-1. Hence, application of CFDA often resulted in a strong background staining, while the fluorescence intensity using DIOC7(3) and Snarf-1 was rather weak.
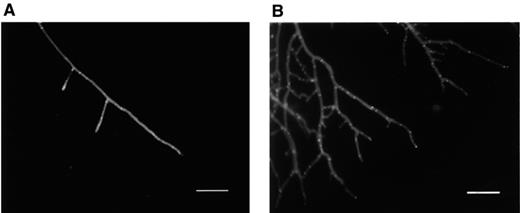
Mycelium of R. solani grown in a soil microcosm stained with Calcofluor white. (A) Untreated fungus. Straight long hyphal tip with few branches and septa. (B) Treated with viscosinamide. The hyphae were branched and highly septated. An UVG365 filter was used for fluorescence microscopy. Bar=80 μm.
3.4 Effects of viscosinamide on the growth of P ultimum and R. solani
The radial growth of P. ultimum on agar plates was not reduced significantly in the presence of viscosinamide. This was in great contrast to the radial growth of R. solani which was approximately 20 mm and approximately 8 mm on non-treated and viscosinamide-treated plates, respectively.
Since viscosinamide affected the radial growth of R. solani on plates, the effect on biomass production in liquid culture was also studied. No significant difference between the treatments was found, however, since the cultures developed a biomass of 7.1 mg±0.7 mg (S.E.M.) per Petri dish and 7.5 mg±1.2 mg (S.E.M.) per Petri dish in non-treated and viscosinamide-treated plates, respectively.
4 Discussion
4.1 The panel of vital fluorescent stains to study viscosinamide-induced fungal stress responses on agar and in soil
The comparison of several vital fluorescent stains for detection of physiological changes in fungi challenged with the antibiotic viscosinamide indicated that such stains have a great potential in monitoring fungal stress. The six stains selected in this study thus represented a panel of stains that could detect both cell walls, membrane structures, several organelles and intracellular activities. A combination of the stains further provides the opportunity to monitor a broad spectrum of important physiological features in the fungi. Interpretation of results from a single stain may sometimes be complicated, as in the case of CFDA and Snarf-1 where fluorescence depends on both intracellular (esterase) activity, the intracellular pH, membrane integrity (retaining of the stain) and the uptake of stain. However, justification of such results obtained with single dyes may be increased when several stains are applied. Despite the limited number of fungi tested, the comparison of six soil-borne fungi further demonstrated that the selected panel of vital fluorescent stains could be used to distinguish physiological features within all the major fungal classes.
For in situ studies, it was demonstrated that particularly Calcofluor white, Nile red and Syto 13 were useful in soil microcosms. The requirements were that the differences in staining patterns between viscosinamide-treated and untreated fungi should be large and could be resolved at a low magnification. Furthermore, the stain application should be simple to avoid post- or pre-treatment of samples. Staining of the fungi was also possible with DIOC7(3), CFDA and Snarf-1 in the soil microcosm, but fungal activities in the soil were probably too low to obtain a reasonable signal with DIOC7(3) and Snarf-1.
4.2 Effect of viscosinamide on the fungal growth
The results of the different growth experiments suggested that viscosinamide acted as a paramorphogen on R. solani. On agar, the fungus showed an increased branching and hyphal swelling, while there was no effect on the specific growth rate in liquid medium. The changes in morphology of R. solani in response to viscosinamide may therefore be a stress response reducing the potential of the fungus for exploring new nutrient sources.
4.3 Hypothesis for the mechanism of viscosinamide on fungal growth inhibition
The vital fluorescent staining showed that responses to the antibiotic viscosinamide in P. ultimum and R. solani included common physiological changes that may be general indicators of viscosinamide-induced stress in the fungi. Examples were the observations of a reduced fluorescence in hyphae when staining for mitochondrial activity, esterase activity and intracellular pH. Changes in the mitochondrial structure and organization also occurred in both fungi and are currently being studied in more detail by confocal microscopy (M. Hansen, C. Thrane, J. Sørensen, S. Olsson, unpublished). On the other hand, some of the vital fluorescent stains demonstrated unique responses in only one of the tested fungi, e.g. an increased branching, swellings and septum formation and a decreased hydrophobicity of the hyphae (R. solani) and a changed morphology of nuclei (P. ultimum). Using results from the whole panel of vital fluorescent stains, we attempted to deduce the mechanism by which viscosinamide may affect the growth and activity of the fungal cells.
Our preliminary hypothesis was that viscosinamide imposes ion channels in the target cells. The viscosinamide produced by P. fluorescens DR54 is chemically similar [10] to other ion channel forming molecules such as syringomycin produced by Pseudomonas syringae causing an increased Ca2+ and H+ influx in target cells [20]. Ca2+-ionophores may result in an increased branching as observed in Neurospora crassa [21] and swollen hyphae as shown in Hyphomyces chlorinus [22]. In our study, the dramatic branching and swelling of R. solani may therefore result from a ion channel formation in the presence of viscosinamide, leading to an increased Ca2+ influx.
The nucleic acid stains ethidium bromide and YO-PRO are normally cell impermeable and are used as indicators of structural disorders in membranes [4]. None of these stains could be loaded into viscosinamide-treated hyphae, however, which in turn indicated that viscosinamide did not induce extensive membrane disorder or destruction. A lipopolypeptide similar to viscosinamide from Bacillus cereus also had no major effects on the membrane integrity in spermatozoa [23]. When extensive pore formation in the membranes could be excluded, an extensive loss of fluorescent stain product from the viscosinamide-treated hyphae could also be ruled out. Differences in the fluorescence intensities using, e.g., CFDA and Snarf-1 were thus anticipated to reflect actual differences in the fungal esterase activity. Che et al. (1992) [24] showed that syringomycin leads to intracellular acidification by inhibition of the membrane-bound H+-ATPase. The reduced fluorescence in Snarf-1 staining of the hyphal tips in our study could thus be interpreted as intracellular acidification due to an elevated H+ influx after viscosinamide treatment. However, we could not exclude that this effect was secondary and reflected a general growth arrest of the fungus by disturbance of the membrane function (possibly by a primary increased Ca2+-influx effect) and hence, a subsequent dissolution of the intracellular pH gradient [25].
4.4 Future perspectives for studies of fungal stress
The selected panel of vital fluorescent stains proved to be useful to show differences between viscosinamide-treated and non-treated hyphae of the two plant pathogenic microfungi, P. ultimum and R. solani. The stains further gave some indications of a Ca2+-channel forming effect by which viscosinamide may act in the fungi. The selected stains, together with other vital stains, should therefore be helpful in further in vitro studies to elucidate the mechanism by which viscosinamide interferes with the fungal growth. It was further shown, in this study, that at least Calcofluor white, Nile red and Syto 13 readily may be used to study fungal growth in soil microcosms [26,27]. When fully developed for soil studies, an extended panel of vital fluorescent stains may be useful to monitor fungal stress responses under in situ conditions.
Acknowledgements
This study was supported by The Danish Ministry of Agriculture (contract number 93S-2466-Å95-00788) in cooperation with Danisco Seeds and Novo Nordisk a/s. We thank Dr D. Carling for typing the Rhizoctonia solani isolate, Dr Michael Hansen for useful dicussions and Dr Jonathan Crowe for commenting on the manuscript. Drs John Hockenhull and Dan Funck Jensen kindly provided the isolates of P. oligandrum and T. harzianum.
References
