


Abstract
We compared two methods for typing bacterial strains: electrophoretic lipopolysaccharide profiling and genomic fingerprinting by enterobacterial repetitive intragenic consensus-polymerase chain reaction. Our aim was to assess the relative utility of these techniques for identification of bradyrhizobia. A collection of Uruguayan Bradyrhizobium strains isolated from Lotus subbiflorus was selected to test both techniques in terms of their discriminating ability and ease of use. Both techniques were found to be equally discriminating and they classified the samples in the same way, although each method ascribed two strains to different groups. Genomic profiling of some strains required previous DNA purification, whereas this was found to be unnecessary for others. Lipopolysaccharide profiling was found to be easier and cheaper to perform, but was not useful for determination of the genetic relationship among the strains.
1 Introduction
Ecological studies of natural populations of rhizobia require fast and reliable techniques for strain identification. To be useful in field studies, an identification technique for a given population must produce the maximum number of different groups in a reproducible way [1] and must be independent of any previous manipulation of the strains [2].
Serological methods have been used for strain identification, but they are limited since they do not yield information on strains that do not react with a given set of antibodies, and therefore these strains are artificially grouped. The electrophoresis of whole cell proteins avoids such artificial grouping and has been used as a discriminating tool for strain identification [3–6, but the resulting profiles are rather complex and difficult to compare. More clear-cut and easily compared patterns are produced by the electrophoresis of lipopolysaccharides (LPS) and these patterns have been used successfully for the differentiation of rhizobia isolated from diverse sources [1,7,8. A further advantage of LPS typing is that it is a fast and reliable technique that can be also applied to extracts from intact nodules, avoiding the necessity of bacterial isolation and cultivation [9]. A different type of approach, which is increasingly used, is based on DNA fingerprinting. It has been shown that DNA primers corresponding to the enterobacterial repetitive intragenic consensus (ERIC) sequence [10], coupled with the polymerase chain reaction (PCR) DNA amplification method (ERIC-PCR) can be used to fingerprint the genomes of different Rhizobium species [10–15 and Bradyrhizobium japonicum[16]. This technique has also been used successfully with nodule extracts [11,14. The increasing use of these PCR-based techniques is due to their high discriminating power, their ease of standardisation and their suitability for computer-assisted analysis of the resulting patterns, which allows the elucidation of genetic relationships among the strains used [11].
Each strain identification procedure has its own advantages and drawbacks, but there is no published comparison between ERIC-PCR and LPS profiling in terms of discriminating ability or ease of use. Such a comparison was the aim of this work. As a sample for the comparative studies, we used a collection of Bradyrhizobium strains isolated from Lotus subbiflorus that had previously been described and characterised with regard to growth, and by using serology and whole cell protein profiling [4].
2 Materials and methods
2.1 Bacterial strains and culture condition
Bradyrhizobium sp. (Lotus) strain NZP2309 was obtained from the Department of Microbiology, University of New South Wales, Kensington, Australia. Bradyrhizobium sp. (Lotus) strains Ls31, Ls11, Ls22, Ls81, Ls82, Ls42, Ls71, Ls7, Ls4, LsIB3 and LsIB4 were obtained from different areas in Uruguay [4]. Bacteria were maintained on yeast-extract mannitol (YEM) medium [17].
2.2 Electrophoresis of lipopolysaccharides
The samples for electrophoresis were prepared by the Hitchcock and Brown method [18], with the following modifications: the bacteria were grown at 28°C in yeast extract–mannitol medium containing (g l−1 distilled water): mannitol, 1.0; yeast extract, 0.8; K2HPO4, 0.6; MgSO4·7H2O, 0.2; and NaCl, 0.2. After 5 days of incubation, the cultures were centrifuged at 10 000×g for 20 min and the cell pellets were washed with 0.85% NaCl. The bacterial pellets were stored at −80°C until use. Bacteria were suspended in distilled water to an optical density (at 600 nm) of 1.0; 1 ml of the bacterial suspension was centrifuged at 13 000×g for 5 min and the pellet was resuspended in 500 μl of lysis buffer: 2% (w/v) SDS, 5% (w/v) dithiothreitol, 10% (v/v) glycerol, 0.017% (w/v) bromphenol blue in 0.5 M Tris buffer, pH 8.0. The samples were heated at 100°C for 10 min; after which, 20 μl of a solution (2.5 μg μl−1) of proteinase K (Boehringer) in lysis buffer was added and the mixtures were incubated under agitation at 60°C for 1 h. The samples were clarified by centrifugation and the supernatants were stored at −20°C until use.
Electrophoresis was carried out by the discontinuous method of Laemmli [19] in 0.5-mm-thick polyacrylamide slab gels. To study the effect of differing gel pore sizes in the LPS profiles, we used gels from 10% (w/v) to 17.5% polyacrylamide. The gels were stained by the periodic acid-silver method of Tsai and Frasch [20]. The stained gels were scanned using a Pharmacia-LKB Ultroscan XL densitometer and the software used for gel analysis and comparison was Pharmacia-LKB Analysis GelScan XL. The comparison of the profiles involved: (1) profile normalisation to a fixed length; and (2) direct comparison of profiles by superimposing the normalised densitometric tracings. Two lanes were considered as identical when both positions and the relative intensities of all bands were the same. The comparison of profiles by methods based on presence–absence of bands and the subsequent construction of a similarity matrix is unsuitable for LPS, due to the fact that the bands are not mutually independent [9].
2.3 Genomic DNA fingerprinting
DNA isolation from lysed cells was performed using the method described by Tichy and Simon [21]. When direct DNA amplification was not possible, DNA was purified using the Wizard DNA Genomic purification method (Promega, Madison, WI) with the following modifications: 600 μl of TEN8 (100 mM NaCl, 25 mM EDTA, 0.5% (w/v) SDS and 0.1 mg ml−1 proteinase K in 20 mM Tris (pH 8.0)) was added to 1 ml of bacterial culture and incubated at 55°C for 15–30 min. Then 3 μl of RNase solution kit (Promega) was added to the lysed cell suspension and DNA was isolated following the manufacturer's instructions. Repetitive-PCR fingerprinting was performed using the ERIC consensus, ERIC 1R and ERIC 2 primers [10]. The PCR reaction was performed in a 10-μl reaction mixture containing 50 mM KCl, 1.0 mM MgCl2, 10 mM Tris-HCl pH 8.5, 0.5 U Taq (Gibco BRL), 250 μM of each dNTP and 10 pmol of each primer. In all reactions three serial dilutions of DNA from 1 to 10 ng were used. The cycling profile for ERIC-PCR was as follows: one initial denaturation cycle of 5 min at 95°C, 35 cycles of denaturation at 94°C for 1 min, annealing at 52°C for 2 min, extension at 72°C for 1 min and final extension at 72°C for 5 min. All amplifications were carried out using a Thermolyne model Amplitron II thermocycler. Amplified products were separated by electrophoresis on 6% polyacrylamide gels in a Mini-PROTEAN II apparatus with a 1-mm spacer and an 18-tooth comb (Bio-Rad, Hercules, CA, USA) and visualised by silver nitrate staining, as previously described [22].
The densitometry analyses and comparison of the profiles was done in the same way as for LPS, but a similarity matrix was constructed by using the bands from each lane whose area percentage was higher than 5% of the whole lane area. The similarity coefficient used was the Jaccard's coefficient The clustering of the profiles and resulting dendrogram were performed by using an unweighted pair group (UPGMA) algorithm (program MVSP, W.W. Kovach, University College of Wales, Aberystwyth, UK).
3 Results
LPS profiles did not change among different cultures of each strain. The faster migrating (smaller) bands were better resolved in gels of high acrylamide concentration, whereas the slower bands were well resolved in more porous gels. Therefore, the LPS profiles of each strain were dependent on the acrylamide concentration. The best resolving power, in terms of the discernible number of bands in each lane, was obtained with gels of intermediate (12.5 or 15%) acrylamide. However, irrespective of the acrylamide concentration used, the grouping of the strains by their LPS profiles was the same in the range of 10–17.5% acrylamide (data not shown). Fig. 1 shows the electrophoretic LPS profiles obtained using 15% acrylamide gels. The isolates, serologically similar to strain Ls31 (strains Ls11, Ls22, Ls31, Ls81, Ls82, Ls42 and Ls71, [4]), produced similar patterns, characterised by the presence of tightly clustered bands of intermediate mobility. However, it was possible to differentiate profiles of three types: (1) from the strains Ls11, Ls22, Ls31, Ls81 and Ls82; (2) produced by strain Ls42, that was very similar to the former group but with a very prominent band migrating faster than the main cluster; and (3) produced by strain Ls71, whose pattern showed only a faint cluster and a group of intense bands. Strain LsIB3, which does not belong to the same serogroup [4], produced a similar pattern, but different from that produced by strains of serogroup 31. The Uruguayan isolates Ls7, Ls4 and LsIB4 and the New Zealander isolate NZP2309 produced individual patterns.
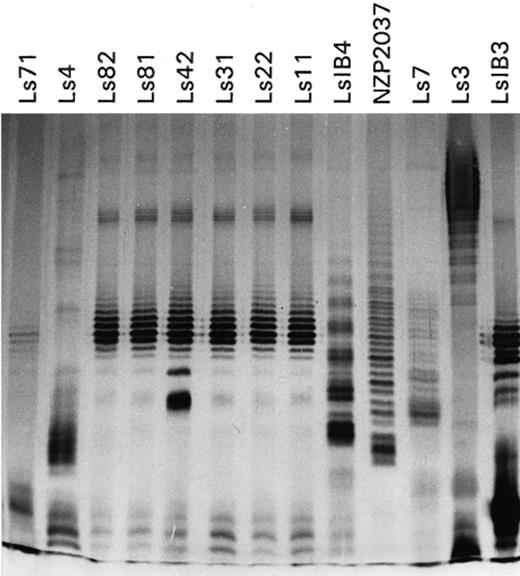
Silver stained lipopolysaccharide electrophoretic profiles from the Bradyrhizobium (Lotus) strains studied on a 15% polyacrylamide gel.
Results shown in Fig. 2 were repeated three times with serial dilutions of DNA and the profile for each strain was identical in the different experiments. DNA amplification directly from the lysates of colonies of the strains serologically related to strain LS31 was successful and we obtained reproducible patterns without previous DNA purification. By contrast, DNA of strains Ls7, Ls4, LsIB3, LsIB4 and NZP2037 could not be amplified from lysed cells, probably due to the presence of PCR-reaction inhibitors in these strains. DNA purification was required for reproducible PCR-fingerprinting of these strains. The resulting dendrogram is shown in Fig. 3. ERIC-PCR separated the strains belonging to serogroup 31 into three groups: Group A (strains Ls31, Ls11 and Ls22), Group B (strains Ls81, Ls82. and Ls42), and Group C (strain Ls71). It is worthwhile noting that strain IB3, which does not belong to serogroup 31, has LPS and ERIC-PCR profiles related to strains of that serogroup.
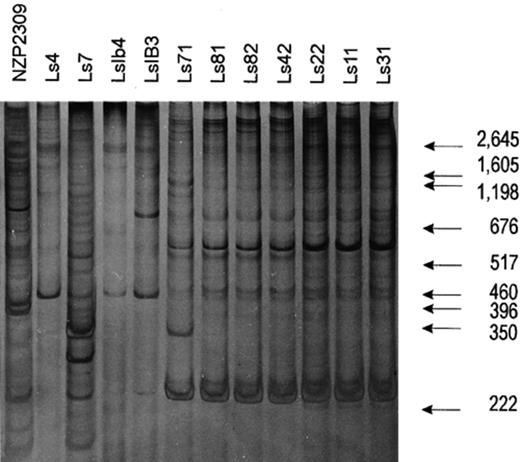
Genomic fingerprints from whole cell lysates of Bradyrhizobium sp. (Lotus) strains. DNA amplification and electrophoresis conditions were as described in Section 2.
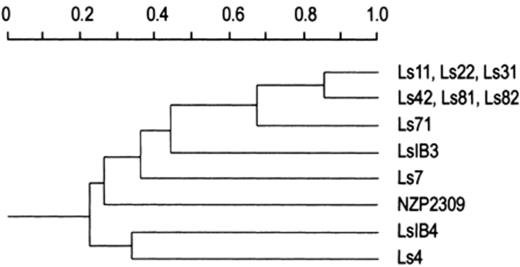
Dendrogram constructed with the data from Fig. 2. The gel was analyzed by densitometry and the bands whose areas were greater than 5% of the whole lane area were used for constructing a presence–absence matrix. The similarities were calculated using the Jaccard's coefficient, and the clustering was done by using the unweighted pair group method. All calculations were done by using the MVSP (Warren W. Kovach, University College of Wales, Aberystwyth, UK) program for multivariate analysis.
4 Discussion
Both LPS profiling and ERIC-PCR fingerprinting were able to resolve more clusters in the samples studied than any other technique previously applied to this group of bradyrhizobia [4]. For instance, both methods were able to clearly differentiate between strains LsIB3 and LsIB4, which appeared to be identical by serology and by whole cell protein profiling [4]. Both techniques were also able to divide serogroup 31 (which was found to be homogeneous by protein profiling) into three subgroups. However, in this case, there was a discrepancy between these two high-resolution techniques. By LPS profiling, strains Ls81 and Ls82 were identical to strains Ls11, Ls22 and Ls31, whereas by ERIC-PCR they belonged to the same group as strain Ls42. By both procedures, strain Ls71 was clearly different from the other components of the serogroup 31. In conclusion, both methods showed a similar discriminating power, and were able to resolve the sample into the same number of groups, although two groups had slightly different compositions.
In terms of ease of use, LPS profiling was faster, cheaper and simpler than ERIC-PCR fingerprinting. LPS profiling was also more reliable, in the sense that all strains could be processed in the same way. It has been proposed that LPS profiles change when bacteria are grown in different media, or in the bacteroids. However, we have shown that the LPS profiles are the same for free cultured bacteria and for bacteroids in a group of Bradyrhizobium isolates [9]. As LPS profiling does not require any amplification step, it has the additional advantage that it is less sensitive than ERIC-PCR to the presence of contaminants in the sample that could produce spurious bands. However, LPS profiling has an important limitation, since the relative similarity between LPS electrophoretic patterns did not allow us to draw conclusions about the genetic relationships between the strains compared. This limitation is due to the fact that the LPS pattern depends on the LPS biosynthetic enzymes of the bacteria, and there is no proof of correlation between the type of enzymes for LPS synthesis and the structure of the bacterial genome. LPS profiling is a good tool for strain identification, but in the absence of other evidence, one should not draw the conclusion that two strains with similar LPS patterns are more closely related to each other than to other strains with different patterns. Therefore, LPS profiling is not useful for population genetics studies, nor for evolutionary and phylogenetic studies. On the other hand, ERIC-PCR was sometimes cumbersome, since it required a further DNA isolation step for some strains. This problem could be specific for Bradyrhizobium strains, because it has not been reported for other rhizobia [13–15.
In conclusion, both techniques are discriminatory, and in some cases complementary. For example, whereas LPS profiling permits good discrimination of Bradyrhizobium strains, it is less useful for Rhizobium species since generally their LPS lack the distinctive ladder-like pattern of the former [1]. ERIC-PCR profiling works very well with isolated cells or extracts from nodules produced by Rhizobium13,14, whereas a universal protocol for Bradyrhizobium seems to require an additional DNA purification step, precluding its application to direct nodule typing. Furthermore, preliminary studies carried out in our laboratory showed that ERIC-PCR from Lotus nodules was unsuccessful, probably due to interference from polyphenols, polysaccharides or tannins of plant origin [23](data not shown). The Bradyrhizobium sample studied here is too small to draw universal conclusions, but we suggest that, taking into account the advantages and limitations of each technique, a reasonable strategy for the study of bradyrhizobial populations involving numerous isolates could be: (1) LPS profiling for fast grouping of the isolates; and (2) genomic fingerprinting of a representative of each LPS group to obtain the desired information about the genetic relationships among them.
Acknowledgements
The work of M.S., A.M.G.N. and J.C. was supported by a grant of the Canary Island Government. The work of F.A. and J.M. was supported by CSIC Project 205 and PEDECIBA. We thank Prof. Meléndez-Hevia for his facilities in the densitometric analysis.
References
