


Abstract
Mirror-image flowers (enantiostyly) involve a form of sexual asymmetry in which a flower’s style is deflected either to the left or right side, with a pollinating anther orientated in the opposite direction. This curious floral polymorphism, which was known but not studied by Charles Darwin, occurs in at least 11 unrelated angiosperm families and represents a striking example of adaptive convergence in form and function associated with cross-pollination by insects. In several lineages, dimorphic enantiostyly (one stylar orientation per plant, both forms occurring within populations) has evolved from monomorphic enantiostyly, in which all plants can produce both style orientations. We use a modelling approach to investigate the emergence of dimorphic enantiostyly from monomorphic enantiostyly under gradual evolution. We show using adaptive dynamics that depending on the balance between inbreeding depression following geitonogamy, pollination efficiency, and plant density, dimorphism can evolve from an ancestral monomorphic population. In general, the newly emergent dimorphic population is stable against invasion of a monomorphic mutant. However, our model predicts that under certain ecological conditions, for example, a decline of pollinators, dimorphic enantiostyly may revert to a monomorphic state. We demonstrate using population genetics simulations that the observed evolutionary transitions are possible, assuming a plausible genetic architecture.
Introduction
Flowering plants possess extraordinary structural variation in floral morphology, particularly in animal-pollinated lineages. Much of this diversity is functionally associated with the pollination biology (Grant & Grant, 1965; Harder & Johnson, 2009; Smith et al., 2009) and mating systems of populations (Barrett & Harder, 2017; Goodwillie et al., 2010; Lloyd & Schoen, 1992). A striking feature of the floral biology of angiosperms is the evolutionary flexibility of reproductive traits, which frequently differ between closely related taxa (Barrett et al., 1996; Stebbins, 1974) and also among populations within species (Herlihy & Eckert, 2007; Yuan et al., 2023). This variation is commonly the signature of both past and contemporary evolutionary transitions in floral strategies and mating patterns in response to changing ecological and demographic conditions (reviewed in Barrett, 2008; Pannell & Jordan, 2022). Although most floral traits associated with pollination and mating exhibit continuous patterns of phenotypic variation, caused by interactions between quantitative inheritance and environmental factors (e.g., Ashman, 1999; Caruso, 2004; Fishman et al., 2002), species in numerous families display sexually polymorphic traits with discrete (discontinuous) variation (reviewed in Barrett, 1992; Geber et al., 1999). Commencing with Darwin’s seminal book “Forms of Flowers” (Darwin, 1877), polymorphic sexual systems have held a special fascination for evolutionary biologists interested in the evolution and functional significance of reproductive adaptations.
Darwin devoted much of “Forms of Flowers” to the floral polymorphism heterostyly in which populations are composed of two or three floral morphs differing reciprocally in stigma and anther height (Darwin, 1877) (see also Table 1 for a glossary of terms). This polymorphism is reported from 28 angiosperm families (Barrett et al., 2000; Lloyd & Webb, 1992a). Darwin interpreted this floral arrangement as a mechanism that functions to promote animal-mediated cross-pollination between floral morphs. Experimental studies on pollen transport and mating in heterostylous populations have largely confirmed Darwin’s cross-promotion hypothesis (Barrett & Shore, 2008; Ganders, 1979; Lloyd & Webb, 1992a). After reading an article in The American Naturalist by Todd (1882) on Solanum rostratum, Darwin became intrigued by another type of animal-pollinated stylar polymorphism—enantiostyly (mirror-image flowers)—which also exhibits reciprocal sex-organ positioning but involves left- and right-deflected styles. Darwin wrote to Todd requesting seeds of S. rostratum so that he could investigate the function of mirror-image flowers but died 9 days after writing theletter to Todd (Darwin, 1882, reprinted in 1945; Jesson & Barrett, 2005). Interest in these curious left–right stylar asymmetries remained largely dormant until relatively recently (reviewed in Barrett & Fairnie, 2024), when workers began to investigate various unrelated enantiostylous taxa (e.g., Bowers, 1975; Dulberger, 1981; Graham & Barrett, 1995; Fenster, 1995; Jesson & Barrett, 2003; Ornduff & Dulberger, 1978; Richman & Venable, 2018; Mora-Carrera et al., 2019; Wang, 1995). However, in contrast to the extensive ecological and genetic research conducted on heterostylous taxa over the past century (reviewed in Barrett, 1992; Ganders, 1979; Lloyd & Webb, 1992a, b), the evolutionary origins and adaptive significance of enantiostyly remain poorly understood.
Glossary of terms related to plant reproduction used in this article.
| Term | Description |
|---|---|
| Dioecy | A sexual system in which populations are composed of female and male plants. |
| Enantiostyly | A floral polymorphism in which styles are deflected either to the left- or right-side of a flower. In monomorphic enantiostyly, both flower types can occur on a plant (“mixed handedness”), whereas in dimorphic enantiostyly plants produce either left- or right-handed flowers (“fixed handedness”). |
| Floral display | The number of flowers open on a plant at one time (e.g., daily display size). |
| Floral longevity | The functioning life span of an individual flower. |
| Geitonogamy | Self-pollination resulting from pollen transfer between flowers on a plant that causes self-fertilization (selfing). |
| Herkogamy | The spatial separation of dehiscing anthers and receptive stigmas within a flower. |
| Heterostyly | A sexual polymorphism in which populations are composed of two (distyly) or three (tristyly) floral morphs differing reciprocally in stigma and anther heights. |
| Inbreeding depression | The reduction in viability and/or fertility of inbred offspring compared to those from mating between unrelated individuals. A common form of inbreeding in plants is self-fertilization (selfing). |
| Mating system | The mode of transmission of genes from one generation to the next through sexual reproduction. |
| Monoecy | A hermaphroditic sexual system in which plants in a population produce separate female and male flowers. |
| Pollen discounting | A loss in outcrossed siring success caused by self-pollination. |
| Pollination | The transfer of pollen between flowers by various agents of pollen dispersal, including animals, wind, and water. |
| Stylar dimorphism | The occurrence of two floral morphs within a population that differ in style orientation (e.g., dimorphic enantiostyly) or length (e.g., distyly). |
Reluctance to tackle the problem of how and why mirror-image flowers evolved may be because of a puzzling feature of the floral polymorphism. In contrast to heterostyly and other stylar polymorphisms (summarized in Barrett, 2010, Table 2), in which all flowers borne by an individual possess the same stylar condition and populations are reproductively subdivided into distinct floral morphs, mirror-image flowers exist in two fundamentally different forms (see Figure 2 in Barrett, 2002). In monomorphic enantiostyly, individual plants produce a mixture of both left- and right-handed flowers (hereafter L- and R-flowers), whereas in species with dimorphic enantiostyly, plants are fixed for stylar orientation (hereafter L- and R-plants). Thus, monomorphic enantiostyly involves somatic floral polymorphism and only dimorphic enantiostyly resembles other stylar polymorphisms in being a true genetic polymorphism. In Heteranthera missouriensis (previously H. multiflora), the only dimorphic enantiostylous species in which the genetic basis of handedness has been investigated, right-handedness is governed by a dominant allele at a single diallelic Mendelian locus with left-handed plants homozygous recessive (Jesson & Barrett, 2002a).
Comparative analysis of several enantiostylous families (e.g., Solanaceae, Gesneriaceae, Haemodoraceae, Pontederiaceae) supports an evolutionary progression from a straight-styled ancestral condition to monomorphic enantiostyly, with the evolution of left–right stylar asymmetry within plants followed by rare transitions to dimorphic enantiostyly (reviewed in Jesson & Barrett, 2003) restricted to a few monocotyledonous lineages (Graham & Barrett, 1995). Thus, the vast majority of enantiostylous species distributed across at least 11 families possess monomorphic enantiostyly. This uneven distribution of the two enantiostylous conditions is puzzling for two reasons. First, no new developmental machinery appears to be required to produce stylar dimorphism as this already exists in the monomorphic ancestral state. Second, experimental studies on the function of the two forms of enantiostyly demonstrate clear mating benefits to stylar dimorphism because it limits selfing by geitonogamous pollen transfer (Barrett et al., 2000; Jesson & Barrett, 2002b, 2005). Because pollen deposition on the right- or left-side of the bodies of foraging bees by pollinating anthers favors cross-pollination between flowers of different stylar orientation rather than between flowers of the same stylar deflection, rates of geitonogamy are significantly higher for monomorphic than dimorphic enantiostyly, although the former condition does reduce geitonogamy in comparison with the straight-styled ancestral condition (Jesson & Barrett, 2002b, 2005). Geitonogamy is generally recognized as a nonadaptive cost of floral display size as it can result in inbreeding depression and pollen discounting (Harder & Barrett, 1995; Lloyd, 1992), although see Mora-Carrera et al. (2019) for an adaptive explanation for geitonogamy in a monomorphically enantiostylous species).
A variety of hypotheses has been proposed to explain the overall rarity of dimorphic enantiostyly involving potential evolutionary constraints on transitions from monomorphism to dimorphism (Jesson et al., 2003a, b). These include weak selection for fixed handedness in populations less susceptible to geitonogamy owing to their small daily floral display sizes; for example, in monomorphic species in which only a single flower is displayed each day (Barrett et al., 2000). A lack of heritable genetic variation for the direction of asymmetry in monomorphic populations and developmental-genetic constraints because of the absence of genes with appropriate positional information to distinguish left from right (Jesson et al., 2003b; Jesson & Barrett, 2002a), especially in species with otherwise radially symmetric flowers (see Coen & Meyerowitz, 1991; Luo et al., 1996).
Insights into the possible conditions required for evolutionary transitions between monomorphic and dimorphic enantiostyly can be obtained by theoretical approaches. Jesson et al. (2003a) examined this problem using phenotypic selection models. They did so in two steps: first, by investigating how monomorphic enantiostyly may have evolved from a straight-styled ancestor through gradual selection of increased stigma-anther separation (herkogamy). Then, how dimorphic enantiostyly could evolve from monomorphic enantiostyly through the successive invasion of two variants with fixed handedness (either L- or R-plants). Although Jesson et al. (2003a) also hypothesized that dimorphic enantiostyly could have evolved from monomorphic enantiostyly through disruptive selection on the proportion of L- and R-flowers within a plant, they did not explore this hypothesistheoretically.
Here, we investigate the gradual adaptive evolution of the proportion of L- and R-flowers within individuals of a monomorphic enantiostylous population using the adaptive dynamics framework (Dieckmann & Law, 1996; Geritz et al., 1998; Metz et al., 1996; van Cleve, 2023) to derive the fitness of invading variants directly from population dynamic considerations, complemented with population genetic simulations. We focus primarily on the evolution of dimorphic enantiostyly from monomorphic enantiostyly as, to our knowledge, there is no comparative evidence of the reverse transition in angiosperms, although we do consider when this might occur in our models. Our analyses address the following specific questions: (a) what ecological factors influencing population dynamics lead to the emergence of dimorphic enantiostyly from monomorphic enantiostyly via evolutionary branching and gradual adaptive evolution? (b) Once established, what ecological and demographic conditions maintain the newly arisen stylar dimorphism resulting in evolutionary stability?
Compared to the models of Jesson et al. (2003a), in our analyses we link ecological factors to the evolution of the ratios of L- and R-flowers within individuals. These ecological factors influence the density of individuals in a monomorphic population of enantiostyly, in contrast to Jesson et al. (2003a), where density was treated as an independent parameter. In our models, the density of individuals drives the evolutionary dynamics of an initially monomorphic population. By linking ecological driving forces to the evolution of L:R-flower ratios within individuals, we can study what environmental conditions promote the occurrence of evolutionary branching and the emergence of stylar dimorphism from monomorphism. With this approach, we explicitly derive the invasion fitness of a variant carrying a mutation that influences the ratio of L- and R-flowers from the ecological interactions of such a variant with individuals with the resident phenotypic trait. This readily reveals that such interactions are a source of negative frequency-dependent selection, the principal selective mechanism that maintains sexual polymorphisms. In line with similar models of the evolution of traits influencing plant reproduction (Cheptou & Mathias, 2001; de Jong et al., 1999; de Jong & Geritz, 2001), we assume that evolution proceeds by rare mutations of small phenotypic effects governing the proportion of L- and R-flowers within individuals. We show that under particular environmental conditions, geitonogamous selfing resulting from pollen transfer between flowers on the same plant drives the evolution of dimorphic enantiostyly from monomorphic enantiostyly. Furthermore, we also examine how changes in the environment might under certain conditions cause the breakdown of dimorphic enantiostyly and restoration of a monomorphic state. Finally, we provide proof-of-principle that the transition from monomorphic to dimorphic is possible with a pattern of inheritance similar to that of H. missouriensis (Jesson & Barrett, 2002a).
The model
We study the adaptive evolution of a population of enantiostylous plants, where the evolving phenotypic trait is the average fraction of R-flowers compared to the total average number of flowers displayed daily on a plant, and is the fraction of L-flowers. In the following sections, we introduce an ecological model that describes the dynamics of a monomorphic enantiostylous population and derive an explicit analytical expression for the interaction between plants with different phenotypic traits. This interaction, mediated by the movement of pollen by pollinators, controls the adaptive evolution of the phenotypic trait . In this way, we create a link between the dynamics of the population and the evolutionary dynamics of the trait . Following this, we extend the ecological model describing the dynamics of a monomorphic population to include scenarios involving multiple interacting phenotypes. With this extension, we investigate co-evolutionary dynamics of multiple phenotypes emerging from phenotypic diversification. The relevant model parameters are listed in Table 2A.
Model parameters (A) before and (B) after nondimensionalization.
| A | ||
|---|---|---|
| Parameter | Description | Unit |
| Pollen-to-seed conversion coefficient | ||
| Number of flowers in daily display | ||
| Fitness cost of inbreeding depression following geitonogamy | ||
| Efficiency reduction for pollen transfer between flowers of the same stylar orientation | ||
| Handling time | day | |
| Pollination rate | day1 | |
| Plant base mortality rate | day1 | |
| Foraging area of pollinators | m2 | |
| Plant competition area | m2 | |
| Fraction of right-handed flowers on an individual | ||
| Density of plants with phenotypic trait | m2 | |
| B | ||
| Parameter | Description | Expression |
| Reproductive rate | ||
| Handling time | ||
| Competition coefficient | ||
| Density of plants with phenotypic trait |
Ecological dynamics
Pollen transfer between plants
We introduce the pollination rate as the rate at which pollen is transferred between flowers. The efficiency of pollen transfer between flowers with the same or the opposite stylar orientation depends on morphological and behavioral traits of the pollinators. For example, it has been demonstrated that in Wachendorfia paniculata, sufficiently large pollinators promote pollination between flowers of opposite stylar orientations, whereas smaller pollinators transfer pollen between flowers of the same or different stylar orientation with more comparable efficiency (Minnaar & Anderson, 2021). Therefore, we assume that the pollination rate is maximum when pollen is transferred between flowers of the opposite stylar orientation, whereas is multiplied by a factor , with ranging from to , when pollen is transferred between flowers of the same stylar deflection (see Figure 1A). By doing so, we account for the potentially lower efficiency of large pollinators to move pollen between flowers of the same stylar orientation. The total amount of pollen dispersed from one plant to another is, therefore, dependent on the number of L- and R-flowers on each plant. Let and be the fraction of R-flowers of two plants with flowers each displayed daily. Therefore, the two plants show, respectively, and R-flowers in the daily display. The rate at which pollen is received by R-flowers of the first plant from L-flowers of the second plant is . Similarly, is the rate at which pollen from R-flowers of the second plant is received by L-flowers of the first. Then, the rate at which pollen is transported by pollinators between flowers of the same stylar orientation is: and .
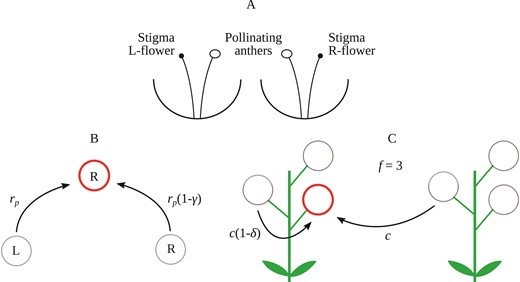
Schematic of the model. (A) Stylized representation of an L -flower and an R-flower in reciprocal enantiostyly. (B) Schematics of hypothetical pollen dispersal among flowers of the same and different stylar orientations of an enantiostylous species. The flower with opposite handedness transfers pollen at the full rate , whereas the flower with the same handedness suffers a penalty of , compared to pollen movement between flowers of opposite stylar orientation. (C) Schematics of pollen grain-to-seed conversion resulting from fertilization by outcrossing or geitonogamy. In the latter case, the conversion coefficient is reduced by compared to outcrossing due to inbreeding depression.
We combine these contributions to give an overall rate of pollen transport: , which we hereafter refer to as the “pollination efficiency” and define the “pollination function” as:
This function is the fraction of pollen deposited on stigmas of any flower of the first plant with respect to the amount of pollen on a pollinator’s body originating from any flower of the second plant. Note that the pollination function is symmetric under interchange of variables, that is, . Pollinators that are highly specialized for pollen movement between flowers with the opposite stylar orientation have ; and, therefore, a pollination efficiency , with which is maximum for and (or vice versa). Conversely, if the number of pollen grains dispersed from a flower to another plant of the same or the opposite stylar orientations is roughly equal (), then the pollination efficiency is , with .
Dynamics of a monomorphic population
The population model is based on per-capita reproduction and mortality. Let the trait characterize a plant population with density , per-capita reproductive rate , per-capita mortality rate . Then the equation describing the population dynamics of is
The reproductive rate is split into two terms: seed production following geitonogamous pollen transfer and following outcrossing. In the case of outcrossing, we first define as the foraging area of pollinators. This quantity defines the surface area for plants to exchange pollen with each other. Then, we introduce the conversion coefficient of pollen grains into seeds c as the average fraction of one seed produced by a single pollen grain. Thus, the reproductive rate due to outcrossing is proportional to
Note that from Equation (3), it follows that a higher density of individuals in an area has the effect of increasing the per-capita reproductive rate by producing more pollen for outcrossing. We hereafter refer to this interaction, which is mediated by pollinators and the intensity of which is controlled by the pollination function, as “facilitation”. In Equation (3), we assume the density of individuals to be high enough to preclude a population from going extinct due to demographic stochasticity.
Similarly, we assume the contribution to the reproductive rate due to geitonogamous pollen transfer to be reduced by a factor , which describes the fitness cost of self-fertilization due to inbreeding depression, see Figure 1B. Here, ranges between (no fitness cost due to geitonogamy) and (complete inbreeding depression). Thus, the reproductive rate following geitonogamy is proportional to
Finally, we include a saturation effect for the overall reproductive rate by assuming a Holling’s type-II functional response to pollen availability. To do so, we introduce a parameter which in the animal literature is typically referred to as handling time (Holling, 1959). In our context, describes the time required for replacing flowers that, after fertilization, lack receptive ovules. Then, the overall reproductive rate is
Note that this functional form for the reproductive rate implies that geitonogamous selfing and outcrossing rates are density-dependent: if , plants will always self-fertilize, if , plants will only outcross. For any realistic density, self-fertilization and outcrossing will both occur. This is in line with previous results showing that low density of plants can increase self-fertilization (Barrett & Eckert, 1990; Karron et al., 1995; Treuren et al., 1993). Indeed, in a monomorphically enantiostylous species, outcrossing and selfing rates have been shown to be density-dependent, with higher outcrossing at high densities and more selfing at low densities (Mora-Carrera et al., 2019).
We assume that the per-capita mortality rate of plants is density dependent following
where is the base mortality rate and is the competition area that represents the range within which different individuals compete with each other for shared abiotic resources (e.g., water, soil nutrients). For mathematical simplicity, we excluded density-independent mortality from our model. Note that this decision may prevent the occurrence of an Allee effect.
Nondimensionalization
Equation (2) depends on nine distinct parameters (Table 1). To ease the exploration of the parameter space, we reduced the number of parameters through nondimensionalization. We use the plant base mortality rate as the unit of time to re-scale the time-dependent quantities by defining the nondimensional time as . We use the foraging area of pollinators to re-scale the length-dependent quantities by defining the nondimensional density of plants as. We define the nondimensional reproductive rate , the nondimensional handling time , and the nondimensional competition coefficient , see Table 2B.
With these, Equation (2) becomes
The number of free parameters is now reduced from nine to five.
Equation (7) has two stationary solutions that depend parametrically on the trait value : the trivial , and (Supplementary Equation (S1)). Because of our assumption of excluding density-independent mortality, is a repeller of the population dynamics, while is an attractor, and will be hereafter used as the equilibrium density for a resident population with trait , see Supplementary Information S1 for detail.
Interaction coefficients
To study the evolution of the trait , it is necessary to understand how different phenotypes interact with each other. In our model, pollen production by individuals facilitates reproduction, which we model by considering the exchange of pollen between all possible pairs of flowers, whereas competitive interactions for shared abiotic resources influence mortality and are thus modelled at the population level.
The facilitative interaction is mediated by the pollinating function defined in Equation (1). Here, unlike the monomorphic case where offspring have the phenotype of parent plants, we assumed that the phenotype of offspring was inherited via ovules through , meaning that offspring have the same phenotype as the maternal parent, or via pollen through , that is, its phenotype is passed on via the paternal parent. Given that , therefore, in a population with phenotypic traits , the reproductive rate of the phenotype due to outcrossing is proportional to:
where the summation runs over all possible phenotypes in the population, including both non-geitonogamous pollen transfer between plants of the same phenotypes (when ) and pollen transfer between plants of different phenotypes. The overall reproductive rate of the phenotype is:
In this equation, the two terms outside of the summations represent geitonogamous pollen transfer. Similar to the reproductive rate, the per-capita mortality rate when phenotypes coexist is:
where mortality depends on the competition between plants of both the same () and different phenotypes. In Equations (8), (9), and (10), the term represents the density of plants with phenotype .
Evolutionary dynamics
Based on the ecological scenario presented in the previous section, we use invasion analysis (sensuOtto & Day, 2007) to study the gradual evolution of the phenotypic trait that characterizes the stylar condition of an initially monomorphic plant population. Specifically, we investigate the conditions allowing an emerging mutant to establish in a population and replace the resident from which it originated. This process, known as the trait substitution sequence (see Champagnat et al., 2006; Dieckmann & Law, 1996) is depicted in Figure 2A and C (black arrows), and produces evolutionary trees as in Figure 2G–I. Whether a mutant can invade a resident population depends on its invasion fitness, defined in the next section.
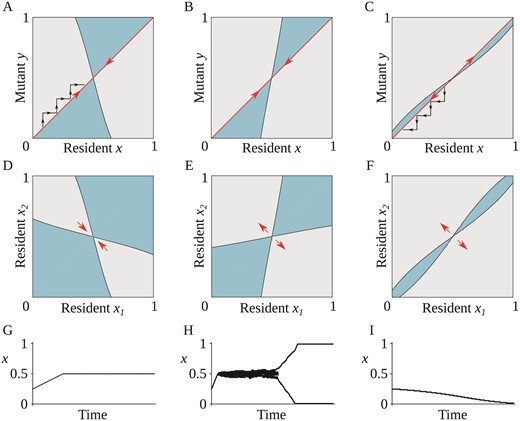
The three possible types of evolutionary behavior: gradual evolution can result in a population of monomorphic enantiostyly (A, D, and G), dimorphic enantiostyly (B, E, and H), or a population with uniform direction for stylar orientation (C, F, and I). (A–C) Pairwise invasability plots. Mutants can invade a resident with trait value x if their trait value y is in a grey (light) area that occurs when y has positive invasion fitness. Blue (darker) regions in the plots correspond to negative invasion fitness and, in those regions, the mutant cannot invade the resident x. The red (big) arrows indicate directional evolution (A and B) toward the singular point x (evolutionary attractor, convergent stable) or (C) away from the singular point (evolutionary repeller, not convergent stable), under the assumption of mutations of small phenotypic effect. Evolution proceeds as a trait substitution sequence illustrated by the black (small) arrows in (A) and (C). (D–F) Area of coexistence of a hypothetical dimorphic population, with phenotypic traits and . Grey (light) areas correspond to regions where and can coexist on an ecological time scale. Red (big) arrows represent the direction of (D) convergent and (E and F) disruptive selection in a coevolutionary process involving and . (G–I) Example of simulated evolutionary trees. (G) After an initial period of directional selection, evolution reaches an end point with a monomorphic population at x. (H) Following directional evolution, the monomorphic population splits into two subpopulations with phenotypic traits x = 0 and x = 1. (I) Directional selection drives the monomorphic population away from the singular point and toward x. Note that with a different starting point (x), the evolutionary process would go toward x. Parameter values: (A, D, and G) , , , , . (B, E, and H) , , , , . (C,F,I) , , , , .
The invasion fitness and the trait substitution sequence
A single step of the adaptive dynamic process consists of the introduction of an initially rare mutant with phenotypic trait in a population of residents with trait at its population dynamic equilibrium (Supplementary Equation (S1)). We focus on gradual adaptive evolution, and, therefore, we assume mutations of small phenotypic effects, that is, , with .
The mutation is initially carried by few individuals and, together with the assumption of high density for the resident population, the probability of pollen transfer among different mutants is negligible. Nor does the mutation cause density dependent effects on the mortality rate of the resident population. Then, the invasion fitness of the rare mutant in a resident population that consists of a single trait value is the initial per-capita growth rate of the mutant population (Geritz et al., 1998). In our case, we have:
Mutants with positive invasion fitness can invade the resident population, whereas those with negative invasion fitness are unable to do so. Under the adaptive dynamics assumptions, a mutant that can invade will typically replace the resident population and become the new resident, resulting in a trait substitution sequence (Dieckmann & Law, 1996). This occurs when and . Through this, the evolving trait climbs the dynamic fitness landscape and evolves to locally maximize its fitness. Instead, if both conditions and hold, the mutant and resident can coexist and evolution results in so-called evolutionary branching and the creation of dimorphism. The latter condition occurs when the resident trait is at a minimum of the invasion fitness function.
Under the adaptive dynamics assumption, the speed of evolution and direction of the trait substitution sequence follows from the selection gradient , defined in Supplementary Equation S8. The trait substitution process continues until a singular point of the evolutionary dynamics is reached. In a singular point, the selection gradient vanishes, that is, . It can easily be verified that is a singular point. Note that corresponds to a 1:1 ratio of L- and R-flowers on individual plants, as often observed innatural populations with monomorphic enantiostyly (Jesson & Barrett, 2003). It may be that under specific conditions, the equation can also be satisfied for a values of other than , see Supplementary Information S4. However, with our exploration of the parameters space we could not find parameters combinations such that solutions other than exist. Therefore, if they exist, they would likely be idiosyncratic and, as such, largely irrelevant for the question of how dimorphic enantiostyly could gradually evolve from monomorphic enantiostyly.
How evolution proceeds at a singular point is determined by the signs of the functions and defined, respectively, as
and
Specifically, corresponds to a singular point being convergent stable, and corresponds to a singular point being evolutionary stable, see also Supplementary Information S4.
Computer simulations
Stochasticity in adaptive dynamics To assess the robustness of our analytical results to violation of some of the adaptive dynamics assumptions, we set up stochastic computer simulations to study the evolutionary dynamics of a population of initially monomorphic enantiostyly with phenotypic trait . More specifically, in our simulations, we included demographic stochasticity of emerging mutants, stochasticity in the selection and mutation process, and we relaxed the assumption of clear separation between population dynamic and evolutionary time scales. In order to do so, we used a computational algorithm developed by Saltini et al. (2023) and an adapted version of the code, see Supplementary Information S2 for details.
Population genetics In our model, we did not consider any explicit genetics nor did we allow for intermediate phenotypes resulting from cross-breeding. Therefore, we used population genetics simulations to assess whether evolutionary branching could occur in the case in which intermediate phenotypes can be generated by cross-breeding between plants with different phenotypic traits, when trait inheritance occurs through both male and female function. In these, plants have a Mendelian E/e locus that determines which of two sets of small effects loci ( or ) is expressed. Each set itself is modelled as a single number here called “meta-allele”. See Supplementary Information S3 for details.
Results
Evolutionary dynamics
Available evolutionary scenarios around x*=1/2
Based on the signs of and , we study the possible fates of a monomorphic population by investigating . If we combine Equations (12) for and (13) for , we obtain
This implies that, if , necessarily and, since , from Equation (12) it follows . This means that in our model, evolutionary stability also implies convergence stability (Figure 2A). Consequently, out of the four possible characterizations of the singular point (Geritz et al., 1998), only three are available in our case (Figure 2A–C). If and , is at a maximum of the invasion fitness and, therefore, uninvadable by any local mutant. This is an end-point of the evolutionary dynamics and evolution results with a monomorphic population with 1:1 ratio of L- and R-flowers within individuals as the evolutionary stable strategy (ESS), see Figure 2A. From Equation (13), we note that such a condition is more easily met for low values of , that is, for low fitness cost due to geitonogamy. The light grey area in Figure 2D is the area of coexistence and every pair in the area of coexistence is a protected dimorphism. If a protected stylar dimorphism with two phenotypes in the area of coexistence occurs due to, for example, mutations of large phenotypic effect or immigration, such a dimorphism would be transient, as the coevolutionary dynamics would make the two resident trait values converge to , that is, the monomorphic state (see Supplementary Figure S3B).
If and , then is convergently stable but not evolutionarily stable (Figure 2B). This means that first directional selection drives the evolving trait toward . Then, a monomorphic population splits, resulting in the emergence of a protected dimorphism, with the two resulting phenotypic traits undergoing disruptive selection and subsequent evolution leading to a dimorphic population toward and (Figure 2E). In this case, is an evolutionary branching point (see Supplementary Information S5 and Figure S5 for a discussion of the evolutionary trajectories after branching). Note that, in our model, the invasion of a mutant with uniform handedness (either or , corresponding to a large mutation step ) into a population at the branching point also leads to dimorphism (see Figure 2B and C and Supplementary Figure S3A). This demonstrates that our findings are robust under the relaxation of the assumption that mutations have small phenotypic effects.
Finally, if both and , the strategy is both convergent and evolutionary unstable (Figure 2C). In this case, is a repeller of the evolutionary dynamics. With mutations of small phenotypic effect, the resident phenotype evolves away from the singular point, resulting in a monomorphic population with trait either or (depending on the initial trait value), see Figure 2C. However, such a population is invadable from another part of the range, where the alternative strategy ( or , respectively) was present (Supplementary Figure S4A). Furthermore, in the repeller regime, mutations of large phenotypic effect can result in the creation of stylar dimorphism, see Figure 2F and Supplementary Figure S4B.
Note that complete inbreeding depression () implies evolutionary instability (), suggesting that high levels of inbreeding depression resulting from geitonogamous selfing is a key factor in driving the evolution of dimorphic enantiostyly.
Stochasticity in the demography and mutation-selection process
Figure 2G–I illustrates evolutionary outcomes for the simulated evolution of an initially monomorphic population for three different sets of model parameters. In Figure 2G, the monomorphic population evolves toward , where it then remains at a fitness peak. There, nearby mutants have a negative invasion fitness and, therefore, trait value is an ESS.
In Figure 2H, after a short period of directional selection until , the monomorphic population undergoes evolutionary branching, resulting in the emergence of stylar dimorphism. Given the proximity of the two phenotypic traits emerging from evolutionary branching to the branching point , the lack of separation of time scales, and stochasticity in the mutation and selection process, subsequent evolutionary branching events occur resulting in a transient polymorphism with several coexisting phenotypic trait values. This diversity disappears when two branches evolve sufficiently far away from the branching point . Then, through negative frequency-dependent selection, evolution results in character displacement and eventually an evolutionary stable coalition, with the population exhibiting the two traits and . However, if environmental changes occur such that the geometrical shape of the area of coexistence plot changes to something similar to Figure 2E, the evolution of the traits and resume. In such a case, the evolutionary trajectories of the two traits will converge to and monomorphism is restored(Supplementary Figure S3B).
In Figure 2I an initially monomorphic enantiostylous population evolves away from the singular point, resulting in a monomorphic population with fixed and uniform stylar orientation among all individuals ( or ). This occurs because is not convergent stable () and, in such a case, a monomorphic population evolves away from the singular point.
Individual-based simulations including genetic system
To provide proof-of-principle that evolutionary branching through gradual evolution could originate in a population of sexually reproducing individuals, we performed population genetics simulations with the following genetic architecture: (1) individuals contain two meta-alleles, dubbed and , corresponding to two sets of small effect loci, and a single diploid E/e locus, the latter similar to Heteranthera missouriensis (Jesson & Barrett, 2002a). EE and Ee individuals produce flowers according to their meta-allele, ee individuals express . Figure 3 shows the outcome of a population genetic simulation with flowers per plant in which an initially monomorphic population undergoes evolutionary branching resulting in the emergence of stylar dimorphism. Average values of and do not converge exactly to 0 and 1, respectively, because of a balance between mutational drift and selection. In the first stage, where and were still similar, —the allele frequency of E, fluctuated considerably. Later, when and had evolved sufficiently far away from one another, stabilized around 0.3, that is, corresponding to similar fractions of low- and high- individuals in the population. The great reduction in the fluctuation in suggests that the E/e system is maintained by negative frequency-dependent selection when the two meta-alleles are sufficiently different. Genetic models considering many tightly linked loci (e.g., Bolnick & Doebeli, 2003) would likely yield very similar results (de Jong & Geritz, 2001).
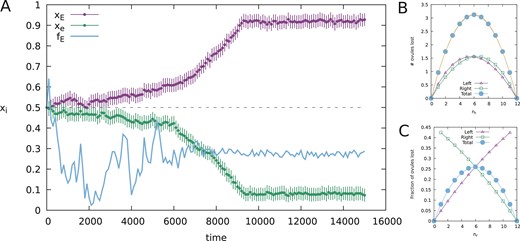
Evolutionary branching of an initially monomorphic population. (A) Outcome of a population genetics simulation where an initially monomorphic heterozygous population splits into a dimorphic population. Green (lighter) dots: average x-value of the -metagene standard deviation, purple (dark) dots: average similar for -metagene. Solid blue line: population allele frequency of the E-allele. Note that the fluctuations in decrease after and are sufficiently diverged, indicating that from then on, the E/e-system is maintained by negative frequency-dependent selection, resulting in roughly equal fractions of and expressing individuals. (B) Expected number of ovules lost due to geitonogamy with the parameters used in the simulations, split for L - and R- flowers and summed. A parabola (yellow curve) goes through all points of the summed losses. (C) Relative ovule loss corresponding to B. Parameters: .
Our simulations show that branching is possible by gradual evolution but, due to stochasticity, in a fraction of simulations in the branching regime, either the E or e allele was lost during the initial stage of a simulation, after which selection drove of the remaining allele to around 0.5.
Bifurcation analysis
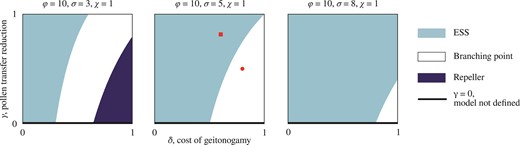
To assess how characterization of the singular point (and, therefore, the evolutionary outcome) depends on numerical values of the model parameters, we performed bifurcation analyses at . This was conducted by changing, independently of each other, the cost of geitonogamy , and the reduction in pollination efficiency for pollen transferred between flowers of the same stylar orientation for multiple values of the reproductive rate (Figure 4), the competition coefficient (Figure 5), and the handling time (Supplementary Figure S1).
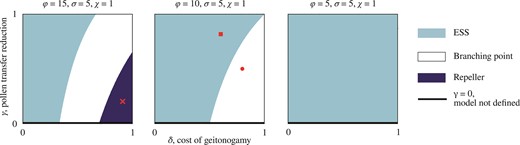
High reproductive rate favors the evolution of dimorphic enantiostyly. Characterization of the singular point with three bifurcation diagrams in the and parameters for decreasing (left to right) values of the reproductive rate . (A) Depending on the combination of values of and , for high reproductive rate the evolutionary outcome of the model can be an evolutionary stable strategy (ESS) for the monomorphic population (light blue), a branching point with consequent emergence of dimorphism (white), and a repeller of the evolutionary dynamics (dark blue) in which, for most initial conditions, mutations of small effect result in a monomorphic population with uniform direction for the stylar deflection among individuals, that is, with trait value either x = 0 or x = 1. (Red) Cross corresponds to parameter values as in Figure 2C, F, and I. (B) By decreasing the reproductive rate, the parameter regime that leads to an evolutionary repeller shifts beyond , leaving only an ESS or branching point as possible characterizations of . (Red) Circle corresponds to parameter values as in Figure 2B, E, and H, (red) square to parameter values as in Figure 2A, D, and G. (C) For lower value of the reproductive rate , the singular point is an ESS for any biologically relevant combination of and .
Figure 4 illustrates three bifurcation diagrams for the parameters and for decreasing values of the reproductive rate , calculated at the singular point . In particular, Figure 4A shows that a gradual increase of with a fixed, low value of changes from an ESS to a branching point and, for a very high geitonogamy cost, to a repeller of the evolutionary dynamics. Note that the region in Figure 4A where is not evolutionary stable (branching point and repeller) is broader than the same region both in Figure 4B, where the singular point cannot be a repeller, as the repeller regime has shifted beyond , and in Figure 4C, where any combination of and corresponds to an ESS for the singular point. Therefore, the broader scope for evolutionary instability and a branching point is associated with higher values of the reproductive rate . Note that increases with increasing daily display size , more efficient pollen-to-seed conversion , and/or increasing pollinator activity . In this case, a monomorphic population can undergo evolutionary branching into two phenotypes with fixed, reciprocal handedness, or evolve toward a uniform direction for stylar deflection among individuals (bottom right corner of Figure 4A). In Figure 4A, whereas lower values of are linked to a broader range of values for such that is evolutionary unstable, the scope for evolutionary branching becomes slightly narrower compared to higher values of because of the appearance of the repeller regime. In contrast, a low value is associated with an increased area in the plane where the strategy is evolutionary stable. In this case, a monomorphic population with a 1:1 proportion of L- and R-flowers within individuals is the ESS.
Similarly, strong competition for shared abiotic resources leads to a widening of the region of the space where the singular point is evolutionary stable, whereas weak competition results in conditions in which evolutionary branching and an evolutionary repeller state are more likely to occur (Figure 5).
Increased competition reduces the scope for evolving dimorphic enantiostyly. Characterization of the singular point with three bifurcation diagrams in the and parameters for increasing (left to right) values of the competition coefficient for shared abiotic resources. (A) Depending on the combination of values of and , for weak competition three evolutionary outcomes are possible: an evolutionary stable strategy (ESS) for the monomorphic population (light blue), a branching point with consequent emergence of dimorphism (white), and a repeller of the evolutionary dynamics (dark blue) in which, for most initial conditions, mutations of small effect result in a monomorphic population with uniform direction for stylar deflection among individuals, that is, with trait value either x = 0 or x = 1. (B) By increasing the competition coefficient, the parameter regime that leads to an evolutionary repeller shifts beyond , leaving only ESS or branching point as possible characterization of . (Red) Circle corresponds to parameter values as in Figure 2B, E, and H, (red) square to parameter values as in Figure 2A, D, and G. (C) For higher value of the competition coefficient , the range of values for and such that is a branching point shrinks, and evolutionary branching can only occur for very high and very low , whereas for other combination of and , the singular point is an ESS.
Finally, Supplementary Figure S1 illustrates that changing the numerical value of the handling time does not change the characterization of the singular point. Thus, while the numerical value of both and changes significantly in response to changes of and, consequently, so does the speed of gradual evolution, the sign of the two functions is fully independent of the changes in handling time.
Discussion
The primary goal of our study was to investigate phenotypic diversification of a plant population with monomorphic enantiostyly, in which all individuals have similar mixed stylar conditions of L- and R-flowers, into a dimorphic population in which individual plants are fixed for either L- or R-flowers. This evolutionary transition in sexual system involves the origin of a true genetic polymorphism in which individuals represent phenotypically distinct floral morphs maintained in populations by negative frequency-dependent selection between L- and R-plants. We approached this problem by employing the modelling framework of adaptive dynamics to study how the ecological conditions influencing the dynamics of a monomorphic population could cause the emergence of stylar dimorphism under the assumption of gradual adaptive evolution. Nevertheless, our results remain robust even when allowing for abrupt evolutionary changes, that is, they hold if we assume mutations with large phenotypic effects. We showed, using population genetic simulations of a similar model, that this transition is possible assuming a plausible genetic system underlying the relevant trait. Such simulations also revealed that stochasticity often led to the loss of either the E or e allele, impeding the shift from monomorphism to dimorphism despite otherwise favorable conditions. This may be one of the explanations why dimorphic enantiostyly is rare.
Our investigation of the evolution of dimorphic enantiostyly differs from most earlier theoretical models of the evolution of plant sexual polymorphisms, including dioecy and heterostyly. Theory on this topic has most often employed an explicit population genetic framework (Charlesworth & Charlesworth, 1979a; Lewis, 1941) and/or has used phenotypic selection models based on sex allocation theory and fitness gain curves (Charnov, 1982; Lloyd, 1982). In common with our study, these models have generally concerned transitions from monomorphic to dimorphic conditions; but because of intrinsic differences in the floral biology of these contrasting sexual systems, the models vary in the specific parameters investigated. Dioecy commonly evolves from monoecy (Pannell & Jordan, 2022; Renner & Ricklefs, 1995) and some models of this transition have been based on quantitative changes in male or female fertility through gradual alteration in the relative proportions of female and male flowers in ancestral monoecious populations (Charlesworth & Charlesworth, 1978). Key parameters driving selection of unisexual individuals usually involve the selfing rate and inbreeding depression of hermaphrodite offspring (Charlesworth, 1999). To our knowledge, the only theory that has explicitly used the adaptive dynamics approach for sexual systems transitions investigated the role of geitonogamy in the gradual evolution of dioecy (de Jong & Geritz, 2001). Significantly, these authors demonstrated that the intensity of inbreeding depression required for the evolution of dioecy differed depending on whether the plants considered were animal versus wind-pollinated. Because all flowers in monoecious and dioecious sexual systems are unisexual rather than hermaphroditic, geitonogamous pollen transfer is much simplified compared to our case where we investigated the consequences of pollen transfer both between and within L- and R-handed flowers.
The evolution of the stylar polymorphism distyly also involves ancestral monomorphic populations initially fixed for a single stylar condition. In this case, the establishment of stylar dimorphism results from the spread of variants with modified sex-organ arrangement within flowers. The two most widely accepted models for the evolution of distyly differ in the relative emphasis that they place on inbreeding depression (Charlesworth & Charlesworth, 1979b) versus the advantages of disassortative pollen transfer (Lloyd & Webb, 1992b). However, both models differ fundamentally from our approach because in heterostylous species, and all other stylar polymorphisms with the exception of enantiostyly, individuals in ancestral monomorphic populations do not produce the alternate stylar conditions. In this respect the transition we have investigated shares more similarities with the monoecy—dioecy transition since in both cases the developmental machinery required to produce the two flower types (e.g., female and male or L- and R- styled) already occurs in ancestral populations. In principle, our model could be adapted to study the gradual evolution of dioecy from monoecy, with the evolving trait representing the fraction of male or female flowers rather than L-flowers. However, since in monoecious species pollen is only transferred from male to female flowers, the pollination function used in our model would need to be adjusted accordingly, by assuming that . This would allow some of our results to be generalized to the study of transitions from monoecy to dioecy.
Note that our study specifically focused on the evolution of dimorphic enantiostyly in relation to the L:R ratio of flower handedness, assuming an already fixed and evolutionary stable degree of stigma-anther separation (herkogamy). It is possible that a transition to dimorphism could influence the degree of herkogamy. Similarly, for certain parameter values that favor the evolution of dimorphism, herkogamy may not evolve at all. For these reasons, we believe that the co-evolution of herkogamy and the ratio of L:R flowers would be worthy of further investigation.
Reductions in geitonogamy can promote transitions to dimorphism
We found that facilitative interactions between individuals with different stylar phenotypes, mediated by the pollinating function , resulted in the evolution of dimorphism from monomorphism through disruptive selection on the proportion of L- and R-flowers within a plant (Figure 2H). This transition occurred when the fitness costs of geitonogamy owing to inbreeding depression were high enough to favor phenotypes fixed for stylar condition (Figures 4 and 5). Experimental studies of pollen transfer have demonstrated that sufficiently large bees can promote pollinations between flowers of opposite stylar orientation (Minnaar & Anderson, 2021). As a result, levels of geitonogamous selfing should be reduced significantly for dimorphically enantiostylous plants in comparison with those in monomorphic populations as the latter have both L- and R-flowers and are thus prone to between-flower self-pollination (Jesson & Barrett, 2002b). In agreement with our results, previous studies have also proposed that the costs of geitonogamy can play an important role in floral evolution, including the evolution of sexual polymorphisms in reproductive traits (de Jong & Geritz, 2001; Harder & Barrett, 1995; Jesson & Barrett, 2005). Geitonogamy may be a ubiquitous outcome in species in which daily display sizes involve numerous flowers. It is, therefore, unsurprising, given the potential female (inbreeding depression) and male (pollen discounting) mating costs of geitonogamy, that animal-pollinated plant populations have evolved diverse floral mechanisms such as enantiostyly to limit pollen transfer between flowers within a plant.
Ecological factors influence invasion scenarios and evolutionary branching
Our model predicted that a high reproductive rate which, in turn, depended on the size of the daily floral display, the pollen-to-seed conversion efficiency, and pollinator activity, broadened the scope for the emergence of evolutionary branching in the evolving trait (stylar orientation) we considered (Figure 4). Conversely, strong competition for shared resources such as soil moisture or nutrients impeded evolutionary branching and instead favored the evolutionary stability of monomorphic enantiostyly (Figure 5). Unfortunately, explicit comparative analyses of traits and ecological characteristics between the two distinct forms of mirror-image flowers may not be especially revealing because of the limited number of evolutionary transitions to the dimorphic state in angiosperms.
In their theoretical investigation of the evolution of enantiostyly, Jesson et al. (2003a) proposed that dimorphism evolved from monomorphism through two separate and sequential invasions of variants with fixed, reciprocal handedness. By making this assumption they implicitly assumed that after the first invasion (assuming that they were not simultaneous, which seems improbable), the resident monomorphic population with mixed handedness was not replaced by the variant. If this did occur after the replacement of the resident, the persistence of the variant would be contingent on the efficiency of pollen transfer between flowers with the same stylar orientation, a scenario not discussed by Jesson et al. (2003a). Assuming that coexistence between a population of plants with mixed handedness and a variant with fixed handedness was possible, then our model predicts that because of negative frequency-dependent selection imposed by the reproductive benefits of between-flower type pollination, the population of plants with mixed stylar orientation would gradually evolve to dimorphic enantiostyly as the proportion of L- or R-flowers on mixed plants would likely change over time to reciprocally match the variant (Figure 2E and Supplementary Figure S3A). In summary, our model supports the Jesson et al. (2003a) scenario of two sequential invasions with fixed, reciprocal handedness (Figure 2B and E), and further sheds light on the evolutionary forces in between their hypothesised sequential invasions.
Significantly, our models revealed that inbreeding depression following geitonogamy, combined with the presence of pollinators that can efficiently mediate pollen transfer among flowers of both stylar orientations (low values), broadened the scope for evolutionary instability of an initially monomorphic population. However, the range of values for the fitness cost due to geitonogamy resulting in evolutionary branching was slightly decreased. This situation provided an advantage to the evolutionary repeller resulting in a monomorphic population with the direction of stylar deflection uniform among all individuals (Figures 4 and 5). Although relatively uncommon, this type of herkogamous stylar condition occurs in several angiosperm families (e.g., Gentianaceae). Also, five populations of Tenicroa (= Drimia) exuviate of the Hyacinthaceae (Jesson & Barrett, 2003) have been reported with exclusively right-deflected styles. This type of herkogamy can result in lower pollen transfer between flowers and, hence, in reduced probability of geitonogamous selfing. The viability of this evolutionary strategy depends on whether the ecological and environmental conditions allow for a sufficient rate of pollination. Indeed, the likelihood of the evolution of populations with a single stylar orientation may be greater in situations where there is weak competition for abiotic resources between individuals as this may positively increase plant density and promote and increased outcrossing. Thus, our models suggest that the existence of the stylar deflection of the type that occurs in Tenicroa might be attained through selection for a single stylar orientation rather than through the breakdown of dimorphic enantiostyly and loss of either the L- or R-phenotype from populations.
Finally, our model predicted that starting from a monomorphic state, complete inbreeding depression () leads to evolutionary branching and the origin of dimorphic enantiostyly or, alternatively, evolution toward a population fixed for a single stylar orientation. For this to occur, however, the population needs to exhibit a large enough floral display to cause geitonogamy, and/or there is weak competition among plants for resources. This is because the viability of a nonzero equilibrium density when fitness costs due to geitonogamy are maximum depend on whether individuals still have significant mating opportunities, that is, the density of plants is sufficiently high to allow for adequate transfer of pollen (see Supplementary Information S1).
High reproductive rate and weak competition favor the emergence of dimorphism
Our bifurcation analysis indicated that a high reproductive rate and/or a weak competition coefficient broadened the scope for evolutionary branching (Figures 4 and 5). In our model, the reproductive rate was influenced by several factors. Specifically, the daily display size had a quadratic effect whereas both the pollen-to-seed conversion coefficient and the pollinator visitation rate had a linear effect on the reproductive rate. Therefore, the absence of dimorphic enantiostyly in some lineages with monomorphic enantiostyly may be attributed to selective constraints associated with small daily floral display size, as suggested by Barrett et al. (2000). Thus, for dimorphism to evolve, a monomorphic population may first have to develop larger floral displays.
A recent study found a correlation between inbreeding depression and decreased floral longevity (Spigler & Charles, 2023). If decreased floral longevity is not counterbalanced by an increased rate of flowering, it would likely result in decreased daily floral display size. Such a daily floral display size, in our models, is positively correlated to the emergence of dimorphic enantiostyly. In our models, the key driver of evolutionary branching is geitonogamy, thus the observation that inbreeding depression may limit the size of daily floral displays suggests the existence of additional constraints on the emergence of dimorphism. Our models also suggest that the quantity and quality of pollinators visiting populations may also prevent the emergence of dimorphism from monomorphism by decreasing reproductive rate. On the one hand, pollinators capable of efficiently transferring pollen between flowers, regardless of the direction of stylar deflection, broaden the scope for the evolutionary instability of monomorphism. Alternatively, they may actually weaken selection for optimal L:R ratios and prevent a population from evolving toward dimorphism(Supplementary Figure S2).
It is also possible that limited pollinator service could potentially trigger selection of plants with larger daily floral displays (Sletvold et al., 2010), as large displays generally attract more pollinators (Grindeland et al., 2005). Also, as occurs in the orchid Satyrium longicauda, there is evidence of plasticity in display size in response to variation in pollinator service (Harder & Johnson, 2005; Spigler, 2017). In a future study, it would be interesting to explore whether changes in daily display size (due to either plasticity or adaptive evolution) could affect the emergence of dimorphism in mirror-imageflowers.
Both high reproductive rate and weak competition for shared resources positively influenced the density of individuals, with the competition coefficient ultimately being the most influential parameter in controlling density. This relationship means that plant density arises naturally from population dynamics considerations, rather than being included in the model as an independent parameter. A high density of individuals provides more mating opportunities compared to a situation in which individuals are sparsely distributed. Indeed, the latter case would be more likely to favor increased self-fertilization (Barrett & Eckert, 1990, see Table 1); Karron et al., 1995; Treuren et al., 1993). Thus, the demographic features of populations may be crucial for dimorphic enantiostyly to evolve, as low-density conditions are likely to result in a decreased probability of outcrossing and a reduction in the number of potential mating partners of the alternate stylar morph compared with a monomorphic population in which all individuals can potentially mate with one another. In this sense, a sparse population may not provide sufficient opportunities for outcrossing, making dimorphic enantiostyly a disadvantageous sexual system in terms of reproductive fitness.
Our model predicted that under restricted circumstances reversions from dimorphic enantiostyly to monomorphic enantiostyly might occur. Changes in the ecology of populations, such as a decline in pollinator service or increased competition for shared resources, were found to decrease the reproductive rate or increase the competition coefficient. This had the potential to bring a dimorphic population closer to the monomorphic regime, or even fully into it, with evolutionary trajectories that converge to (Figure 2D and Supplementary Figure S3B).
Enantiostyly as a case study for evolutionary branching driven by ecological facilitation
Whether evolution in our models results in a monomorphic or a dimorphic enantiostylous population strongly depends on the pollination function. This dependency occurs because this parameter facilitates reproductive connections between flowers within and among individuals through mating. In most adaptive dynamic models, inter- and intra-specific interactions are modelled through trait-dependent competition coefficients, representing competition for shared resources. In these circumstances, negative frequency-dependent selection serves to decrease intra-specific competition through evolutionary branching, with disruptive selection and subsequent character displacement minimizing inter-specific competition and ultimately maximizing fitness for specific trait patterns. In contrast to this commonly studied scenario, we used a facilitative interaction function, that is, the pollination function. In this context, the maximization of fitness is achieved through the maximization of facilitation, rather than the minimization of competition (Supplementary Figure S2A and C). This condition is particularly true when specialized pollinators visit enantiostylous flowers, that is, pollinators that are far more effective in dispersing pollen between flowers of the opposite rather than the same stylar orientation (high values, Supplementary Figure S2B). The resulting maximization of positive interaction leads to evolutionary branching, followed by disruptive selection with character displacement and the origin of dimorphism.
The idea that different types of ecological interactions other than competition, such as facilitation, cooperation, or mutualism can drive evolutionary diversification by generating resources and therefore niches is supported by both empirical (Blake et al., 2021; Turner et al., 1996) and theoretical (Doebeli & Dieckmann, 2000; Doebeli, 2002; de Jong & Geritz, 2001; Wechsler & Bascompte, 2022) evidence. However, the underlying mechanisms promoting evolutionary diversification through interactions that are cooperative or facilitative remain relatively poorly understood (Bird et al., 2019; Day & Young, 2004; Hardy et al., 2020), despite the widespread occurrence of these types of interaction in diverse ecosystems, including plant-insect, bacterial, and microbial biofilm networks (Blake et al., 2021; Poltak & Cooper, 2010). Our model is a striking example of evolutionary diversification resulting from positive ecological interactions and may serve to stimulate future investigations of the interplay between facilitative interactions and the potential for evolutionary branching.
Supplementary material
Supplementary material is available online at Evolution.
Data availability
The simulation code used in this study is available at https://doi.org/10.5061/dryad.0k6djhb9d. No new data were used.
Author contributions
M.S. and E.E.D. designed the models with input from S.C.H.B., and carried out the formal analysis. All authors conceived the study, interpreted the results, and wrote and edited the manuscript.
Funding
This work was supported by the Human Frontier Science Program (HFSP), grant no. RGP0036/2021.
Conflict of interest: The authors declare no conflict of interest.
Acknowledgement
We thanks Linley Jesson for her comments on an earlier version of the manuscript.
