


Abstract
The extreme asymmetry of species richness distribution across the tree of life has always intrigued evolutionary biologists. Two competing explanations have been proposed to explain this pattern—the clade age hypothesis and diversification rate variation. While these two scenarios may not be mutually exclusive, to what extent time and diversification rates interact to explain species richness patterns remains understudied. Here, we investigate the relative influence of these two scenarios using tarantulas (Family: Theraphosidae) as a model. Tarantulas represent a speciose group of spiders found worldwide but exceptionally diverse in South America. These spiders show two distinct patterns of microhabitat use (ground-dwelling or arboreal) and defense strategies (presence or absence of urticating hairs). Using various trait-independent and dependent diversification models, we test the clade age hypothesis, the role of microhabitat, antipredator defense strategy, and geography in influencing diversification rates. Our results suggest that clade age is the primary predictor of species richness distribution across the tarantula subfamilies. However, the presence of urticating hair probably disrupted this pattern in some clades by increasing the net diversification rates, not by increasing the speciation rate but by reducing the extinction rate.
Introduction
The extreme asymmetry in species richness across the tree of life has always fascinated evolutionary biologists. Some clades are depauperate while others are incredibly speciose. Two primary hypotheses explain this pattern of clade sizes across the tree of life. The first is the clade age hypothesis, wherein older clades have more species as a result of having more time to diversify and accumulate species than younger clades (McPeek & Brown, 2007). The other hypothesis suggests that different species richness in clades results from differences in diversification rates (i.e., speciation and extinction rates) across clades. Species-rich clades have relatively higher net diversification rates (higher speciation rates or lower extinction rates) caused by unique phenotypes or ecology specific to those clades (Rabosky et al., 2007). Apart from these two hypotheses, there is also the age-rate hypothesis, wherein younger lineages have faster rates (possibly because extinction rates might increase with age) (Francisco Henao Diaz et al., 2019). However, age-rate scaling has been shown to be an artifact of sampling (Louca et al., 2022).
Several large-scale studies have found that older lineages have greater clade species richness across different groups (e.g., Marin & Hedges, 2016; McPeek & Brown, 2007). On the other hand, the variation in diversification rates (either speciation or extinction or both) can obscure or even decouple the correlation between clade age and species richness. Several studies have reported such a decoupling of clade ages and species richness and found substantial variation in diversification rates across different clades (e.g., Rabosky et al., 2007; Scholl & Wiens, 2016).
Additionally, both clade age and diversification rates might influence lineages at different levels in the phylogeny. For example, diversification rate variation explains the species richness pattern across frog families in Tropical Andes (Hutter et al., 2017). However, within family variation in diversity is explained by the time-for-speciation effect.
Most studies investigating asymmetry in species richness across clades in different taxa can be divided in three broad categories (Figure 1) where asymmetry is explained by (a) clade age or time-for-speciation, (b) diversification rate variation, or (c) an interaction between clade age and diversification rate variation. Many studies favor the first and second of those explanations.
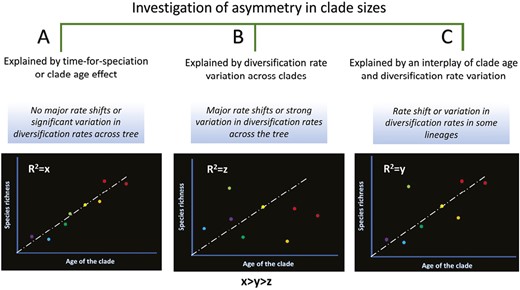
A schematic representation of categorization of studies to date investing asymmetric distribution of diversity across clades, and how the interaction of clade age and diversification rate variation produces different patterns.
In the case of diving beetles of family Dytiscidae (Ribera et al., 2008), New World Geckos (Gamble et al., 2011), Bulbophyllum orchid (Gamisch & Comes, 2019), and Emydid turtles (Stephens & Wiens, 2003), clade age appears to be the major predictor of distribution of diversity across lineages, whereas major variations in diversification rates across lineages have been inferred for taxa like mangroves (Ricklefs et al., 2006), passerine birds (Ricklefs, 2003), Australian Sphenomorphine skinks (Rabosky et al., 2007), Pholcid spiders (Eberle et al., 2018), and angiosperms (Magallón & Sanderson, 2001).
Studies integrating and testing both the clade age and diversification rate variation are rare. These two scenarios are not mutually exclusive and can interact to produce patterns of species richness and distribution. An interplay of clade age effect and diversification rate variation has been shown to explain the asymmetric distribution of diversity across lineages in water beetles of family Hydrophilidae (Bloom et al., 2014) and in the tribe Lysimachieae (Yan et al., 2018). Other studies found support for only one of the two scenarios (Cerezer et al., 2022; Marin & Hedges, 2016; Xue et al., 2020). It is crucial to test both hypotheses to disentangle the relative influence of both scenarios in generating species richness and distributional patterns. A schematic representation of how the interaction of clade age and diversification rate variation can produce different patterns of interclade diversity is shown in Figure 1.
We test the relative role of clade age and diversification rate variation to explain the large unevenness in species richness patterns using tarantulas (family Theraphosidae) as a model system. Theraphosidae is an interesting model system with respect to this question. Tarantulas represent a speciose group of spiders (1,010 species at the time of writing this manuscript) distributed across South America, Africa, Indian subcontinent, South East Asia and Australasia (Foley et al., 2021). Tarantulas also have a number of adaptations, such as venom, color, stridulatory, and urticating hairs, that make them an exciting model for macroevolutionary studies (Foley et al., 2019, 2020). They also show extreme asymmetry in species richness distribution across 13 subfamilies. Subfamilies like Theraphosinae (~590 species) and Selenocosmiinae (~120 species) are quite speciose. On the other hand, Thrigmopoeinae (8 species), Stromatopelminae (9 species), and Poecilotheriinae (15 species) are less diverse (Foley et al., 2019; Lüddecke et al., 2018). Table S2 (Supplementary Material) represents the species richness distribution across the 13 subfamilies.
We, here, explore the correlates of this asymmetric distribution of diversity across tarantulas. We first tested the clade age hypothesis by exploring the relationship between clade age and species richness. We then used different trait-dependent and independent diversification models to explore whether macroevolutionary diversification rates varied across different clades with varying traits. Tarantulas show two distinct patterns (see Figure 2) of microhabitat use (either ground-dwelling or arboreal) and antipredator defense strategy (presence or absence of urtication) (Foley et al., 2019, 2020). These traits are conserved at the subfamily level (Foley et al., 2020).
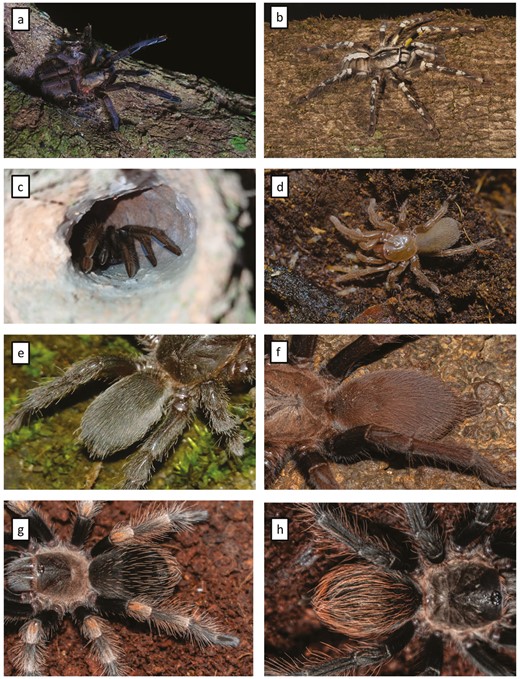
Tarantulas in arboreal habitat (A and B) and ground (C and D). Tarantulas without (E and F) and with (G and H) urticating hairs. Image credit—Avrajjal Ghosh and Zeeshan Mirza. Taxa id: (A) Chilobrachys sp. (B) Poecilotheria regalis. (C and F) Thrigmopoeus sp. (D) Plesiophrictus sp. (E) Chilobrachys sp. (G and H) Lasiodora parahybana.
Several studies have shown that microhabitat preferences can influence diversification rates (Eberle et al., 2018; Moen & Wiens, 2017; Cyriac & Kodandaramaiah, 2018). Additionally, the evolution of effective antipredatory strategies can alter macroevolutionary dynamics by releasing species from ecological constraints associated with predation (Schluter, 2000; Vamosi, 2005), thereby allowing species to “escape-and-radiate” by increasing diversification rates (Arbuckle & Speed, 2015). Thus, we tested whether microhabitat use and antipredator defense strategy affect diversification rates in tarantulas. In the case of tarantulas, we see that clades with more diversity (Theraphosinae and Selenocosmiinae) are either ground-dwelling or have urticating hairs or both. However, clades with arboreal characters (Aviculariinae, Psalmopoeinae, and Poecilotheriinae) or without urticating hairs (all the old-world clades except Selenocosmiinae) usually have less diversity. We expect to see the influence of these characters on the macroevolutionary dynamics of tarantulas.
Materials and methods
Assembling a large chronogram of tarantulas
We mined GenBank to build a large phylogeny of tarantulas. We downloaded all available sequences and retained three mitochondrial (Cox I, 12S-val-16S, and 16S-leu-ND1) and one nuclear marker (18S) after final filtering, as they had relatively better coverage (40–80%) to maximize the taxon coverage. We included any taxa for which at least one marker is available among the four. The final dataset contained 150 taxa from 12 subfamilies. The details of the markers and accession numbers are given in Supplementary Material (Table S1). There is a strong correlation between the sampled diversity and real diversity from each subfamily (R2 = 0.86, Supplementary Table S2 and Supplementary Figure S1). We did not include the Subfamily Selenogyrinae due to lack of sequences.
All the markers were concatenated to build a supermatrix (4,415 bp). All the mitochondrial markers were treated as a single partition, and the nuclear marker was treated as a separate partition. The best model of sequence evolution for each partition was chosen by running partitionfinder (Lanfear et al., 2012). Based on previous phylogenetic studies, all the taxa were constrained to be part of their respective subfamilies and all the subfamilies were defined as monophyletic groups (Table S1 in Supplementary Material). The higher-level topology (backbone phylogeny), that is, the relationship between subfamilies and the timings of divergence between subfamilies were defined a priori as per Biswas et al. (2023), which is the most updated time-calibrated higher-level phylogeny of tarantulas using fossils and genomic data. The program BEAST v.2.6.6 (Bouckaert et al., 2019) was run with a relaxed clock log-normal model to infer the divergence times within the subfamilies and to infer the crown group ages of 12 subfamilies. Marker-specific substitution rates for these spiders were assigned to different partitions (Opatova & Arnedo, 2014). For the mitochondrial partition, a uniform prior was assigned to the ucld.mean parameter of the log-normal relaxed clock, with an initial value of 0.0127 and a deviation of ± 0.0045. Uniform priors to the ucld.mean were assigned for the nuclear partition, with lower and upper bounds of 0.0001 and 0.0115, respectively, and a starting value of 0.001. Two MCMC chains were run for 200 million generations and combined with log-combiner (Bouckaert et al., 2019). Stationarity was determined using TRACER v1.7 (Rambaut et al., 2018). The effective sample size values greater than 200 were ensured for all parameters. The output trees from the posterior distribution were summarized as a maximum clade credibility (MCC) tree with TreeAnnotator v2.6.4 (Bouckaert et al., 2019). This MCC chronogram served as input for all the downstream analyses. All the subsequent analyses were performed in RStudio (R Core Team, 2021).
Testing the clade age hypothesis
We tested the correlation between crown group age and species richness of clades to check if the clade age hypothesis holds for theraphosids. The mean crown group ages were extracted for each subfamily from the chronogram. The known species richness of each subfamily was extracted from the World Spider Catalog (2023) database and log-transformed. We performed phylogenetic linear regression using the phylolm function from the phylolm package (Tung Ho & Ané, 2014) by specifying model “lambda” such that, phylogenetic signal is simultaneously estimated with PGLS residuals. If lambda optimizes to 1, then the model is equivalent to PGLS regression with model = “BM”; if lambda optimizes to 0, then the model is equivalent to nonphylogenetic regression.
Ancestral state reconstruction of candidate factors
We performed ancestral state reconstruction to understand the frequency and directionality of the evolution of candidate traits. We collected microhabitat use data (ground-dwelling or arboreal) and antipredator defense strategy (presence or absence of urticating hair) for all taxa from literature (Table S1 in Supplementary Material). All the taxa were coded to be in either state 0 or 1 (microhabitat: 0 indicates ground-dwelling, 1 indicates arboreal; urticating hair: 0 indicates absence, 1 indicates presence) and the analyses were performed separately for microhabitat and urtication datasets. We fitted the ER (equal rate) and ARD (discrete rate) models. Both the models produced the same results. The likelihood ratio test suggested that ARD model is not a better fit to the data than ER model. So, then using the function simmap in R package phytools (Revell, 2012), we reconstructed 1,000 stochastic maps for each trait according to the ER model and summarized them. It must be noted that for some tarantulas, it is hard to identify the microhabitat preference as they show change in habitat preference across life-history stages (like Pterinochilus, Ephebopus, and Chilobrachys). However, capturing such a fine level of variation is beyond the scope of this study. We coded these tarantulas to be in either state 0 or 1 based on the predominant microhabitat preference at the adult stage.
Trait-dependent diversification with BiSSE and HiSSE
Trait-dependent diversification methods were used to test if the variation in diversification rates is due to traits. First, we performed the Binary State Speciation and Extinction (BiSSE) analysis (Maddison et al., 2007) using the R package diversitree (Fitzjohn, 2012) to test for differences in speciation, extinction, and transition rates between states (0 and 1) for both traits. We tested a total of 12 models (Table 1) accounting for incomplete taxon sampling (sampling fractions: arboreal 0.23, ground-dwelling 0.15, urticating 0.18, and nonurticating 0.11). The speciation, extinction and transition rate parameters were allowed to vary between states in the full model. Either each of the parameters or a combination of parameters was constrained to be equal between states in other models. Akaike information criterion (AIC) was used to evaluate model fit. A ΔAIC score of greater than two was considered good, and a ΔAIC score of greater than 10 was considered strong support against a model (Beier et al., 2001). We ran two MCMC (Markov Chain Monte Carlo) chains for 100,000 generations to estimate the Bayesian posterior distribution of the model parameters.
Results of model testing in BiSSE, HiSSE, and GeoHiSSE. Values for the best models are highlighted in bold. The null models are marked by asterisk.
| BiSSE | HiSSE | GeoHiSSE | ||||||||||
|---|---|---|---|---|---|---|---|---|---|---|---|---|
| Urtication | Microhabitat | Urtication | Microhabitat | |||||||||
| Models | AICc | ΔAIC | AICc | ΔAIC | Models | AICc | ΔAIC | AICc | ΔAIC | Models | AICc | ΔAIC |
| Full model | 1,233.057 | 2.00 | 1,274.387 | 1.21 | Bisse.like.hisse_null* | 1,244.185 | 10.546 | 1,275.981 | 9.05 | M1 range-independent (no hidden state)* | 1,244.00 | 6.92 |
| λ0 = λ1 | 1,234.818 | 3.76 | 1,274.281 | 1.11 | Bisse.like.hisse_full | 1,233.639 | 0 | 1,274.387 | 7.456 | |||
| μ0 = μ1 | 1,237.705 | 6.65 | 1,273.467 | 0.29 | hisse.null2_8transRate* | 1,246.783 | 13.144 | 1,266.931 | 0 | M2 range-dependent (no hidden state) | 1,444.12 | 207.04 |
| λ0 = λ1, μ0 = μ1* | 1,243.909 | 12.85 | 1,275.32 | 2.15 | hisse.null2_0 to 1 = 0* | 1,256.447 | 22.808 | 1,271.449 | 4.518 | |||
| q01 = q10 | 1,231.523 | 0.47 | 1,273.241 | 0.07 | hisse.null2_1 to 0 = 0* | 1,253.176 | 19.537 | 1,267.843 | 0.912 | M3 range-independent (hidden state)* | 1,237.08 | 0 |
| λ0 = λ1, q01 = q10 | 1,233.928 | 2.87 | 1,275.466 | 2.29 | hisse.null4_Equal* | 1,251.515 | 17.876 | 1,271.706 | 4.775 | |||
| μ0 =μ1, q01 = q10 | 1,237.255 | 6.20 | 1,274.582 | 1.41 | hisse.null4_3transRate* | 1,252.602 | 18.963 | 1,267.472 | 0.541 | M4 range-dependent (hidden state) | 1,245.92 | 8.84 |
| λ0 = λ1, μ0 = μ1, q01 = q10* | 1,243.991 | 12.94 | 1,274.547 | 1.37 | hisse.full2 | 1,265.682 | 32.043 | 1,280.138 | 13.207 | |||
| q01 = 0 | 1,299.132 | 68.08 | 1,307.363 | 34.19 | hisse.full2_EqTransRate | 1,240.811 | 7.172 | 1,270.009 | 3.078 | |||
| q10 = 0 | 1,231.05 | 0.00 | 1,273.168 | 0.00 | hisse.full2 0 to 1 = 0 | 1,265.46 | 31.821 | 1,277.903 | 10.972 | |||
| λ0 = λ1, μ0 = μ1, q01 = 0* | 1,301.554 | 70.50 | 1,310.587 | 37.41 | hisse.full2 1 to 0 = 0 | 1,256.68 | 23.041 | 1,276.189 | 9.258 | |||
| λ0 = λ1, μ0 = μ1, q10 = 0* | 1,241.909 | 10.85 | 1,274.81 | 1.64 | Hisse.full4 | 1,289.001 | 55.362 | 1,303.066 | 36.135 | |||
BiSSE has been powerful in several empirical studies, especially for large phylogenies (Gamisch, 2016). However, BiSSE is prone to type I error in cases of smaller phylogenies, tip ratio bias and cases of rate heterogeneity independent of the trait in the test (Rabosky & Goldberg, 2015). Therefore, we further evaluated trait-dependent diversification by implementing the Hidden State Speciation Extinction (HiSSE) analysis using the R package hisse (Beaulieu & O’Meara, 2016). HiSSE addresses the limitation of BiSSE by invoking hidden states to explore potentially hidden or unsampled factors that could have caused the heterogeneity in diversification rates independent of the focal trait. HiSSE allows the comparison of complex character-independent null models that can alter diversification rates across clades. Accounting for incomplete taxon sampling, we ran 12 HiSSE models. The models included two BiSSE-like HiSSE models, five null models with two and four hidden states, and five character-dependent diversification models with two and four hidden states (Table 1). AIC scores were used to evaluate the best model. We also plotted the ancestral state reconstructions for the character states along with the estimated diversification rates for the whole phylogeny.
Additionally, we tested if the exceptionally high diversity of tarantulas (~70%) in South America results from range-dependent diversification. We conducted geoHiSSE analysis to check if South American landmass affects diversification. All taxa were coded to be either American or old world. We employed geoHiSSE using the package hisse (Beaulieu & O’Meara, 2016) and tested four models accounting for incomplete taxon sampling (American – 0.16 and non-American – 0.14): (a) range-independent diversification without hidden state (M1) and no rate heterogeneity across phylogeny; (b) range-dependent diversification without hidden state (M2) and rate heterogeneity across phylogeny due to geographic ranges; (c) range-independent diversification with hidden state (M3) and rate heterogeneity in the phylogeny due to hidden states but not due to geographic ranges and (d) range-dependent diversification with hidden state (M4) and rate heterogeneity in the phylogeny due to geographic ranges and not due to hidden states (Table 1).
Trait-independent diversification with MiSSE
Finally, we employed Missing State Speciation and Extinction (MiSSE) analysis (Vasconcelos et al., 2022) using the R package hisse (Beaulieu & O’Meara, 2016) as another line of test to evaluate the association of diversification rates with traits. MiSSE is a trait-independent method, and it is intended to be used for the estimation of tip rates. MiSSE belongs to the same class of models as BiSSE and HiSSE (Beaulieu & O’Meara, 2016; Maddison et al., 2007). However, it does not take the trait information and invokes only hidden states to calculate tip rates across the phylogeny (Vasconcelos et al., 2022). Thus, when the aim is to measure rates without considering the trait distribution across the phylogeny, MiSSE offers an appropriate trait-free alternative. Compared to nonparametric methods that only quantify speciation rates, MiSSE has the advantage of being model-based, making it less prone to stochasticity and error (Maliet et al., 2019; Rabosky, 2018, 2019; Scott, 2022; Title & Rabosky, 2019; Vasconcelos et al., 2022).
Given the size of the phylogeny, an exhaustive search among all possible MiSSE models (52 diversification parameters and 26 hidden states) was not practical. Most of the models are far too complex for a tree containing only 150 taxa. We kept the search restricted to four hidden states and five estimated parameters accounting for incomplete taxon sampling (global sampling fraction 0.15). We used the MiSSEGreedy function to evaluate models in chunks of three. The algorithm uses AICc to assess the models in a chunk, beginning with simpler models and moving to more complex ones. The algorithm ends the search if all the models in a chunk are not improving the delta AICc score difference set up by the user (ΔAICc < 2). Once the search was over, we pruned the redundant models, and model-averaged tip rates were obtained.
We extracted the tip rates for all taxa and checked for an association between tip rates and trait states (0 and 1) for both traits (microhabitat and urtication) with PGLS ANOVA using the package phylolm (Tung Ho & Ané, 2014).
Sensitivity analysis
To account for uncertainty in age estimates and relationships among taxa, we randomly sampled 100 trees from the posterior distribution of the dating analysis. Then we ran both clade age testing and HiSSE on those 100 trees. The results were visualized by plotting estimates across 100 trees and boxplots to illustrate median values and parameter dispersion due to variations in phylogenetic trees.
Simulations to test the robustness of inference under incomplete taxon sampling
Our phylogeny included only 15–16% of the extant diversity of tarantulas. For estimation of crown group ages, we had ≥50% diversity at the genus level for nine of the 12 subfamilies included. To test the robustness of the inferences under incomplete taxon sampling, we simulated ten complete phylogenies with 1,010 taxa to mimic the tarantula tree of life, using the average values of speciation, extinction and transition rates between traits estimated according to the best-fit BiSSE and HiSSE models. Due to computational constraints, we restricted the number of simulations to ten. The empirical phylogeny represented 13% of the tarantulas without urticating hair and 18% of the taxa with urtication. Then, we randomly subsampled 13% of the taxa in state 0 (urtication absent) and 18% of taxa in state 1 (urtication present) from the simulated phylogenies to represent incompletely sampled phylogenies with roughly 15–16% of the total diversity (155–166 species). This was done for all 10 simulated phylogenies to represent 10 incompletely sampled phylogenies. Now, both BiSSE and HiSSE were run on these ten subsampled phylogenies to test if they still detected the model correctly that produced the phylogeny and compared the parameter estimates from the simulated phylogenies with the parameters estimated from real phylogeny.
We also did simulations for microhabitats where we randomly subsampled 23% of arboreal taxa and 15% of ground-dwelling taxa (23% and 15% represent the sampling fraction for both states in the empirical phylogeny) to represent ten incompletely sampled phylogenies. Then, we repeated both BiSSE and HiSSE on those phylogenies.
Results
Divergence time estimation and chronogram of tarantulas
The large chronogram of tarantulas (Figures 3 and 4) shows that the most speciose subfamily, that is, Theraphosinae is older than all the other subfamilies (crown age ~50 Ma). Other speciose subfamilies like Selenocosmiinae and Eumenophorinae are also relatively old (49 and 43 Ma, respectively). In contrast, species-poor subfamilies like Thrigmopoeinae and Stromatopelminae are less than 30 Ma old. Relationships within subfamilies were congruent with previously published phylogenies (Foley et al., 2019, 2020, 2021; Hamilton et al., 2016; Lüddecke et al., 2018; Ortiz et al., 2018).
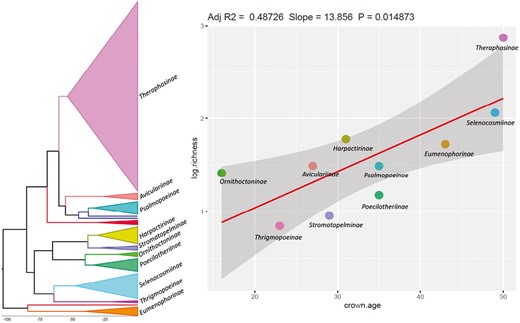
Relationship between clade age and species richness in tarantulas. The chronogram is shown on the left, and the clades are marked. Phylogenetic regression results are shown on the right.
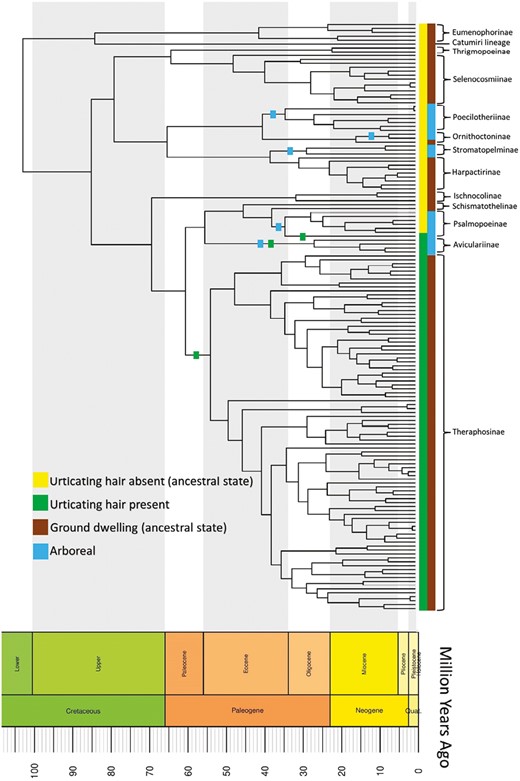
Ancestral state reconstruction for urtication and microhabitat on the chronogram. For microhabitat, ground-dwelling is the ancestral state and arboreality evolved at least five times independently. Lineages along which arboreality evolved are marked with blue boxes. In case of urtication, absence of urtication is the ancestral state and urtication evolved independently at least three times. Lineages along which arboreality and urtication evolved are marked with squares.
The clade age hypothesis
A significant correlation was found between the clade age and species richness at the subfamily level (p < .05, Figure 3), and the value of lambda optimized to be zero. Clade age explains around 49% of the variation in species richness values across subfamilies. The results of the regression along with the chronogram of tarantulas, are shown in Figure 3. Theraphosinae (~590 species) is the only clade that has more diversity than predicted by clade age.
On the other hand, Poecilotheriinae (15 species) and Stromatopelminae (9 species) have less diversity than predicted by clade age. Furthermore, the Theraphosinae clade is not only the most diverse but also has conspicuous urticating hairs. The clades Poecilotheriinae and Stromatopelminae are arboreal and lack urticating hairs (Foley et al., 2019).
Ancestral state reconstructions
The results of the ancestral state reconstructions are summarized in Figure 4, showing a unidirectional pattern of trait evolution. The results indicate that ground-dwelling was the ancestral state and that arboreality independently evolved at least five times in new and old-world clades. In the case of urtication, we found that the absence of urticating hairs was the ancestral state, with urticating hairs evolving at least three times independently only in new world clades. There are only gains for both arboreality and urticating hairs and no loss.
Trait-dependent diversification with BiSSE and HiSSE
BiSSE supports a trait-dependent diversification scenario for urticating hairs. Trait-dependent models are significantly better than trait-independent models (ΔAIC > 10). The best-fit model indicated that speciation and extinction rates are different between trait states (with state 1 having a higher net diversification rate than state 0 due to lowered extinction rates) and transitions were unidirectional from non urtication to urtication. HiSSE analysis on the presence of urtication agrees with the BiSSE results. HiSSE suggests a trait-dependent diversification scenario for urtication with strong support (ΔAIC > 10). The best-fit model was a BiSSE-like HiSSE model. The parameter estimates from HiSSE also suggest a stark difference in extinction rates, with the absence of urtication associated with much higher extinction rates lowering the net diversification rate (Figure 5A). All the results of BiSSE and HiSSE are summarized in Table 1. The posterior distribution of the parameter estimates from MCMC simulations for both urtication and microhabitat can be found in supplementary material (Figures S2 and S3).
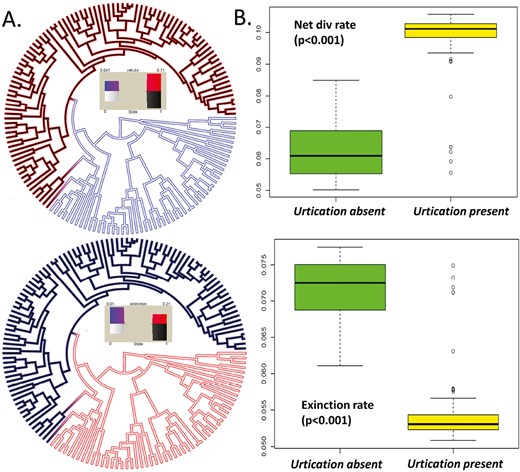
Panel A shows the net diversification (up) and extinction (down) phylorate plots estimated for the whole phylogeny along with the trait states according to the best HiSSE model. The internal color of the branches represents the trait states (white—urtication absent and black—urtication present). The external color represents the rates. Panel B shows box plots of tip rates estimated with MiSSE for net diversification rates (up) and extinction rates (down) in presence and absence of urtication. PGLS ANOVA significance values are also shown.
BiSSE also supports a trait-dependent diversification for microhabitat use but with low support (ΔAIC < 2). The best-fit BiSSE model was a scenario where speciation and extinction rates are different between trait states and transitions were unidirectional from ground-dwelling to arboreal. The Bayesian posterior distribution of parameter estimates found a significant overlap in the probability distribution of both speciation rates and extinction rates between states (Figure S3 in Supplementary Material). HiSSE supports a scenario where microhabitat use has no influence on diversification rates. The best-fit model was a HiSSE null model with two hidden states and eight transition rates, which is significantly better than most of the full models (ΔAIC > 10). The list of models tested and the Akaike statistics are presented in Table 1.
The results of the geoHiSSE analysis support a scenario where the diversification rates are independent of geographic ranges. Among the four models tested, the best-fit model is the range-independent model with hidden states (M3). M3 has the highest likelihood and a significantly higher Akaike weight compared to other models. Results of the geoHiSSE analysis are shown in Table 1.
Trait-independent diversification with MiSSE
We plotted the trait states for both the traits at the tips along with the phylorate plot estimated with MiSSE (Figure S4). Overall, MiSSE suggests an elevated net diversification rate in the presence of urtication and a reduced extinction rate. The extinction rate is higher without urtication, lowering the net diversification rate. PGLS ANOVA suggests a strong association of diversification rates with urtication (p < .001) but not with microhabitat (p = .071). The box plots of net diversification and extinction rates are shown in Figure 5B. In the presence of urtication, the net diversification rate is much higher, and extinction rates are lower.
Sensitivity analysis
Clade age testing across trees from posterior distribution suggested that 86 out of 100 trees show a significant correlation (p < .05) between crown group age and species richness. The p-values across 100 trees are plotted (Figure 6B). A box plot of adjusted R-squared values and estimated slopes are plotted (Figure 6B). On average, clade age explained around 41% of the variation in species richness distribution across trees.
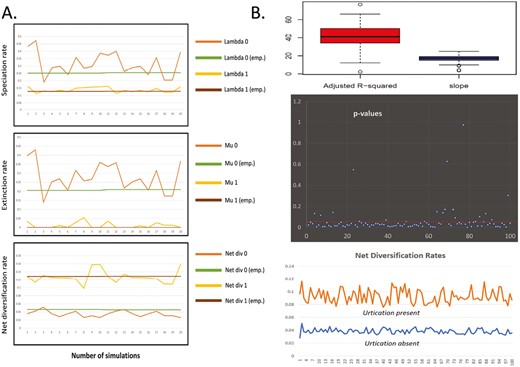
Panel A, comparison of parameter estimates from the empirical phylogeny and simulated phylogenies (0—urtication absent and 1—urtication present) to test the effect of incomplete taxon sampling Panel B shows the result of sensitivity analyses—box plots of adjusted R-squared values and slopes from phylogenetic regression across 100 trees (upper), p-values from phylogenetic regression across 100 trees (middle), and net diversification rates according to the best fitted HiSSE model from 100 trees.
HiSSE analysis for the 100 trees consistently supported a Bisse-like HiSSE model with strong support (ΔAIC > 10). The net diversification rates across 100 trees are plotted (Figure 6B). The trend shows significantly higher net diversification rates in the presence of urtication.
Simulation results
For all incompletely sampled phylogenies, both BiSSE and HiSSE correctly identified the models that were used to simulate the complete phylogeny. In the case of urtication, trait-dependent models were the best-supported model for all runs, with a transition rate from urtication to nonurtication being zero. On the other hand, trait-independent or null models were consistently favored for microhabitat. The results for urtication are shown in Figure 6A. The estimated value of the parameters (speciation, extinction, and net diversification) varied from run to run and between the simulated and empirical phylogenies. However, the overall trend is similar to the one estimated from the empirical phylogeny. The estimated value of parameters from 20 simulations (10 BiSSE and 10 HiSSE) are plotted and compared with the values estimated from the empirical phylogeny in Figure 6A. In the presence of urtication, the net diversification rates are significantly higher due to reduced extinction rates.
Discussion
The clade age hypothesis
The clade age scenario is an intuitive explanation and is the main predictor of species richness in the absence of variation in diversification rates (McPeek & Brown, 2007). However, the variation in diversification rates can obscure or even decouple the correlation between clade age and species richness. The clade age hypothesis has been supported in several taxa-specific (Bloom et al., 2014; Gamble et al., 2011; Ribera et al., 2008; Stephens & Wiens, 2003) as well as broad-scale studies (McPeek & Brown, 2007). In tarantulas, too, clade age appears to be a significant predictor of the asymmetry in species richness across the subfamilies.
Multiple evolutions of arboreality and urtication
Ancestral state reconstructions show that both arboreality and urtication evolved multiple times and are never lost, which has also been suggested by Foley et al. (2020). Their tree had only 39 taxa, whereas our analysis with a more extensive dataset (150 taxa) also supports their findings. Additionally, the transition rates between the trait states estimated with both BiSSE and HiSSE suggest significantly higher transition rates from ground-dwelling to arboreality and nonurtication to urtication states than vice versa, corroborating the results of ancestral state reconstructions.
The timings of the evolution of arboreality are intriguing. The first arboreal ancestor appeared around 34 million years ago, which marks the transition from Eocene to Oligocene (Sun et al., 2014). Arboreality evolved five times between 34 and 24 million years, that is, around the Eocene–Oligocene transition (EOT). The EOT indicates a critical global event in the geological timescale marked by large-scale extinctions and significant faunal and floral turnover (Sun et al., 2014). It appears that tarantulas shifted to arboreal habitat independently multiple times around EOT.
Urtication alters diversification rates but not microhabitat
Both trait-dependent and independent methods suggest that microhabitat use does not alter diversification rates, but urtication does. BiSSE, HiSSE, and MiSSE indicate a strong correlation between higher net diversification rates and the presence of urtication.
Urticating hairs provide efficient direct and indirect protection against predators. Tarantulas shoot urticating hairs whenever threatened or attacked, which can cause irritation, allergic reactions, edema, and temporary or permanent blindness in the attacker (Bertani et al., 2003; Bertani & Guadanucci, 2013; Kaderka et al., 2019). Tarantulas also employ these hairs for indirect defense against predators by incorporating urticating hairs in the silk mat of their burrow or the silk covering of the egg sac that deter predators (Araneae et al., 1990; Bertani & Guadanucci, 2013). In vitro experiments and empirical observations have shown that silk mats or egg sacs incorporated with urticating hairs effectively entrapped and immobilized ants and phorid larvae (Rogério Bertani & Guadanucci, 2013).
All tarantulas are venomous, and venom evolution has been shown to be adaptive trait that is used for defense or prey immobilization in various groups (Morgenstern & King, 2013). However, venom is costly to produce and maintain. Any trait that conserves venom should be considered an evolutionary and competitive advantage (Morgenstern & King, 2013). In this regard, urticating hairs might be beneficial in conserving venom. A study of defensive behavior and antipredatory strategies in tarantulas suggested that tarantulas show two clear divergent antipredatory defense strategies with apparent geographical affinity—shooting urticating hairs or delivering venomous bites (Blatchford et al., 2011). In vitro experiments showed that old-world tarantulas are significantly more aggressive and frequently bite, delivering venom when provoked. However, new world tarantulas bite rarely; instead, they shoot urticating hairs (Blatchford et al., 2011). A study on the lethality of the venom of tarantulas using lab mice showed that lethality is several folds higher in old-world tarantulas than in new world species. Old-world tarantula venom killed mice in less than 10 min, whereas new world tarantula venom took more than an hour (Escoubas et al., 1999). Venom investigation has also shown that old-world tarantulas are prime candidates for bioprospecting (Lüddecke et al., 2019). There is a clear inverse correlation between venom toxicity and the presence of urtication (Blatchford et al., 2011; Escoubas et al., 1999). Given this background, it is plausible that the evolution of urticating hair (made of chitin, a part of the exoskeleton) conserved venom and caused the loss of some of the venom components, eventually resulting in competitive as well as evolutionary advantage. Future evolutionary venomic studies should focus on testing this scenario.
Novel antipredatory defense strategies are suggested to increase diversification rates. The evolution of antipredator defense can allow species to be more exposed and utilize more resources in the environment and, thus, lead to niche expansion (Cyriac & Kodandaramaiah, 2021; Merilaita & Tullberg, 2005; Speed et al., 2010). The “escape-and-radiate” hypothesis states that novel antipredator traits help organisms escape from the constraints of predation pressure and speciate more, eventually leading to more diversification (Ehrlich & Raven, 1964; Schluter, 2000). Though the “escape-and-radiate” hypothesis is exclusively focused on speciation, the macroevolutionary consequences of antipredator strategies can affect both speciation and extinction rates, which are rarely tested (Arbuckle & Speed, 2015). The evolution of conspicuous coloration has been shown to increase the speciation rate but has no effect on extinction rates. In contrast, the evolution of chemical defense decreases net diversification by increasing the extinction rate in amphibians (Arbuckle & Speed, 2015). Urticating hairs in tarantulas appears to increase the net diversification rate by decreasing extinction rates rather than increasing the speciation rates.
It has been argued that speciation rates can be inferred more confidently than extinction rates from phylogenies (Rabosky, 2010). Although our results predominantly infer differences in extinctions between clades with and without urticating hairs, these patterns were consistently recovered employing different methods, providing more confidence in our results.
Among the subfamilies with urticating hairs, Theraphosinae exhibits very high diversity. In contrast, the other subfamilies (Aviculariinae and Psalmopoeinae) are less diverse (Foley et al., 2019). How do we explain this pattern? There could be two potential explanations. First, Aviculariinae (crown age ~27 Ma) and Psalomopoeinae (crown age ~35 Ma) are younger than Theraphosinae (50 Ma), and therefore did not have enough time to accumulate high diversity like Theraphosinae. Additionally, only one genus (Ephebopus) in the subfamily Psalopoeinae has urticating hair (Kaderka et al., 2019). Furthermore, Theraphosinae has combinations of urticating hairs (type IV with type I or III) that serve different defense purposes (Kaderka et al., 2019). The combination of urticating hairs might have given Theraphosinae the extra advantage compared to only one type in Aviculariinae (type II) and Psalmopoeinae (type V).
It can be argued that any synapomorphy of the subfamily Theraphosinae can cause this pattern, not only the urticating hairs. However, it must be noted that the monophyly of Therapohosinae is supported by only one unique character: the presence of type I, III, and IV urticating setae (Kaderka et al., 2019; Pérez-Miles et al., 1996). No other unique character is shared by the members of Theraphosinae (Pérez-Miles et al., 1996). Moreover, the monophyly of Theraphosinae is well supported in several molecular phylogenetic studies (Foley et al., 2019, 2021; Hamilton et al., 2016; Lüddecke et al., 2018). Thus, this unique combination of urticating hairs appears to be the only morphological synapomorphy of this group. Given this unique character and the biological advantages granted by it, urtication appears to be the primary reason behind exceptionally high diversity in Theraphosinae. However, it must be noted that none of these tools test for causation. Though a strong correlation has been found between the presence of urtication and elevated diversification rates, inferring causation is still beyond the scope of this kind of macroevolutionary study.
Conclusion
While trying to explain the asymmetry of diversity across clades for any group, it is crucial to investigate both clade age and diversification rate variation to disentangle the relative influence of these two factors. We have categorized all the studies regarding this aspect into three broad categories. The macroevolutionary dynamics of tarantulas appear to fall in category B. The distribution of diversity across clades (at the subfamily level) has been shaped by a combined effect of both clade age effect and diversification rate variation. We show that an interplay of clade age and antipredator trait shapes patterns of extant species diversity of theraphosids. The results suggest that clade age is the major predictor of species richness distribution across tarantula subfamilies, explaining around 40% of the variation. However, the exceptional species diversity in some lineages that deviate from this clade age pattern can be explained by an increase in diversification rates, probably due to the evolution of urticating hairs. Our research provides novel insight into the patterns of species diversity and the macroevolutionary consequences of the evolution of arboreality and antipredatory defense. It has been shown that antipredator strategies can affect diversification by increasing speciation or increasing extinction (Arbuckle & Speed, 2015). To the best of our knowledge, we do not know of any other instance where the evolution of defense strategy has decreased extinction rates. Being the only arachnid group with urticating hairs, tarantulas appear to have had a unique evolutionary trajectory where the gain of novel defensive traits has increased diversification rates, most likely by reducing extinction rates rather than increasing speciation rates supporting the “escape-and-radiate” hypothesis.
Data availability
All the data and scripts are available from the Dryad Digital Repository: https://doi.org/10.5061/dryad.dbrv15f76
Author contributions
A.B. and K.P.K. conceived the study. A.B. did background study, collected data and performed the analyses. A.B. wrote the first draft. K.P.K. vetted and modified the manuscript.
Funding
The authors thank IoE Programme for funding.
Conflict of interest: The authors declare no conflict of interest.
Acknowledgements
The authors thank R. Chaitanya and Vivek Philip Cyriac for guidance, discussion and comments on the manuscript. No permits were required to carry out this study.
