


Abstract
A key area of interest in evolutionary biology has been understanding the role of ecological opportunity in the formation of adaptive radiations, lineages where speciation and phenotypic diversification are driven by open ecological opportunity. Evolutionary theory posits that adaptive radiations should show initial bursts of ecomorphological diversification and rapid speciation, and that these two processes are correlated. Here, we investigate and contrast these predictions across ecomorphologically diverse continental (Australia) and insular (New Caledonia and New Zealand) radiations of diplodactyloid geckos. We test two key hypotheses: (a) that island colonization and the transition to novel niche-space has resulted in increased rates of speciation and trait diversification and (b) that rates of morphological diversification are correlated across multiple trait axes. Surprisingly, we find that speciation rate is homogenous and morphological diversification rates are idiosyncratic and uncorrelated with speciation rates. Tests of morphological integration suggests that while all traits coevolve, constraint may act differentially on individual axes. This accords with a growing number of studies indicating that ecologically diverse and species-rich radiations can show limited or no evidence of exceptional regime shifts in speciation dynamics or morphological diversification, especially in continental contexts.
Species richness and phenotypic diversity are not evenly distributed among clades, a pattern that is clear across the tree of life (Moen & Morlon, 2014; Rabosky et al., 2013; Rabosky, 2014; Shi & Rabosky, 2015). Understanding the processes responsible for this asymmetry is a central focus of macroevolutionary studies (Louca & Pennell, 2019). Observed (extant) species diversity has been shaped by bouts of speciation and extinction (Höhna et al., 2016; Morlon, 2014), which may in turn be influenced by a number of factors including evolutionary constraint and niche availability (Losos et al., 1998; Mahler et al., 2010; Rabosky, 2017; Santini et al., 2013; Shi & Rabosky, 2015). Morphology may show similar patterns of asymmetry—wherein related clades can demonstrate high (Vidal-Garcia et al., 2014) or low levels of phenotypic diversity (Adams et al., 2009; Kozak et al., 2006). Understanding the processes underlying these patterns is particularly important when considering putative adaptive radiations (AR) where diversification is contingent on ecological opportunity (Schluter, 2000; Simpson, 1944). Region-specific ecological opportunity has been strongly linked to speciation, ecomorphological diversification, and the resilience of a taxon to extinction (Schluter, 2000). Access to open ecological niches can promote population isolation and divergence, allowing lineages to expand ecological and morphological envelops relative to the parent clade. The acquisition of novel traits that permit the exploitation of new resources has also been linked to increasing species diversity, though testing these “key innovations” remains problematic (Rabosky, 2017).
In classic adaptive radiation theory, trait diversification is typically thought to evolve in concert with speciation and the tempos of both processes can be dictated by ecological opportunity (Ashman et al., 2018; Burbrink & Pyron, 2010; Harmon et al., 2003; Pyron & Burbrink, 2012; Rabosky et al., 2013). The colonization of novel regions or the evolution of traits that permit the exploration of novel adaptive zones have been invoked to explain ecological opportunity and adaptive radiation (Simpson, 1944). Island systems, for example, present unique opportunities to examine how lineages respond to ecological opportunity. Ecological opportunity on islands depauperate in predators and competitors can lead to speciose clades occupying a wide range of niches beyond those used by mainland relatives (Burbrink et al., 2019; Garcia-Porta et al., 2016; Losos et al., 1998; Losos, 2010; Mahler et al., 2010). While adaptive radiation theory predicts shifts in speciation and phenotypic diversification rates following the invasion of novel ecological or geographic space, empirical studies demonstrate that these patterns are very complex and somewhat idiosyncratic. Some insular taxa, such as Greater Antillean Anolis lizards, have been shown to exhibit increased speciation rates after island colonization and a positive relationship between speciation rate and island area (Rabosky & Glor, 2010). However, this same clade of lizards fails to show increased rates of speciation and phenotypic diversification relative to their mainland relatives (Burress & Muñoz, 2022).
Australia and nearby islands present an opportunity to examine and compare patterns of diversification due to their isolation, and the presence of diverse, endemic radiations across which patterns of diversity can be contrasted (Esquerré et al., 2020; García-Navas et al., 2018; Skipwith et al., 2019). Squamates are one of the most diverse components of the Australasian vertebrate fauna, composed primarily of relatively young (post-Eocene) radiations (Oliver & Hugall, 2017), and have featured prominently in studies of macroevolutionary dynamics and processes (Brennan et al., 2020; Esquerré et al., 2020; Skipwith et al., 2016). Some mainland Australian taxa fail to show patterns as would be predicted by classic adaptive radiation theory where shifts in speciation and phenotypic diversification occur in open ecological space (Lee et al., 2016). Though, recent studies find varying levels of support for intimate links between these two processes across multiple characters (Ashman et al., 2018; Esquerré et al., 2019). This highlights the value of examining and contrasting further empirical systems to determine when and if ecological opportunity does in fact result in shifts in speciation rate, if phenotypic diversification experiences correlated heterogeneity, and if rate heterogeneity in trait diversification is limited to a single axis or across multiple axes.
In this study, we use the diplodactyloid geckos of Australasia to investigate how insular colonization and ecological opportunity have influenced speciation dynamics and phenotypic diversification. This is a morphologically diverse and moderately speciose lineage (~232 species, 39 genera) comprised of three families: the Diplodactylidae (~154 species, 25 genera), Carphodactylidae (~32 species, 7 genera), and the Pygopodidae (~46 species, 7 genera) (Figure 1). The phylogenetic and species diversity of this radiation is concentrated in Australia, however diplodactylids have also colonized New Caledonia and New Zealand via over-water dispersal during the Cenozoic (Nielsen et al., 2011; Skipwith et al., 2016, 2019). Both species of the pygopodid genus Lialis colonized New Guinea during the Neogene, but only one (L. jicari) is endemic (Skipwith et al., 2019). While diplodactyloids are restricted to these four regions and account for less than 12% of gekkotan (geckos) species diversity, they show ecomorphological diversity that far exceeds that seen elsewhere within Gekkota (Garcia-Porta & Ord, 2013; Oliver & Sanders, 2009; Skipwith et al., 2019). Most striking are the near-limbless pygopodids which have diversified into terrestrial, semi-arboreal and semi-fossorial forms (Jennings et al., 2003). Carphodactylids and diplodactylids are fully limbed and the majority are scansorial to some degree, although lineages in both families have transitioned to completely terrestrial ecologies. In diplodactylids, this transition is typically accompanied by the loss of the adhesive digital scansors (toepads) characteristic of geckos. Diplodactyloids span an enormous range of body sizes (35–280 mm snout-vent length (SVL) for limbed species and 75–311 mm SVL for the limb-reduced pygopodids) and include the largest living and extinct species of gecko known (Bauer, 1990; Cogger, 2014; Garcia-Porta & Ord, 2013).
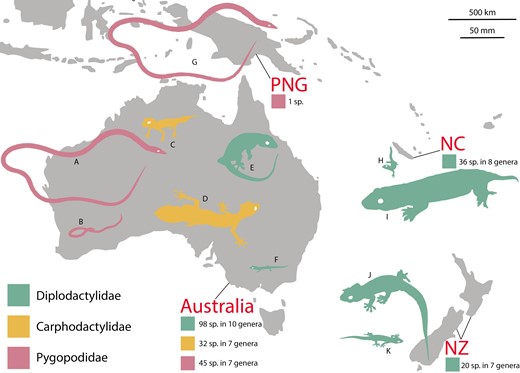
Map of Australasia highlighting the distribution and species richness of diplodactyloids. PNG = Papua New Guinea, NC = New Caledonia, and NZ = New Zealand. Colored silhouettes represent the largest and smallest representatives of each family for each of the four labeled geographic regions. All silhouettes are to scale. (A) Pygopodidae: Lialis burtonis, (B) Pygopodidae: Delma haroldi, (C) Carphodactylidae: Uvidicolus sphyrurus, (D) Carphodactylidae: Saltuarius cornutus, (E) Diplodactylidae: Pseudothecadactylus australis, (F) Diplodactylidae: Crenadactylus sp., (G) Pygopodidae: Lialis jicari, (H) Diplodactylidae: Dierogekko sp., (I) Diplodactylidae: Rhacodactylus leachianus, (J) Diplodactylidae: Hoplodactylus duvaucelii, and (K) Diplodactylidae: Naultinus manukanus.
Ecological opportunity has been predicted to mediate significant shifts in diversification in New Caledonian and New Zealand diplodactyloids, as these radiations include morphologically divergent genera which partition habitats due to high levels of sympatry (Bauer & Sadlier, 2000; Nielsen et al., 2011) and show independent evolution of gigantism, viviparity, and diurnality (Nielsen et al., 2011; Skipwith et al., 2016, 2019). Accordingly, several previous studies have investigated key aspects of diplodactyloid macroevolutionary dynamics. Garcia-Porta and Ord (2013) suggested that speciation rates for the two insular clades were non-linear and fit with what would be expected for adaptive radiations after the colonization of novel regions. Skipwith et al. (2016) found that speciation rates in New Caledonia have decreased toward the present, presumably as ecological space saturated following a pattern of diversity dependence. Brennan and Oliver (2017) found that the mainland Australian diplodactyloids exhibited homogenous rates of speciation across clades despite major climatic changes during the Cenozoic. This study also found support for mass extinction and subsequent turnover during the Eocene-Oligocene boundary (EOb). Furthermore, Garcia-Porta and Ord (2013) proposed that the rate of body size evolution for these island radiations was higher than the background rate for the Diplodactyloidea.
These previous studies did not utilize a genomic-scale phylogenetic framework and included phenotypic analyses focused solely on body size. Studies focusing on lizard taxa such as Anolis that include multiple trait axes illustrate that additional data can reveal complex patterns of trait diversification and stabilizing selection (Burress & Muñoz, 2022; Mahler et al., 2010). Indeed, patterns of ecomorphological evolution in traits other than body size have generally been little studied in lizards with the exception of Anolis (Ashman et al., 2018; Garcia-Porta et al., 2016). Here, we build on these previous studies and investigate how diplodactyloid geckos fit within adaptive radiation theory using a phylogenomic data set consisting of 4,268 ultraconserved element (UCE) loci and 180 described species, accounting for roughly 75% of the described diversity (Skipwith et al., 2019) alongside a phenotypic dataset including body size and 15 ecomorphologically relevant traits.
Several factors can result in mainland and insular radiations differing in rates of diversification such as clade age, niche availability, and island area. For instance, an insular radiation may display higher rates than an ancestral mainland lineage in the face of open niches. Conversely, the opposite may be true if a continental radiation has comparatively more open niches or land area in which to diversify. With this in mind, we test if the two insular diplodactyloid lineages do in fact display higher rates of diversification over the background for diplodactyloids. Additionally, we test if all traits fit under the same diversification regime and if mainland and insular taxa differ in morphological disparity. We predict that these young insular radiations will differ in speciation dynamics from their mainland relatives, speciation and trait diversification are intimately correlated, and that clades displaying phenotypic rate heterogeneity will do so across multiple traits. However, the recent literature is abound with the numerous caveats of estimating diversification patterns from extant-only trees. Simulations have made it clear that these phylogenies contain little information in terms of historical dynamics and that extinction cannot be accurately estimated in most cases (Quental & Marshall, 2011). Further, an infinite array of diversification scenarios may lie within the same tree and birth-death models are incapable of distinguishing diversity-independent time-varying processes and true diversity dependence (Helmstetter et al., 2021; Louca & Pennell, 2019). Lastly, the Diplodactyloidea is a relatively ancient radiation dating back to the late Cretaceous (Campanian, ~75 mya) and signals of early bursts in trait evolution may have been eroded by subsequent patterns of extinction. Recognizing these issues, we address the questions outlined above by focusing on heterogeneity in speciation rates and trait diversification while relying on relative magnitudes rather than absolute estimates.
Methods
Taxon sampling
For all molecular analyses, we sampled 290 individuals representing 172 of the 232 currently recognized diplodactyloid species and all genera with the exception of the pygopodid Ophidiocephalus as well as 10 gekkonoid outgroups. All phylogenetic estimates were rooted with Anolis carolinensis UCEs from GenBank (Skipwith et al., 2019). An additional nine undescribed candidate species of diplodactylid were included in this dataset. These include five candidate lineages of Oedura (Oliver et al., 2014; Oliver & Doughty, 2016; Skipwith et al., 2019), two New Zealand diplodactylids (Nielsen et al. 2011), and two New Caledonian diplodactylids (Skipwith et al., 2016). See Supplementary Table S1 for the list of sequenced individuals. Our ecomorphological dataset included 148 species for all traits and phylogenies were pruned for trait analyses beyond publicly available maximum body size data using the R package Geiger (Harmon et al., 2008).
Phylogenetic inference
We used the time-calibrated phylogenomic tree inferred from 4,268 UCEs from Skipwith et al. (2019) to estimate the phylogenetic relationships of 180 species of diplodactyloid gecko. All molecular methods, bioinformatics, details on data processing, and phylogenetic methods are described in Skipwith et al. (2019) and final cleaned in-target assembled fasta files are available on the Mendeley Data Platform (doi:10.17632/zstmhjfkw5.1). For all phylogenetic comparative analyses, the topology of the multispecies coalescent tree from ASTRAL II was used to constrain our phylogenetic divergence dating estimates using MCMCtree in paml (Mirarab & Warnow, 2015; Yang, 2007). Skipwith et al. (2019) implemented a secondary constraint to calibrate the split between Anolis and Gekkota, a secondary calibration for the gekkonoid-diplodactyloid (crown Gekkota) split, and three fossil calibrations for crown gekkotans. We were unable to account for phylogenetic uncertainty as MCMCtree uses a single topology to estimate divergence times.
Lineage diversification dynamics and rate heterogeneity
We used several complementary birth-death models to test (a) the overall diversification trajectories of diplodactyloids and (b) determine if clade-specific rate heterogeneity was present in speciation. Given the intractability of estimating extinction from phylogenies of extant species alone, we refrain from relying heavily on estimates of net diversification (net diversification r = speciation λ– extinction μ) or extinction and, where possible, focus on speciation alone (Louca & Pennell, 2019; Rabosky et al., 2007). Using simulations, Louca and Pennell (2019) demonstrated that birth-death diversification models using lineage-through time (LTT) plots can yield an infinite population of scenarios (congruence classes) that cannot be distinguished, specifically in regards to estimating specific speciation and extinction rates from trees composed of living taxa only. In the case of heterogeneous diversification, this is problematic as independent shifts in λ and μ can yield identical r. A feature that is exacerbated by the nature of extant-only trees where diversity is, by definition, increasing toward the present as extinction events in the past have not been sampled and living taxa have not had enough time to go extinct. Thus, we first test if diversification is heterogeneous across all diplodactyloids using the LTT-based pulled-diversification rate (PDR) and pulled-speciation (PSR) likelihood framework first described in Louca et al. (2018). The PDR (rp) is not directly comparable to r, being modified by the relative rate of change in speciation rate though time, resulting in PDR lagging behind the true diversification rate:
where τ is time.
The PDR and PSR of diplodactylids was estimated using the fit_hbd_pdr_on_grid and fit_hbd_psr_on_grid functions in the R package Castor (Louca et al., 2018). The age grid was set with a range of 200 my in order to capture a reasonable number of sampling points across the depth of the diplodactyloid tree. PDR and PSR analysis were run for 10 trials with 100 bootstrap replicates.
While accurate estimates of λ and μ cannot be recovered by most LTT-based birth-death models, shifts in their relative magnitudes through time can be estimated somewhat accurately (Helmstetter et al., 2021). As we were initially concerned with how diplodactyloid clades differed in speciation trajectories, a Bayesian Analysis of Macroevolutionary Mixtures (bamm) (Rabosky, 2014) speciation-extinction analysis was used to estimate clade-specific rate heterogeneity in speciation rate. We tested prior sensitivity by running BAMM analyses with the expectedNumberOfShifts prior set to the default of 1 and then again at 2. Each BAMM speciation-extinction and trait analysis was run twice. Additional details on BAMM analyses are provided in the Supplementary Materials.
To BAMM, we used the spectR function in RPANDA to identify potential diversification rate shifts within the diplodactyloid tree by summarizing its shape using the spectral density (Lewitus & Morlon, 2016; Morlon et al., 2016). Lastly, we used the recently developed Bayesian program ClaDS in RPANDA (Maliet et al., 2019). Unlike BAMM and the spectR function, the ClaDS algorithm quantifies branch-specific shifts in speciation rate rather than shifts subtending nodes, facilitating the identification of numerous low-magnitude shifts that would otherwise remain hidden. We then tested significant differences in branch-specific speciation rates from the fit_ClaDS function using an ANOVA in R (stats package) for the whole diplodactyloid clade, Carphodactylidae, Pygopodidae, Diplodactylidae, New Caledonian diplodactylids, New Zealand diplodactylids, and core Australian diplodactylids. The Australian diplodactylid fauna is paraphyletic, so we define the core Australian diplodactylids as all Australian genera excluding Pseudothecadactylus and Crenadactylus (i.e., Amalosia, Nebulifera, Hesperoedura, Oedura, Rhynchoedura, Lucasium, Diplodactylus, and Strophrurus).
Several algorithms have been developed that permit testing for the presence of trait-dependent diversification (Beaulieu & O’Meara, 2016; Caetano et al., 2018). We implemented BiSSE-like likelihood methods to accommodate both trait-dependent and trait-independent diversification models that incorporate hidden, unsampled states driving diversification in the R package HiSSE (Beaulieu & O’Meara, 2016; Caetano et al., 2018). We first tested trait-independent diversification with the Missing State Speciation and Extinction (MiSSE) suite of functions where there is no specific sampled trait assumed to impact speciation. Rather, there is some parameter trait or a combination of environmental factors that presumably influences rates. Model structure in MiSSE is very flexible with numerous possible combinations for net turnover (τ = λ + μ) and extinction fraction (ε = μ/λ) parameters. Given the range of parameter combinations possible, we opted to use the MiSSEGreedy function to automate parameter choice across various model structures. We ran this analysis with fixed extinction fractions set to 0 and 0.9 across combinations. Parameter estimates were summarized with the function GetModelAveRates. Significant differences in node estimates of λ, μ, τ, and ε for different diplodactylid clades were then tested with an ANOVA. We proceeded to explicitly test trait-dependence in a geographic framework using Hidden Geographic State Speciation and Extinction (GeoHiSSE) where diversification parameters are estimated for individual regions (Caetano et al., 2018). Here, we assessed if island colonization and presumably ecological opportunity impacted diversification dynamics. Australia was treated as endemic area 1 (state: 00), whereas New Caledonia and New Zealand were treated as endemic area 2 (state: 11). Five area-independent (CID) and area-dependent cladogenetic models were assessed, specifically: area-independent diversification and no hidden states (CID-original GeoSSE), range-dependent diversification and no hidden states (original GeoSSE), area-independent diversification with three hidden rate classes (CID-GeoHiSSE-3hs), area-dependent diversification with two rate classes (GeoHiSSE-full), and area-independent diversification with five hidden rate classes (CID-GeoHiSSE). We direct the reader to Caetano et al. (2018) for details on these specific models (see Table 1 in Caetano et al., 2018). We further assessed if rate heterogeneity was present when considering each of the insular radiations alone. Thus, we reran GeoHiSSE twice where New Caledonia and New Zealand were individually treated as endemic area 1 while the remaining taxa were treated as endemic area 2 (i.e., NC vs. all others and NZ vs. all others). Model choice was assessed with AICw and model parameters were averaged. Statistical differences between mean λ and μ were determined for tip rates. While tips rates have been noted as poor estimators of net diversification, simulations have shown that they can accurately estimate speciation, particularly in studies focused on state-dependent diversification (Title & Rabosky, 2019).
Chang et al. (2019) noted that the implementation of global (spectral distances, CLaDS, MiSSE, and Castor) or clade/region-specific (BAMM and GeoHiSSE) sampling fractions to account for incomplete species sampling can lead to low statistical power and spurious diversification estimates. Thus, we used the stochastic polytomy resolving program TACT (Chang et al., 2019) to place 61 unsampled species into our 180 species UCE backbone phylogeny based on taxonomy and previous phylogenetic estimates (Brennan & Oliver, 2017; Nielsen et al., 2011; Skipwith et al., 2016; Uetz et al., 2017). We then reran all diversification analyses to assess how alternative methods for accounting incomplete sampling influenced estimates of diversification.
Ecomorphological data, continuous trait modeling, and phylogenetic correction
We measured body size (snout-vent length or SVL) and 15 ecomorphologically relevant traits for 148 diplodactyloid species, sampling all genera in our tree except for the pygopodid Pletholax, totaling 993 specimens from museum collections in the United States, Australia, and New Zealand. We attempted to measure at least five adult individuals for each species, however, several species are rare in museum collections and were often represented by a single specimen (mean = 6.3 individuals/species, range: 1–28 individuals/species). Of our 148 species with meristic data, 6 were represented by singletons. Adult males were targeted to standardize for sex based on external morphology (presence or absence of hemipenal bulges). However, 15% of species were only represented by females in the available collections or were impossible to sex based on external morphology as is the case in many pygopodids. Species only represented by females were kept in all downstream analyses as geckos, while females are typically larger, do not exhibit sexual dimorphism in trait proportions to the same extent as iguanian lizards such as Anolis (Mahler et al., 2010; Oliver et al., 2019). Traits related to prey acquisition and locomotion (i.e., head, limb, and toe traits) were measured with digital calipers and all measurements were collected by P. L. Skipwith. All measurements were taken on the left side unless that side was heavily deformed or otherwise damaged, in which case the right side was measured. All raw meristic data as well as detailed explanations of each measurement (see Supplementary Material) are available in Supplementary Table S2.
The measurements taken were the following: SVL from both published datasets (Meiri, 2008) and measurements taken in the present study, head length to retroarticular process (HLret), head width (HW), head depth (HD), trunk length (Trk), forearm length (Crus), tibia length (Tibia), internarial width (EN), nares-eye distance (NEYE), orbit diameter (EYE), eye-ear distance (EyeEar), interorbital distance (IE), fourth finger width (4FW), fourth finger length (4FL), fourth toe width (4TW), and fourth toe length (4TL) (see Supplementary Material for details). All comparative phylogenetic analyses used the species mean of each log-transformed trait, though we incorporated the mean standard error for all traits into macroevolutionary model testing. To correct for allometry, we used phylogenetic least squares (PGLS) regression in phytools under Brownian motion (Revell, 2009) on three modified datasets. These were the following: (a) all traits regressed against body size (SVL) using a pruned phylogeny of 129 species of limbed diplodactyloid (Diplodactylidae and Carphodactylidae), (b) all cranial traits (HW, HD, EN, EYE, and IE) regressed against HLret for all 148 species with meristic data, and (c) finger (4FW) and toe widths (4TW) regressed against their respective lengths (4FL and 4TL) for 129 species of limbed diplodactyloid. These additional regressions were performed to capture proportional variation in morphology of the head and digits that whole-body regression would miss. For instance, several rupicolous lineages possess skulls that are dorsoventrally flattened relative to their length and digits that lack adhesive scansor pads, resulting in narrow digits relative to their length. As some of these traits were likely not evolving under a single-rate Brownian motion process, we estimated the appropriate model of evolution for each trait using Akaike Information Criterion (AIC) and then AIC weights (AICw). We tested for single-rate Brownian motion (BM), single-peak Ornstein-Uhlenbeck (OU1), early-burst (EB), and lambda (λ). Model testing for continuous traits was done with the fitContinous function in Geiger (Harmon et al., 2008, 2010).
Phenotypic diversification and the role of biogeography in diversification dynamics
Diplodactyloids are morphologically diverse, hence we tested if rate heterogeneity was present for continuous trait evolution. We used maximum body size (Meiri, 2008) and the size-corrected residuals from the abovementioned phylogenetic regressions for all other traits in two separate phylogenetic principal component analyses (pPCA-limbed and pPCA-cranial): pPCA-limbed) combined crus, tibia, 4FL, and 4TL corrected for SVL with 4FW and 4TW corrected for their respective lengths (4FL and 4TL) for 129 species of limbed diplodactyloids; pPCA-cranial HLret corrected for SVL combined with all cranial traits (HW, HD, EN, NEYE, EYE, and IE) corrected for HLret for 148 species (all three families). We excluded SVL from these pPCAs as preliminary analyses demonstrated that SVL accounted for most of the variation in these data, a pattern consistent with most datasets composed of size-based metrics but at odds with our study’s focus on trait proportions. To determine if different diplodactyloid clades significantly differed in ecomorphology we fit linear models to these multivariate meristic data using generalized least squares (Clavel et al., 2015). Linear models were fit to the log-transformed aforementioned head-only dataset that included pygopodids and to the dataset that included limb traits under BM. A Hoteling-Lawley multivariate analysis of variance (MANOVA) with 1,000 permutations was used to test if diplodactyloids significantly differed in ecomorphology when taking into account biogeography (Australia, New Guinea, New Caledonia, and New Zealand) and clade (Carphodactylidae, Pygopodidae, Diplodactylidae, New Caledonian diplodactylids, New Zealand diplodactylids, and core Australian diplodactylids). Phylogenetic linear models and MANOVAs were estimated in the R package mvMORPH (Clavel et al., 2015).
A key component of our study focused on understanding if traits evolve in concert or idiosyncratically, regardless of the relationship between speciation dynamics and trait diversification. We therefore tested the extent of evolutionary integration amongst traits using the Bayesian R package Ratematrix (Caetano & Harmon, 2017). Ratematrix estimates both the evolutionary rates of individual traits under BM and the evolutionary correlation among traits. Prior densities were generated with the function makePrior under two regimes and the Ratematrix algorithm was run for 5,000,000 generations with default parameters, removing the first 25% as burnin. Trait evolutionary rates and correlations were jointly estimated for the mainland the insular lineages using a Markov model. All Ratematrix analyses were run three times and the resulting posteriors were combined while convergence was assessed through evaluation of parameter ESS values (≥200) and Gelman’s R (close to 1) (Caetano & Harmon, 2017; Gelman & Rubin, 1992). Contrasts of the strength of correlation and rates of trait evolution between mainland and insular lineages were inferred from summary statistics on the posterior distributions of the fitted matrices. When the proportion of overlap was less than 0.05, the posterior rate or correlation matrices for our two regimes (mainland and insular) did not significantly overlap. Only the raw, log-transformed linear measurements were used for all Ratematrix analyses, not size-corrected residuals or pPCA scores. Again, we used two trees, one with 129 species for limb and digit traits only, and one with 148 species for head traits only.
All analyses on morphological diversification used our taxonomically incomplete, but data supported UCE tree and not the complete tree from TACT with unsampled species included. While complete phylogenies from polytomy resolvers are useful in estimating speciation dynamics (Chang et al., 2019), Rabosky (2015) warned against their use in trait-based analyses as they are unable to account for phylogenetic signal in the traits of interest. We calculated morphological disparity through time (DTT) using the mean-squared Euclidean distance for a given trait between species using the R package Geiger (Harmon et al., 2003, 2008). DTT was estimated from the same pPCA scores mentioned above for each of the pruned trait datasets (pPCA-limbed and pPCA-cranial). The morphological disparity index (MDI) was independently estimated first for SVL and then the combined PC scores from the abovementioned pPCAs for the following lineages: all diplodactyloids, Carphodactylidae, Pygopodidae, Diplodactylidae, New Caledonian diplodactylids, New Zealand diplodactylids, and core Australian diplodactylids. Significant deviations from null distributions were determined with 10,000 simulations under BM. Negative MDI values fall within the expectations of trait diversification of adaptive radiations where there is an early burst of differentiation as niches are rapidly occupied (Harmon et al., 2003; Hipsley et al., 2014).
We then used BAMM to determine if the traits described above had experienced clade-specific shifts in diversification rate. Rather than the raw residuals, we opted to use the PC scores from the pPCAs as these values were now functionally independent of one another. We recognize that recent concerns have been raised with model misspecification and bias in pPCA (Uyeda et al., 2015). In the absence of alternative phylogenetic methods for reducing the dimensionality of continuous data, we err on using pPCA over standard PCA as Uyeda et al. (2015) notes that failure to account for phylogeny is, in and of itself, model misspecification. The PC axes that cumulatively explained ~90% of the variance were kept from cranial and digit pPCAs. We ran four separate BAMM ‘trait’ runs with the same MCMC settings as the abovementioned ‘speciation extinction’ analyses for each of the individual PC scores. These included the full 180 species tree for maximum body size (raw, log-transformed SVL), a tree with 129 carphodactylids and diplodactylids (pygopodids removed due to limb loss) for all limb related traits as well as toepad dimensions (pPCA-limbed), and a reduced 148 species tree for head measurements (pPCA-cranial) with all three families. We further tested for rate heterogeneity in trait diversification for these same traits using an updated version of the likelihood-based traitMedusa model with the transformPhylo.ML function in the R package MOTMOT (Puttick et al., 2020). Again, we used the pPC scores from the same two pPCA analyses on cranial and limb-related traits. The traitMedusa model iteratively tests individual nodes for shifts in the rate of trait diversification, selecting the rate regime that results in the greatest increase in likelihood. Alternative rate shift models were tested using corrected AIC (AICc). To account for the high type-I error of AIC-based automatic rate-shift detection methods (May & Moore, 2016; Thomas & Freckleton, 2012), we used the calcCutOff function in MOTMOT to calculate the appropriate AICc threshold to reduce the error to 0.05. A null distribution of trait data was simulated under BM on the relevant tree (all 180 species for SVL, 148 species for cranial dimensions, and 129 species for limb traits) for 1,000 iterations.
We additionally tested for trait dependent diversification for the abovementioned traits using the STRAPP function in BAMMtools (Rabosky & Huang, 2016). Here, diversification rates along the tree are estimated independently of the traits in question. We additionaly tested trait dependent diversification with the semi-parametric, simulation-based method ES-sim for each of the pPC scores (Harvey & Rabosky, 2018).
Results
Diversification dynamics and rate heterogeneity
While all diversification analyses were run on both the taxonomically incomplete and complete trees (TACT), we report estimates derived from the TACT tree unless otherwise noted as the two produced similar results in virtually all of the following analyses. Pulled diversification (PDR) and pulled speciation rates (PSR) estimated from both the incomplete UCE tree and the complete TACT tree reveal heterogenous patterns across the whole diplodactyloid tree. Estimates suggest relative stability in PDR from the crown (~75 mya) to around the mid-Eocene (~40 mya) with several, low magnitude gradual decreases followed by similarly low magnitude rapid increases. A series of rapid increases were detected from the mid-Eocene to mid-Oligocene which seem contemporaneous with the crown radiations of the Australian carphodactylids, Pygopodids, and core Australian diplodactylids. Two additional very large jumps in PDR were detected in the Neogene. The first, occurring during the early Miocene, corresponds to the emergence of many of the modern diplodactyloid genera and the crown radiation of New Caledonian diplodactylids (Figure 2A and B). The second occurred around the early Pliocene, potentially indicative of the most recent speciation events leading to extant diversity that has not yet experienced pruning from extinction.
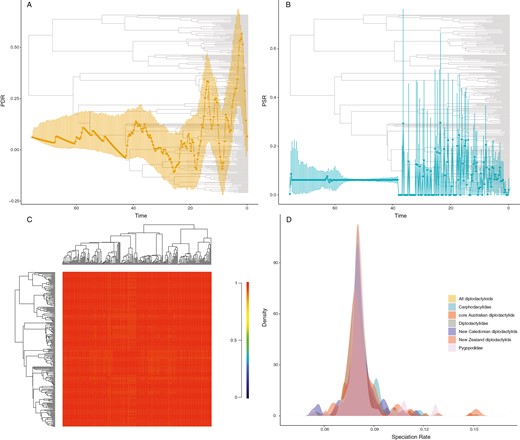
Plots of diversification dynamics from macroevolutionary analyses. All results shown for the taxonomically complete TACT tree which is shown in the backgrounds of A and B. (A) Pulled-diversification rate (PDR) through time from CASTOR. Dots and dark line are mean estimates of fitted PDR and error bars are 95% credibility intervals from 1,000 bootstrap replicates. (B) PSR through time from CASTOR. Dots and dark line are mean estimates of fitted PSR and error bars are 95% credibility intervals from 1,000 bootstrap replicates. (C) Macroevolutionary cohort analysis of pairwise rate regimes from the speciation and extinction analysis in BAMM. (D) Speciation rate distributions estimated by ClaDS demonstrating unexceptional rates shifts for diplodactyloid families and subclades (ANOVA: DF = 6, F = 0.73, p = .62).
All of our analyses testing intraclade heterogeneity found overwhelming signatures of homogeneity in speciation rate across the diplodactyloid tree (Figure 2C and D). Thus, details regarding the findings of BAMM, spectral density in RPANDA, and ClaDS are available in the Supplementary Material. Further, prior choice of the number of shifts in BAMM (1 or 2) yielded identical estimates of r, λ, and μ, so we only report the results of the single expected shift prior. Lastly, the abovementioned analyses yielded identical results for the incomplete UCE tree and complete TACT tree, so only the TACT estimates are provided (Table 1). Trait independent diversification analysis with MiSSEGreedy yielded the only analyses where the TACT tree differed from data-driven UCE tree in model selection using AICw. Both The 180 tip UCE tree and 241 tip TACT tree were best fit by a model with 2 hidden states and a fixed ε of 0. The resulting patterns of diversification across the two trees differed significantly where the incomplete UCE tree found that the insular lineages displayed significantly higher rates of speciation than the other lineages (Table 2, Supplementary Figure 1). In contrast, the TACT tree strongly favored rate homogeneity across the entire thee. All three GeoHISSE analyses selected the null CID-original GeoSSE model (range-independent diversification and no hidden states) with model averaging inferring homogenous diversification (Table 2 and Supplementary Table S3).
Mean model parameters for BAMM and ClaDS for all diplodactyloids and minor clades.
| Diplodactyloidea | Carphodactylidae | Pygopodidae | Diplodactylidae | New Caledonia | New Zealand | core Australia | ||
|---|---|---|---|---|---|---|---|---|
| BAMM | λ | 0.07 | 0.07 | 0.07 | 0.07 | 0.07 | 0.07 | 0.07 |
| μ | <0.01 | <0.01 | <0.01 | <0.01 | <0.01 | <0.01 | <0.01 | |
| ClaDS | λ | 0.06 | 0.06 | 0.06 | 0.07 | 0.07 | 0.07 | 0.07 |
Note. λ = speciation rate, μ = extinction rate, and k = species carrying capacity. Estimates are for the taxonomically complete TACT tree only.
Diversification estimates from GeoHiSSE and MiSSE.
| Turnover | Net Diversification | Speciation | Extinction Fraction | Extinction | |
|---|---|---|---|---|---|
| GeoHISSE | |||||
| Islands vs. Mainland | 0.57 | 0.35 | 0.35 | 0.63 | 0.22 |
| NC vs. Mainland + NZ | 0.68 | 0.4 | 0.4 | 0.68 | 0.27 |
| NZ vs. Mainland + NC | 0.67 | 0.4 | 0.4 | 0.68 | 0.27 |
| MiSSE (180 tip UCE tree) | |||||
| Carphodactylidae | 0.06 | 0.06 | 0.06 | 0.2 | 1e−3 |
| Pygopodidae | 0.06 | 0.06 | 0.06 | 0.2 | 1e−3 |
| New Caledonia | 0.07 | 0.07 | 0.07 | 0.15 | 1e−3 |
| New Zealand | 0.07 | 0.07 | 0.07 | 0.16 | 1e−3 |
| Core Australia Diplodactylidae | 0.06 | 0.06 | 0.06 | 0.19 | 1e−3 |
| MiSSE (241 tip TACT tree) | |||||
| Carphodactylidae | 0.7 | 0.7 | 0.7 | 0.16 | 1e−2 |
| Pygopodidae | 0.7 | 0.7 | 0.7 | 0.16 | 1e−2 |
| New Caledonia | 0.7 | 0.7 | 0.7 | 0.14 | 9e−3 |
| New Zealand | 0.7 | 0.7 | 0.7 | 0.14 | 9e−3 |
| Core Australia Diplodactylidae | 0.7 | 0.7 | 0.7 | 0.16 | 1e−2 |
Ecomorphological data, continuous trait modeling, and phylogenetic correction
Using AIC weights, all but three traits were found to be best fit by a single-rate Brownian motion model. Head depth (HD), trunk length (Trk), and intereye distance (IE) were found to by best fit by a single-peak OU process. In the first pPCA (pPCA-limbed) of 129 species of carphodactylid and diplodactylid (pygopodids excluded), variance was mostly explained by relative toepad width (PC1), finger length (PC2), and forearm length (PCs 3 and 4). See Supplementary Table S4 for pPCA loadings and variance explained. Differences in relative toepad width were most extreme in the New Caledonian genera, Australian Pseudothecadactylus, and the core Australian diplodactylid genera Strophurus and Oedura where pads were substantially wider than other diplodactylids. Further, carphodactylids, particularly the terrestrial Nephrurus group, typically had longer forearms relative to SVL than diplodactylids (Supplementary Figure 2). In the 148 species pPCA on cranial dimensions (pPCA-cranial), pygopodids were strongly differentiated from carphodactylids and diplodactylids by their shorter heads relative to body size. However, individual PCs from pPCA-cranial were correlated as variance was explained by HLret (PC1 and PC2) and EN/ HLret (PC3 and PC4) (see Table 3 for variance explained). Diplodactylids specializing on small and numerous prey items like termites (Diplodactylus conspiciliatus, D. pulcher, and Rhynchoedura) were differentiated from other limbed forms in having relatively smaller heads with short narrow “pinched” snouts. Our tests of significant differences in morphospace occupation with mvMORPH found no significant differences when taking into account biogeography (all species for head: T2 = 0.17, p = .06; limbs only = T2 = 0.39, p = .19) or individual clades (all species for head: T2 = 0.42, p = .09; limbs only = T2 = 0.89, p = .42).
MDI for each clade of diplodactyloid with p-values from 1,000 simulations under BM.
| Diplodactyloidea | Carphodactylidae | Pygopodidae | Diplodactylidae | New Caledonia | New Zealand | core Australia | |||
|---|---|---|---|---|---|---|---|---|---|
| SVL | MDI | −0.03 | 0.1 | −0.27 | 0.03 | −0.27 | 1.32 | −0.14 | |
| p | .88 | .79 | .18 | .87 | .03 | 1.0 | .46 | ||
| Head only | PC1 | MDI | −0.18 | 0.16 | −0.21 | 0.03 | −0.13 | 1.39 | −0.17 |
| (pPCA-cranial) | (53.9%) | p | .63 | .83 | .16 | .81 | .21 | 1.0 | .32 |
| PC2 | MDI | 0.29 | −0.31 | −0.11 | 0.02 | 0.17 | 0.04 | 0.24 | |
| (18.5%) | p | .98 | .17 | .58 | .89 | .69 | .67 | .88 | |
| PC3 | MDI | 0.16 | 0.37 | 0.77 | 0.31 | 0.02 | 0.18 | 0.27 | |
| (12.1%) | p | .96 | .96 | 1.0 | .98 | .67 | .94 | .88 | |
| PC4 | MDI | 0.41 | −0.26 | 0.52 | 0.77 | 0.26 | −0.03 | 0.12 | |
| (10.4%) | p | .99 | .31 | .95 | 1.0 | .93 | .67 | .82 | |
| Limbed only (pPCA-limbed) | PC1 | MDI | −0.05 | −0.29 | — | −0.13 | −0.06 | 0.09 | −0.19 |
| (30.2%) | p | .79 | .09 | — | .56 | .33 | .83 | .32 | |
| PC2 | MDI | −0.05 | −0.09 | — | 0.04 | −0.11 | 0.09 | 0.02 | |
| (27.9%) | p | .84 | .69 | — | .87 | .18 | .83 | .52 | |
| PC3 | MDI | 0.03 | 0.21 | — | 0.29 | −0.14 | 0.59 | 0.05 | |
| (17.8%) | p | .91 | .91 | — | .98 | .96 | 1.0 | .76 | |
| PC4 | MDI | −0.16 | −0.02 | — | −0.01 | 0.44 | 0.73 | −0.03 | |
| (11.4%) | p | .72 | .69 | — | .85 | .78 | 1.0 | .48 |
Note. Bold p-values indicate significance. Estimates are for the data driven UCE tree only.
MDI = Mean disparity indices; PC = principal components; SVL = snout-vent length.
Tests of integration between traits indicated that most pairwise comparisons between traits were positively correlated (see Supplementary Table S5 for mean pairwise estimates of correlation where differences were found). When examining the percent overlap of covariance matrix posterior distributions, we found that the posterior distributions of mainland and insular diplodactyloids did not overlap for several trait pairs. Insular limbed diplodactyloids were found to display stronger positive correlation for HLret - Crus (overlap = 4%: insular = 1.0, mainland = −0.01) as well as Crus - Tibia (overlap = 3%: insular = 0.07, mainland = 1.0) than mainland limbed forms. In integration tests of head alone for all three families revealed that insular forms displayed very strong negative correlations for HLret – EYE (overlap = 0%: insular = −0.6, mainland = 0.9) and HLret – EN (overlap = 0%: insular = −0.6, mainland = 0.9).
Phenotypic diversification and the role of biogeography in diversification dynamics
Analysis of DTT yielded complex patterns of trait evolution that were both clade and trait specific. When examining body size (SVL) alone, we recovered signatures of early burst differentiation with negative MDI statistics for all diplodactyloids, pygopodids, New Caledonian diplodactylids, and the core Australian diplodactylids. Conversely, positive MDI values were found for carphodactylids and the New Zealand diplodactylids (Table 2). However, only the New Caledonian clade showed a significant deviation from the null distribution for SVL (p = .03). Identical patterns of positive and negative MDI estimates were recovered when assessing pPCA scores of other traits in the abovementioned clades, but none were found to deviate significantly from the null distribution (Table 2).
BAMM yielded strong evidence for rate heterogeneity in trait evolution for body size, relative toepad width, and relative forearm length (Figure 3). All BAMM trait analyses received ESS values greater than 500. The rate of body size evolution was found to have shifted twice across the tree, once along the New Zealand Hoplodactylus duvaucelii – Woodworthia maculata branch and again on the New Caledonian Correlophus – Rhacodactylus and Paniegekko – Bavayia branch (Figure 4A). Both clades demonstrate a greater than three-fold increase in the rate of body size evolution (βx̄ = 3.7e−3 ± 2.3e−3 and 2.1e−3 ± 8.8e−4, respectively) over the background rate of diplodactyloids (βx̄ = 5.9e−4 ± 8.7e−5). Two additional rate shifts were detected from the pPCA of limbed taxa only (Figure 4A). The first (pPCA-limbed: PC1 fourth toe width) suggests that the Australian genus Oedura experienced decreased rates (βx̄ = 2.2e−4 ± 1.6e−4) of diversification for the relative width of the fourth toe, being substantially lower than the background rate for diplodactyloids (βx̄ = 5.3e−4 ± 8.4e−5; Figure 4B). The second shift found for the limbed only tree was detected for forearm length (pPCA-limbed: PC3), where the miniaturized New Caledonian genus Dierogekko (βx̄ = 5.5e−4 ± 2.5e−4) had much higher rates than the background rate (βx̄ = 9.1e−5 ± 1.4e−5; Figure 4C). Analysis of trait-specific diversification rates with the traitMedusa model in MOTMOT failed to find signatures of rate heterogeneity for any of the examined traits. We found no signature of rate shifts in the diversification of relative head dimensions or hind limb length with BAMM. Trait dependent speciation analyses with STRAPP and ES-sim found no significant correlation between speciation rates and trait diversification for any of the traits examined (Table 4).
Tests of correlations between speciation rate and rates trait diversification using STRAPP and ES-SIM.
| STRAPP | ES-SIM | |||
|---|---|---|---|---|
| R | p | ρ (rho) | p | |
| SVL | 0.06 | .51 | −0.09 | .55 |
| pPCA-cranial | ||||
| PC1 | −0.01 | .91 | −0.02 | .90 |
| PC2 | −0.01 | .93 | 0.12 | .53 |
| PC3 | 0.01 | .94 | 0.13 | .46 |
| PC4 | 0.01 | .93 | −0.12 | .51 |
| pPCA-limbed | ||||
| PC1 | −0.31 | .73 | 0.05 | .83 |
| PC2 | 0.12 | .81 | 0.15 | .50 |
| PC3 | −0.15 | .61 | −0.24 | .19 |
| PC4 | −0.06 | .90 | −0.28 | .14 |
Note. MDI = Mean disparity indices; PC = principal components; SVL = snout-vent length.
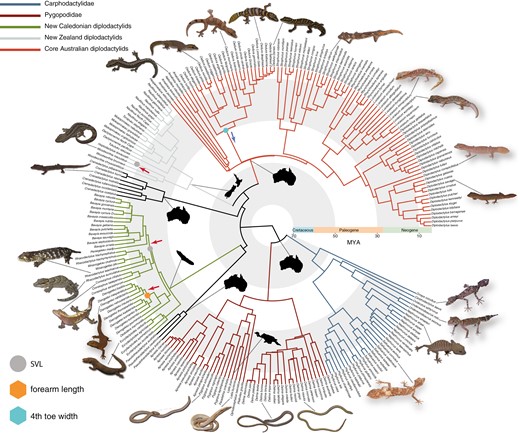
Time calibrated phylogeny of 241 species of diplodactyloid from TACT with rate shifts mapped onto nodes. Trait-based analyses were not conducted on the complete TACT tree but from the 4,268 ultraconserved locus tree (see Methods). For simplicity results from BAMM trait analyses are mapped onto a single tree, highlighting the three traits found to exhibit rate heterogeneity. Red arrows along branches indicate increases to trait diversification (β) while blue arrows indicate decreases relative to the background rate. All gecko images were taken by PLS and PMO. Note: SVL rate shifts were recovered for the full 180 species tree while the other two trait shifts were detected using the 128 species limbed-only tree. SVL = snout-vent length.
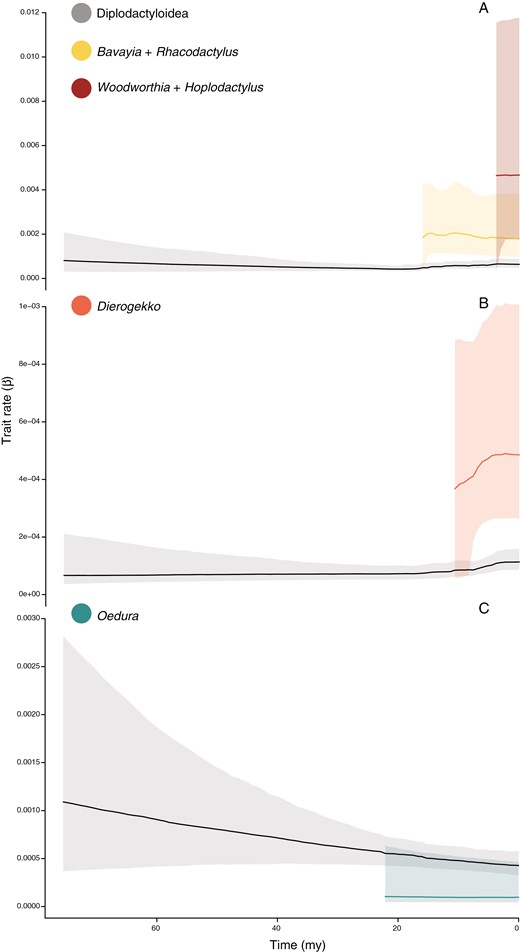
Rates of trait diversification inferred from BAMM for the tree traits found to exhibit rate shifts. (A) SVL (180 species tree), (B) relative forearm length (128 species limbed-only tree), (C) relative fourth toepad width (128 species limbed-only tree). Solid line is mean rate of trait diversification (β) while the opaque border represents 95% credibility interval from the posterior. SVL = snout-vent length.
Discussion
This study sought to test whether insular diplodactyloids demonstrated exceptional and/or correlated shifts in the tempos of speciation and trait diversification in the face of open ecological space. Using a combination of phylogenomics and phenotypic data, we show that ecological opportunity may not necessarily impact the tempo of cladogenesis and the inclusion of multiple traits suggests that lineages diverge phenotypically along multiple axes that are largely decoupled from speciation. This is supported analytically through multiple birth-death analyses finding that speciation rate is homogenous across the diplodactyloid tree and that shifts in trait diversification are both trait and clade-specific, not wholesale. Further, we find that that both the strength and direction of correlation among traits is indeed related to biogeography in these geckos. These findings suggest that even in radiations that are outwardly species rich and phenotypically diverse—lineage-specific responses to ecological opportunity are complex and that speciation dynamics and phenotypic diversification may not strictly follow the expectations of AR theory (Schluter, 2000; Simpson, 1944).
Lineage diversification in diplodactyloids
Our study challenges the expectation that continental endemics and insular colonists would differ in macroevolutionary diversification trajectories (Garcia-Porta & Ord, 2013). Our trait independent analyses on diversification found strong evidence for rate homogeneity in speciation rates across diplodactyloids. We note that there is little information content in molecular phylogenies in terms of underlying diversification processes and that numerous patterns can lead to signatures of decline in diversification rate (Louca & Pennell, 2019; Quental & Marshall, 2010, 2011; Rabosky, 2010, 2016). Further, we do not argue that the absolute estimates of r, λ, and μ represent biological reality given the issues of relying on such approximations. Rather, we rely on the placement of shifts and their relative magnitudes as they can be used to make biologically meaningful inferences (Helmstetter et al., 2021).
While not explicitly testing diversity dependence or clade-specific rate heterogeneity, estimates of PDR and PSR with CASTOR support temporal rate heterogeneity across the entire tree. Most notable are intervals of decline followed by rapid upshifts in PDR and relatively stable PSR during the Paleogene. These patterns in PDR and PSR suggest that diversity was consistently low during this time period or that extinction played a major role in early diplodactyloid diversification. If the latter is true, it agrees with the findings of Brennan and Oliver (2017) and Oliver and Hugall (2017) who suggested that mass extinction and subsequent turnover impacted diplodactyloids and other Australian squamates during the Eocene-Oligocene boundary (EOb) due to cooling in the Southern Hemisphere. However, Skipwith et al. (2019), who used the same phylogeny used here and the same reversible-jump MCMC methods as Brennan and Oliver (2017), failed to find convincing evidence of mass extinction. Given these potentially conflicting signals, we are reticent about making any broad assumptions about extinction dynamics from pulled-diversification metrics, especially given the apparent difficulty in interpreting their results in a biologically meaningful manner (Helmstetter et al., 2021). Fossils predating the Holocene are desperately needed to improve diversification estimates for diplodactyloids, particularly when attempting to elucidate the relative importance of extinction.
Insular colonization and diversification dynamics
We had initially predicted that the insular lineages would have higher rates of speciation than their mainland counterparts. These two lineages are typically thought of as classic adaptive radiations evolving in isolation, a hypothesis supported by the short internal nodes of the New Caledonian clade and historical issues in resolving intergeneric relationships (Nielsen et al., 2011; Skipwith et al., 2016, 2019). However, tests of clade-specific rate heterogeneity using BAMM, spectral distances (RPANDA), and ClaDS failed to detect signatures of increased speciation in New Zealand and New Caledonia over the background rates of mainland taxa. Barring subfossil deposits from the Holocene and fragmentary material from the Miocene, the fossil record of insular diplodactyloids is largely lacking (Grant-Mackie et al., 2003; Lee et al., 2009). We assumed that the initial colonizers of these two Tasmantis archipelagos would have met little competition in the way of nocturnal lizards. This is almost certainly true in the case of New Zealand where the only other lizard lineage is composed of diurnal skinks and competition would be presumably very low. New Caledonian diplodactylids do share the island with several widespread Pacific gekkonid geckos; however, there is no evidence that these reached the island before the Neogene. Accounting for biogeography with GeoHiSSE provides additional statistical support that diversification rates are indeed homogenous and not tied to geographic region. The selection of the CID-original GeoSSE model suggests that diversification in diplodactyloids is unrelated to biogeography and that no biological aspect of any particular clade has played a role in the proliferation of lineages. Interestingly, analysis with MiSSE favored models with two hidden states for both the taxonomically incomplete UCE and complete TACT trees. This apparent contradiction suggests that while the GeoHiSSE family of models is robust in detecting area-dependent diversification if signals are present, they may be inadequate in inferring the impact of hidden states in the absence of area-dependence. While it is entirely feasible that our failure to find plausible links between range and diversification may reflect reality, this may also be an issue of the scope of our study. Our tree is relatively small and accurately teasing out simple diversification and state-dependent diversification processes is greatly impacted by tree size (Beaulieu & O’Meara, 2016; Gamisch, 2016). The question of whether insular geckos differ from mainland geckos may be best addressed at the scale of all gekkotans (~2,000+ species) and not just diplodactyloids (232 species).
As Caetano et al. (2018) note, hidden-states do not necessarily describe a particular trait that drives diversification but what may in fact be a range of factors that can drive diversification, be they intrinsic or extrinsic. We are reluctant on speculating what possible traits could best explain these hidden states from MiSSE as they could be anything ranging from some physiological process to some aspect of the environment. We found that MiSSE found conflicting signals of heterogeneity in speciation when comparing our UCE and TACT trees, with the former supporting higher rates in New Caledonia and New Zealand. Whatever these unobserved states may be, there is no obvious indication from the biology of the insular lineages that would suggest increased capacity to explore niche-space and facilitate reproductive isolation between diverging lineages relative to their mainland relatives. As adhesive digital scansors are widespread across diplodactyloids, both insular lineages are readily distinguished by the possession of adhesive caudal lamellae and independent acquisitions of viviparity. However, the former trait is also present in the Australian Pseudothecadactylus (sister taxon of the New Caledonian genera). All New Zealand diplodactylids are viviparous while this reproductive mode has only evolved in the Rhacodactylus trachyrhynchus clade in New Caledonia. Viviparity is recognized as an adaptation for low temperatures in squamates (Andrews, 2000; Esquerré et al., 2019), which is certainly true of New Zealand. However, it is unclear how or if climate drove the acquisition of viviparity in the Rhacodactylus trachyrhynchus clade in tropical New Caledonia. Nor is it apparent as to why it is not present in the entire New Caledonian radiation. Our MiSSE analysis on the incomplete UCE tree was the only diversification analysis that deviated from the consensus that speciation was homogenous across diplodactyloids, suggesting that the two insular radiations had much higher rates than the background. This discrepancy between taxonomically incomplete (UCE) and complete (TACT) trees for the same algorithm is almost certainly due to the limitations of using global sampling fractions to account for unsampled species. Chang et al. (2019) note that the implementation of sampling fractions has low power in detecting shifts and can lead to spurious estimates of diversification, observations that potentially explain our contradictory MiSSE analyses. This issue is likely exacerbated by the small size of the Diplodactyloidea, leading to erroneously significant test statistics (ANOVA) differentiating diversification patterns amongst landmasses. Given that all remaining birth-death analyses implemented here for inferring interclade heterogeneity or state-dependent diversification support rate homogeneity across the Diplodactyloidea, we rely solely on the diversification estimates from the TACT tree in the case of our MiSSE analyses.
Ecological opportunity and phenotypic diversification dynamics
We hypothesized that the two insular radiations would exhibit elevated rates of speciation and phenotypic diversification over the background rates of mainland diplodactyloids. However, we find that trait diversification is largely decoupled from speciation dynamics and idiosyncratic, with individual traits displaying seemingly uncorrelated diversification trajectories. As with net diversification, we note the potential for extinction to confound the estimation of phenotypic diversification, particularly the possibility that unsampled lineages may erode signals of early bursts in molecular phylogenies (Moen & Morlon, 2014). The existence of recently extinct undescribed diplodactyloid species and populations with unknown affinities from the Holocene of New Caledonia and New Zealand (Kennedy, 2011; Scarsbrook et al., 2021) supports the importance of including fossil data when possible. For example, fragmentary subfossils from New Zealand suggest that body size largely differentiated some of these subfossil taxa and that the range in body size was historically greater in some extant taxa (Scarsbrook et al., 2021). Unsampled extinct lineages with unique phenotypes would possibly impact estimates of both speciation and phenotypic diversification dynamics, illustrating that our estimates likely highlight a more general pattern of diversification heterogeneity.
Across the entire diplodactyloid radiation, and across multiple phenotypic traits, only the New Caledonian clade deviated significantly from the null distributions for morphological disparity, and only for body size (Table 3). Given the young age of this clade and the morphological diversity contained within, it is not surprising that it also falls closest to the theoretical expectations of an adaptive radiation in regards to ecological opportunity (Schluter, 2000). The New Caledonian Rhacodactylus-Bavayia and the New Zealand Woodworthia-Hoplodactylus clades were found to have much higher rates of body-size evolution. Both clades demonstrate rapid transitions from moderate body sizes (<80 mm SVL) to gigantism (>120 mm SVL) in the span of a few million years. Body size appears to be a primary axis of rapid diversification in lizards (Ashman et al., 2018; Brennan et al., 2020; Moritz et al., 2018; Reaney et al., 2018), and may be particularly pronounced in insular radiations. In New Caledonia the largest members of the Rhacodactylus clade (R. leachianus, R. trachyrhynchus/trachycephalus, and Mniarogekko; 135–280 mm SVL) appear to be higher canopy specialists when compared to smaller members of their respective communities. A pattern of high-canopy “crown-giants” has been documented in Caribbean Anolis (Losos, 1990, 2010), and possibly the gekkonid genus Cyrtodactylus in New Guinea (Oliver et al., 2014a; Oliver, personal communication). This suggests a possible correlation between living at higher strata in the forest and larger size in some predominately scansorial squamate lineages, particularly in insular systems.
While we detected other examples of rate shifts in morphological diversification, these were idiosyncratic and not initially predicted. The New Caledonian clade demonstrates higher rates of phenotypic diversification in the small-bodied genus Dierogekko (38–45 mm SVL), where BAMM recovered increased rates of diversification in relative forearm length (relative to SVL). These miniaturized geckos are otherwise conservative in external morphology and, with a single exception, allopatrically distributed (Skipwith et al., 2014). We find that some Dierogekko rapidly transitioned to shorter forearms, proportions common in small lizards living in shrub-like vegetation (Losos, 1990). A final instance of rate heterogeneity was detected using BAMM to look at the width of the toepad (relative to toe length) in the Australian genus Oedura. In contrast to the upwards rate shifts in the insular lineages for other traits, Oedura exhibits lower rates of toepad size diversification than other diplodactyloids. Compared to the most closely related genera (Strophurus, Lucasium, Rhynchoedura, and Diplodactylus), Oedura are moderately large arboreal or saxicoline geckos with a generalized climbing morphology. This ecology may have placed tight constraints on the gross morphology of Oedura toepads as it is well equipped to traverse a range of substrates.
Explicit tests of coevolution of raw trait values revealed similarly complex patterns. When looking at the entirety of the Diplodactyloidea, we see that mean correlation coefficients are overwhelmingly positive. However, estimation using a joint Markov model suggests that mainland and insular lineages diverge in signals of coevolution of the forearm (crus) and head length (HLret), forearm and lower leg (tibia), head length and eye diameter (EYE), and head length and internarial width (EN). Insular lineages display much stronger positive correlation for HLret—Crus and Crus—Tibia, suggesting that shifts in any one of these traits is under some level of constraint. While one insular lineage, Dierogekko, does show higher rates of diversification for relative forearm length, it is worth noting that both insular radiations are far more conservative in limb proportions than their mainland counterparts. One possible explanation is that the initial colonizers of New Caledonia and New Zealand were presented with a truncated envelope of available niches on their respective islands. This is evidenced by there being no strictly terrestrial forms with reduced or absent toepads on either archipelago. Further, neither island hosts an arid zone that could potentially drive terrestrial specialization as it has in Australia (Byrne et al., 2008). Rather, all insular lineages are generally scansorial or arboreal with well-developed digital scansors. Conversely, we find that head length is inversely correlated with eye diameter and internarial distance in insular lineages and very positively correlated in mainland forms. This pattern may reflect a certain degree of lability in the insular lineages in cranial morphology. The geckos of both archipelagos are largely lacking competitors or terrestrial vertebrate predators, presenting potential opportunities for these forms to act as generalists and, potentially, apex predators. Insular geckos from a wide range of body sizes may be able to take advantage of wide array of food sources, allowing for less stringent scaling relationships across cranial traits without extreme specialization. Conversely, mainland lineages display a much wider range of head forms, particularly in diplodactylids and pygopodids. One potential explanation for this is that dietary niche partitioning is much finer on the mainland, leading to several lineages with comparatively small heads with correspondingly small eyes and narrow snouts specialized for consuming small invertebrates (Diplodactylus, Lucasium, and Rhynchoedura) and head-first burrowing (Aprasia and Ophidiocephalus)
Are speciation and trait diversification correlated?
We found limited evidence for a relationship between the tempos of cladogenesis and phenotypic diversification in diplodactyloids. While diplodactyloids display extensive ecomorphological variation, there is limited evidence that this arose through early bursts in phenotypic diversification. Complexity in habitat and climate, for instance, may have played a significant role in shaping extant diversity. Similar dominant historical drivers of diversification have been proposed for the broadly overlapping, but unrelated, Australian gekkonid geckos in the genus Gehyra (Ashman et al., 2018), the gekkonids of Cyrtodactylus on New Guinea (Tallowin et al., 2018), and in Australian skinks (Blom et al., 2016). In diplodactyloids, the strongest signatures of ecological opportunity shaping diversification appear to be in insular lineages where sympatry between close relatives is more pervasive. The failure to find signatures of bursts in speciation or morphology in the core-Australian diplodactylids, though this clade occupies a much larger area of morphospace than the insular lineages, may also be the result of a long period of endemicity on the continent. This stands in contrast to the insular radiations where there are increases in the rate of phenotypic diversification that are consistent with a rapid and often relatively recent response to ecological opportunity (Burbrink et al., 2019; Garcia-Porta et al., 2016; Harmon et al., 2010).
Our finding that rate heterogeneity in phenotypic diversification across the diplodactyloid tree is not correlated across traits, indicates a complex relationship between selection pressures, niche space, and the lability of certain traits (Folk et al., 2019). This is particularly interesting given that all traits examined in this study appear to coevolve to at least some degree. This is evidenced by higher rates of body-size evolution in New Caledonia and New Zealand and constant rates for other traits despite occupying different substrates and environments. It is possible that once disparity in body size was rapidly attained, size-related niche partitioning alleviated selection pressures for rapid divergence along other trait axes (Ashman et al., 2018). Alternatively, some traits may be more labile than others in terms of the tempo of differentiation where constraint and, potentially, biomechanics limit the explorable morphospace of other traits (for instance, toepad width in Oedura).
The failure to find a correlation between speciation and trait evolution across multiple axes suggests that at least some of the traits in question may be unrelated to speciation dynamics, namely the enforcement of reproductive isolation between diverging lineages (Rabosky, 2017). For instance, Oedura from the Australian mainland exhibits similar speciation rates compared to the background but greatly decreased rates of toepad shape diversification. Garcia-Porta and Ord (2013) proposed that the evolution of toepads and limb loss in diplodactyloids acted as key innovations and facilitated increased rates of speciation. Using a largely novel tree based on phylogenomic data, we did not detect this relationship. Despite their unique morphology, diversification dynamics of the limbless pygopodids did not differ from the background rates of diplodactyloids. The transition to a hyperspecialized, snake-like Bauplan may have locked pygopodid diversification into a single rate regime that hindered large jumps in tempo over short time intervals. Furthermore, pygopodids are an old radiation, dating back to the late Eocene, and signatures of rapid early morphological diversification would likely be lost on an extant-only tree.
Key innovations are frequently noted as mechanisms for facilitating increased cladogenesis and this is likely true for some clades (Maia et al., 2013). However, as Rabosky (2017) and Burbrink et al. (2019) note, an association between novel trait acquisition and the tempo of cladogenesis should only be expected if the trait in question increases reproductive isolation between diverging populations. We show that the evolution of new traits does not drive speciation rates in diplodactyloids or vice versa. Rather, it appears that the tempos of speciation and phenotypic divergence in diplodactyloids are independently influenced by ecological opportunity. Further, the speed of ecomorphological expansion is seemingly strongest following dispersal events. It appears that while classic adaptive radiations do exist (Esquerré et al., 2020; Jonsson et al., 2012), a growing number of ecologically diverse and species-rich radiations with clear ecomorphological diversity show limited or no evidence of exceptional regime shifts in speciation dynamics or morphological diversification. Furthermore, it appears that relationships between speciation and trait diversification rates are often idiosyncratic and/or non-existent, especially in radiations from complex and older continental contexts (Ashman et al., 2018; Lee et al., 2016; Oliver et al., 2019).
Data availability
The sequence data for this study is stored at (doi:10.17632/zstmhjfkw5.1). Phenotypic data are in the supplement accompanying this article.
Author contributions
P.L.S. conceived this study, collected molecular and mensural data, conducted analyses, and primarily wrote the manuscript. Lab work was primarily funded by P.L.S. Both P.L.S. and P.M.O. conducted fieldwork to fill in taxonomic gaps and fieldwork was primarily funded by P.M.O. Both authors discussed ideas and contributed to extensive revisions before approving the final version.
Funding statement
P.M.O. was supported by a Discovery Early Career Researcher Grant and Linkage Grants from the Australian Research Council, while P.L.S. was supported by the National Science Foundation (DEB 1606806).
Conflict of interest: The authors have no conflict of interest in regard to this research or manuscript.
Acknowledgments
We thank Jimmy McGuire, Rauri Bowie, Rosemary Gillespie, Guin Wogan, and Daniel Rabosky for their feedback on analyses and manuscript preparation. We would also like to thank Carol Spencer, Jens Vindum, Patrick Couper, Andrew Amey, Ross Sadlier, Mark Hutchinson, Gavin Daily, Jason Froggatt, and Thomas Schultz for access to specimens in their care.
