


Abstract
Local selection can promote phenotypic divergence despite gene flow across habitat mosaics, but adaptation itself may generate substantial barriers to genetic exchange. In plants, life-history, phenology, and mating system divergence have been proposed to promote genetic differentiation in sympatry. In this study, we investigate phenotypic and genetic variation in Mimulus guttatus (yellow monkeyflowers) across a geothermal soil mosaic in Yellowstone National Park (YNP). Plants from thermal annual and nonthermal perennial habitats were heritably differentiated for life-history and mating system traits, consistent with local adaptation to the ephemeral thermal-soil growing season. However, genome-wide genetic variation primarily clustered plants by geographic region, with little variation sorting by habitat. The one exception was an extreme thermal population also isolated by a 200 m geographical gap of no intermediate habitat. Individual inbreeding coefficients (FIS) were higher (and predicted by trait variation) in annual plants and annual pairs showed greater isolation by distance at local (<1 km) scales. Finally, YNP adaptation does not reuse a widespread inversion that underlies M. guttatus life-history ecotypes range-wide, suggesting a novel genetic mechanism. Overall, this work suggests that life-history and mating system adaptation strong enough to shape individual mating patterns does not necessarily generate incipient speciation without geographical barriers.
Introduction
The opposition between gene flow and selection across heterogeneous landscapes governs both local adaptation and the emergence of new species. Extrinsic barriers to gene flow (e.g., distance, dispersal barriers, or gaps in suitable habitat) allow allopatric populations to drift or adapt independently toward speciation (reviewed in Gavrilets 2003; Coyne and Orr 2004). However, a small number of migrants between populations can be enough to homogenize genetic variation genome-wide (Slatkin 1973; Lenormand 2002), even if environmental heterogeneity causes divergent selection. At one extreme, this interplay between selection and gene flow may result in a handful of adaptive outlier loci standing out against a background of low genome-wide differentiation (Jones et al. 2018). At the other, local adaptation itself may generate strong barriers to gene flow among habitats, extending genetic differentiation beyond the loci under divergent selection and potentially initiating speciation. Theory shows that speciation in the absence of geographic barriers is particularly possible when adaptation involves so-called “magic traits,” which simultaneously confer habitat-specific fitness and enforce strongly assortative mating (Servedio et al. 2011; Smadja and Butlin 2011; Kopp et al. 2018). However, while adaptation and speciation often progress in contexts including gene flow, it remains unclear whether and how local adaptation can generate reproductive isolation and genetic differentiation in the absence of geographic barriers.
In flowering plants, soil mosaics provide an ideal context in which to jointly consider adaptation and speciation without geographic barriers (reviewed in Rajakaruna 2018). Differences in soil moisture, nutrient availability, and mineral concentrations between geologically distinct soils can impose strong divergent selection over distances within the range of seed and pollen movement (Brady et al. 2005; Richardson et al. 2014). Selection across such edaphic mosaics may result in differentiation of adaptive traits controlled by major loci, but little neutral genomic divergence, as in the classic Linanthus flower color polymorphism (Schemske and Bierzychudek 2007) or copper tolerance in monkeyflowers (Lee and Coop 2017). Nonetheless, the abundance of edaphically specialized endemic plant species suggest that soil adaptation may often generate divergence in complex traits that cause reproductive isolation (reviewed in Baack et al. 2015; Rajakaruna 2018). Occupation of different environments may directly influence reproductive traits (Levin 2009; 2010), contributing to isolation by environment (IBE; Wang and Bradburd 2014; Sexton et al. 2014) even without adaptation. However, stressful edaphic patches may often favor local shifts in flowering time (e.g., Dittmar and Schemske 2017; Sianta and Kay 2021) and/or mating system (Ferris et al. 2014). In particular, the repeated evolution of the floral “selfing syndrome” (Sicard and Lenhard 2011; Opedal 2018), often in marginal habits (Baker 1955), profoundly affects patterns of genomic variation in plant populations (Schoen and Brown 1991; Charlesworth and Wright 2001; Barrett et al. 2014). Shifts in reproductive traits are thought to be a major drivers of plant speciation (e.g., Barrett and Harder 1996), and phenological and mating system evolution associated with adaptation to soil mosaics have even been implicated in putative cases of sympatric speciation (Savolainen et al. 2006) and reinforcement (Antonovics 2006). Thus, investigating how traits, habitats, and geography interact to shape genome-wide patterns of plant differentiation across edaphic mosaics is central to understanding adaptation and speciation.
We investigate how life-history and mating system divergence influence population structure and individual genomic variation in yellow monkeyflowers across geothermal soil mosaic in Yellowstone National Park (YNP). The yellow monkeyflowers of the Mimulus guttatus species complex are a model system for understanding the evolutionary genetics of edaphic adaptation (Lee and Coop 2017; Selby and Willis 2018) and life history (Lowry and Willis 2010; Coughlan et al. 2021), phenology (Friedman and Willis 2013; Fishman et al. 2014; Kooyers et al. 2019), and mating system (Fishman et al. 2002) divergence, creating a robust comparative framework. Across a latitudinal range from Alaska to Baja California, M. guttatus populations exhibit alternative annual and perennial ecotypes, with annuals found in ephemeral wet soils and perennials wherever soils remain saturated through the summer (Lowry and Willis 2010; Oneal et al. 2014; Twyford and Friedman 2015; Peterson et al. 2020). Numerous traits associated with life history (including flowering time, flower and plant size, and stolon production) map to a diagnostic chromosomal inversion on Chromosome 8 of M. guttatus (DIV1; Hall et al. 2006; Lowry and Willis 2010), and widespread annuals and perennials exhibits strongly elevated differentiation across this large region of suppressed recombination (Oneal et al. 2014; Twyford and Friedman 2015; Gould, et al. 2017). Within annual M. guttatus, several distinct species have arisen via the evolution of obligate selfing (Fenster and Ritland 1994; Brandvain et al. 2014). The most widespread, M. nasutus, occurs in sympatry with M. guttatus across a broad range (Martin and Willis 2007; Kenney and Sweigart 2016), while others are endemic to distinct edaphic substrates (MacNair and Cumbes 1989; Ferris et al. 2014). Edaphic adaptation (e.g., to serpentine and copper mine soils) has also occurred within M. guttatus without mating system divergence and/or speciation (MacNair 1983; Lee and Coop 2017; Selby and Willis 2018). Thus, edaphic, life-history, and mating system adaptation have distinct outcomes even within this one species complex.
In YNP (home to >50% of Earth's geysers), geothermal inputs recapitulate on a microgeographic scale the soil conditions that shape adaptation across the range of M. guttatus. Yellow monkeyflowers are one of a few vascular plants that live in extreme geothermal crusts, which create a ground-level oasis when cooled by winter/spring snowmelt but become deadly hot (45°C–65°C) and dry by early summer (Lekberg et al. 2012). Throughout YNP, summer-flowering M. guttatus also occur in nonthermal wetland habitats (bogs, riversides) that are under snow much of the year, and in diverse intermediate habitats near geothermally influenced water sources (Fig. 1A). Previous work focused on two sites, Agrostis Headquarters (AHQ) and Rabbit Creek (RBC), which share similar thermal and nonthermal extremes but strongly differ in habitat-associated population genetic structure (Lekberg et al. 2012; Hendrick et al. 2016). In common gardens, plants from focal thermal sites exhibited shifts in floral morphology, flowering cues, and growth form consistent with adaptation to the narrow spatial/temporal window for growth and reproduction in this extreme habitat (but life-history traits were not measured; Lekberg et al. 2012). Complex microgeographic adaptation in YNP creates an ideal opportunity to investigate the buildup of genetic and phenotypic differentiation in the absence of external barriers to gene flow.
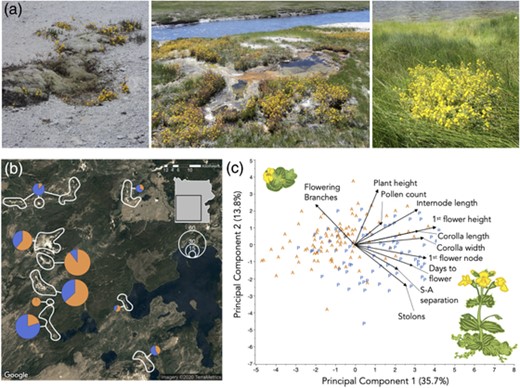
Yellow monkeyflowers (Mimulus guttatus) exhibit heritable life-history and reproductive trait variation consistent with adaptation a geothermal soil mosaic in Yellowstone National Park (YNP). (a) Typical YNP M. guttatus habitats, including (left to right) geothermal crusts where precipitation is the only source of water, the fringes of hot pools and streams, and densely vegetated nonthermal bogs. (b) For population genetic and phenotypic analyses, M. guttatus (total N = 318) plants were collected from habitats defined as summer-dry annual (orange) and summer-wet perennial (blue) habitats in most of YNP's major geyser basins (pies). (c) Plants from thermal annual (A, orange) and nonthermal perennial (P, blue) habitats were differentiated along major principal components defined by life history (stolons vs. flowering branches) plus mating system (stigma–anther separation), and plant phenology, architecture, and size, in a common garden. Principal components analysis was conducted on family means (total N = 307–322, progeny n = 2 per family). Drawings by Mariah McIntosh.
In this study, we characterize heritable phenotypic variation, genome-wide population differentiation, and genetic diversity of plants sampled across the complex matrix of M. guttatus habitat in YNP. We defined each collection site as either an annual or perennial habitat (AH and PH, respectively) based on summer dry-down and grew progeny from wild plants in a greenhouse common garden to extract heritable variation for life-history, phenological, and floral traits. We used a reduced representation sequencing protocol (ddRADSeq) to genotype the wild individuals at thousands of loci genome-wide, then examined genomic variation in the context of habitat, geography, and phenotype. First, we assessed whether plants from AH sites have evolved annuality and characterize the full spectrum of phenotypes from AH and PH habitats. Second, we characterize patterns of genetic variation across the landscape, assign individuals to population clusters, and ask how variation is structured by environment (AH vs. PH) and geography. Third, we ask how habitat affects isolation-by-distance and FIS (inbreeding coefficient) and whether heritable phenotypes predict FIS within each habitat. Finally, we examine patterns of AH–PH differentiation genome-wide to test whether life-history adaptation in Yellowstone thermal-soil habitats reuses widespread annual–perennial chromosomal polymorphisms or has an independent genetic basis.
Materials and Methods
STUDY SYSTEM
Mimulus guttatus Fisch. Ex. DC (Phrymaceae) is an herbaceous plant common in diverse wet soil habitats throughout western North America. Here, we focus on M. guttatus variation within YNP, on the far eastern edge of the species range. In YNP, M. guttatus plants are abundant across a complex edaphic mosaic generated by geothermal activity warming soils in winter and making them inhospitable in summer (Fig. 1A). Previous work characterized genetic and phenotypic variation at just two focal sites with adjacent thermal and nonthermal extremes, AHQ and RC (Lekberg et al. 2012; Hendrick et al. 2016). Here, we sampled M. guttatus in diverse nonthermal and thermal habitats in all major geyser basins except Mammoth and Mud Volcano, where high and low pH, respectively, may inhibit M. guttatus occurrence.
FIELD COLLECTIONS AND HABITAT ASSIGNMENT
Mimulus guttatus individuals and habitat data were collected from >170 geo-referenced sites across YNP's geyser basins (n = 2–3 plants ∼1 m apart per site, Fig. 1B, Table S1). We visited each site twice, timed as logistically feasible due to Park restrictions on research activity in thermal areas. The first visit (mostly in 2017) was as early in the site-specific growing season as possible to collect adult plants for transplanting into a greenhouse (see below). We strove to sample individuals from the full range of thermal and nonthermal habitats within each geyser basin. In August 2018, we revisited and categorized each collection location (at same 1 m scale) as annual habitat (AH) or perennial habitat (PH) based on soil moisture and the presence of live M. guttatus: AH = dry with dead plants; PH = wet with live adult plants. Although this binary categorization does not capture the complexity and diversity of environments generated by geothermal activity in YNP, it encapsulates the key factor selecting on M. guttatus life history there and range-wide.
COMMON GARDEN PHENOTYPING
To extract heritable phenotypes from our field plants under common garden conditions, we hand-pollinated one wild plant from each site to generate inbred full sibships (N = 174 sites; 154 from 2017 transplants, plus 20 grown from previous AHQ and RC wild seed collections). Seeds were stratified in 24-well microplates on wet sand for two weeks (4°C, dark), then germinated at 24°C/12°C (16/8 h day/night cycle). Seedlings were transplanted to 2² pots (two pots per maternal family, randomized positions) and maintained under ∼30°C/15°C 16/8 h cycle in a greenhouse with supplemental lighting, daily bottom-watering to saturation, and monthly fertilization. When the first flower on each plant opened, we recorded days to flower, the first flower height (mm) and node number (plus internode length calculated as the first flower height/node number), and its corolla width, corolla length, and stigma–anther distance (as defined in Fishman et al. 2002). We collected all four anthers of the first flower into 50 μL of aniline blue lactophenol dye and used a hemocytometer to estimate pollen viability and pollen number (Fishman and Saunders 2008). At 85 days posttransplant (∼3 weeks after the latest first flower), we counted the number of stolons and reproductive branches and measured total plant height. Stolons were defined as vegetative branches >1 cm long arising below the second leaf pair and remaining horizontal at least to the pot edge, whereas reproductive branches were defined as branches (>1 cm long) arising from above the second leaf pair and bearing floral buds.
To test whether plants from different habitats (AH vs. PH) differed, on average, YNP-wide and to estimate broadsense heritability (H2; proportion of the total within-habitat phenotypic variance explained by family) and we used mixed model REML with habitat as a fixed effect and selfed family as a random effect nested within habitat, implemented in JMP 14 (SAS Institute 2018).
ddRAD GENOTYPING
Genomic DNA was extracted from the greenhouse-grown wild plants (and the using a CTAB-chloroform protocol modified for 96-well plates (dx.doi.org/10.17504/protocols.io.bgv6jw9e). We used a double-digest restriction-site associated DNA sequencing (ddRADSeq) protocol to generate genome-wide sequence clusters (tags), following the BestRAD library preparation protocol (Ali et al. 2016), using restriction enzymes PstI and BfaI (New England Biolabs, Ipswich, MA). An in silico digestion of the M. guttatus reference genome with this pair generated highly genic and evenly dispersed tags. After enzymatic digestion, sets of 48 individual DNAs were labeled with unique in-line barcoded oligos, and each set pooled into a single tube. Pools were barcoded using NEBNext indexing oligos with a degenerate barcode, PCR amplified, and size-selected (200–500 bp fragments) using agarose gels. Libraries were prepared using NEBNext Ultra II library preparation kits for Illumina (New England BioLabs, Ipswich, MA). The libraries were paired-end sequenced (150 bp) on two 1/2 lanes of an Illumina HiSeq4000 sequencer.
Illumina reads were demultiplexed and true PCR duplicates (same restriction site, plus same degenerate barcode) removed using a custom Python script (dx.doi.org/10.17504/protocols.io.bjnbkman). Adapters were trimmed and low-quality reads removed using Trimmomatic (Bolger et al. 2014). Reads were mapped to the M. guttatus v2 reference genome (https://phytozome.jgi.doe.gov) using BWA MEM (Li and Durbin 2009) and indexed with SAMtools (Li et al. 2009). We retained 58 million reads after alignment and quality filtering. After filtering of individuals for mean coverage (>7×) and other quality metrics, we retained genomic data for 231 individuals (N = 119 AH and 112 PH) representing 165 collection sites. SNPs were called using the STACKS pipeline (Catchen et al. 2011, 2013) for aligned sequence data. The “Gstacks” module was used to identify loci and SNPs and to genotype individuals, and we used “Populations” to filter SNPs (maximum missing data = 0.2, minor allele frequency = 0.05) and export genotypes to vcf format. For analyses of population genetic structure and individual genetic diversity, we pruned the dataset to one random SNP per ddRAD tag across the 14 main V2 chromosomes, for a total of 14,919 variable sites. For scans of YNP-wide AH–PH differentiation, we included all variant SNPs (n = 78,479) across those same scaffolds.
ANALYSES OF POPULATION GENETIC STRUCTURE AND INDIVIDUAL VARIATION
Individuals were geo-referenced and named by geyser basin (Fig. 1B), site number within geyser basin, and plant number within site (Table S1), but not assigned to populations a priori. To explore broad patterns of genetic structure and establish populations for downstream analysis, we used discriminant analysis of principal components (DAPC) implemented in the R package adegenet (Jombart 2008). We used the find.clusters function on the first 20 PCs to identify the number of clusters (k) that minimized the Bayesian information content and then used the dapc function to cluster individuals (retained PCs = 7, retained axes = 4). To visualize the correlations underlying the DAPC, we performed genetic principal components analysis (PCA) using plink2.0 (Purcell et al. 2007). We also recalculated the PCA removing all but one individual from the extreme AHQT population. Finally, we used the Bayesian clustering method conStruct, which includes continuous geographic distance in model generation, to infer population structure and individual admixture proportions (Bradburd et al. 2018). The threefold cross-validation method in conStruct was used to evaluate k = 2–8 layers, with 3000 Markov-chain Monte Carlo generations assessed for independent convergence for each value of k.
To assess the hierarchical partitioning of genetic variation, we stratified individuals by regions and habitat (excluding AHQT) and conducted analysis of molecular variance (AMOVA) using the R package poppR (Kamvar et al. 2014). Significance of region and habitat effects were tested with the function randtest in package ade4 (Dray and Dufour 2007) using 999 permutations of the data matrix. We also calculated mean pairwise Weir and Cockerham's FST (plus bootstrapped 95% confidence intervals) among the nine region × habitat subpopulations using the R program Hierfstat (Goudet 2005).
To investigate the landscape scale of genetic differentiation among individuals, we calculated pairwise Euclidean genetic and geographic distance matrices among all individuals (excluding AHQT) using the “vegan” package in R (Oksanen et al. 2017). We did not implement Mantel tests (Matesanz et al. 2011) or use Bayesian IBE approaches built on habitat dissimilarity matrices (Bradburd et al. 2013) to estimate the effects of environmental distance versus geographical distance on genetic distance. AMOVA indicated that relatively little genetic variation was explained by habitat category and replication of habitats in multiple regions (vs. a single joint gradient) is better captured by a nested model (Sexton et al. 2014). Furthermore, we expect habitat (and associated traits) to affect patterns of genetic distance within habitats via mating system, as well as to influence gene flow across habitat boundaries. To evaluate this interaction directly, we regressed genetic distance versus geographical distance for the three categories of habitat pair (AH–AH, AH–PH, PH–PH), then tested for effects of habitat on genetic distance in four geographic distance categories (0–1 km, 1–3 km, 3–10 km, >10 km) using ANOVA with habitat–pair, distance category, and their two-way interaction using JMP14 (SAS Institute 2018). Unequal distance categories were chosen because we expect the strongest effects of reproductive ecology at within-patch scales (<1 km), collections were not continuously distributed, and the relationship between geographic and genetic distance was nonlinear.
To examine genome-wide patterns of diversity, we calculated pairwise nucleotide diversity (π) in vcftools (Danecek et al. 2011), for all genotyped individuals, regional populations, and the nine region × habitat subpopulations using variant and invariant sites at 23,545 ddRAD tags (2,409,908 sites) that passed coverage and missing data filters. 95% confidence intervals for mean π values were obtained by bootstrapping.
To infer individual inbreeding history, we calculated inbreeding coefficient (FIS) using the –het command in vcftools (Danecek et al. 2011), with expected homozygosity calculated within the five regional populations. We compared mean FIS of AH and PH YNP-wide with ANOVA, as well as among regions and all AH–PH partitions within regions. Three individuals with highly negative (<−0.20) values of FIS were excluded from this and the following analyses as potentially contaminated or recent hybrids between distinct populations; this exclusion did not materially affect the results or interpretation. To test for associations between heritable phenotypes (progeny) and inbreeding history (wild plants) within habitat, we excluded all but one AHQT individual, split the dataset by habitat (AH vs. PH) and conducted forward–backward model selection (AICc difference >2 criterion) on all 14 phenotypes as predictors of FIS (traits and FIS standardized to mean and variance = 1). We then examined effects in the best-fit models for each habitat using a linear regression framework. FIS statistical analyses were performed in JMP14 (SAS Institute 2018).
TESTS FOR INDEPENDENCE FROM WIDESPREAD ANNUAL–PERENNIAL DIAGNOSTIC INVERSIONS
Although dense at >50 tags/Mb or ∼10/cM (∼100 cM and 15–25 Mb per chromosome; Flagel et al. 2019), our ddRAD dataset does not provide resolution to characterize the genomic basis of geothermal adaptation (Lowry et al. 2016). However, genome scans can rule in or out the involvement of widespread inversions diagnostic of life-history divergence across the species range. Two genomic rearrangements, inv8 (aka DIV1) on Chromosome 8 and inv5 on Chromosome 5 exhibit elevated FST in broad-scale annual–perennial comparisons (Oneal et al. 2014; Twyford and Friedman 2015; Gould et al. 2017). inv8/DIV1 (but not inv5) is also a major QTL for numerous traits defining the alternative life-history strategies (Hall et al. 2006; Lowry and Willis 2010). To ask whether either inversion was differentiated between AH and PH plants in YNP, we calculated mean FST in nonoverlapping 50-SNP windows across the all-SNP dataset. We then compared mean FST in windows from genomic scaffolds in inv8 and inv5 as defined in Gould et al. (2017) to the remainder of the genome using ANOVA in JMP14 (SAS Institute 2018).
Results
HERITABLE VARIATION IN LIFE-HISTORY, PLANT ARCHITECTURE, AND MATING SYSTEM TRAITS
Under common garden conditions, plants from thermally influenced summer-dry habitats (annual; AH) were heritably differentiated from plants from persistently wet habitats (perennial; PH) along life-history, plant architecture, and mating system axes (Table 1, Fig. 1C). AH plants produced fewer stolons (4.83 ± 0.65 vs. 13.12 ± 0.76) and more flowering branches (5.56 ± 0.28 vs. 4.15 ± 0.32) than PH plants, resulting in an approximately twofold difference in allocation to sexual versus asexual reproduction (reproductive ratio: 0.62 ± 0.03 vs. 0.32 ± 0.03). AH plants flowered on earlier nodes with shorter internode lengths, resulting in a much lower height to first flower (Table 1). However, habitat influenced mean days to first flower only weakly (AH < 2 days earlier; P = 0.03) and had no effect on total plant height (Table 1). Flowering time was highly variable among AH families and better fit by a mixture of two normal distributions (unimodal normal AICc = 571.2, mean = 39.1, bimodal normal mixture AICc = 544.8, means 37.0 and 44.5) flanking the single intermediate PH peak (mean = 40.8).
Broad-sense heritability (H2) and habitat differentiation of life-history and mating system traits in Yellowstone Mimulus guttatus grown in a greenhouse common garden. Habitat effects and H2 values were derived from mixed model REML analysis with habitat as a fixed effect and full-sib family (selfed, n = 2 per family) as a random effect nested within habitat
| Trait | N | H2 | HabitatP-value | Annual(Mean ± SE) | Perennial (Mean ± SE) |
|---|---|---|---|---|---|
| Days to flower | 322 | 0.63 | 0.03 | 39.09 ± 0.50 | 40.76 ± 0.56 |
| 1st Flower node | 322 | 0.50 | <0.0001 | 2.49 ± 0.07 | 3.26 ± 0.08 |
| 1st Flower height (cm) | 321 | 0.49 | <0.0001 | 4.05 ± 0.24 | 6.53 ± 0.27 |
| Internode length (cm) | 321 | 0.51 | <0.0001 | 1.59 ± 0.07 | 1.97 ± 0.08 |
| Stolon number | 303 | 0.62 | <0.0001 | 4.83 ± 0.65 | 13.12 ± 0.76 |
| Flowering branches | 302 | 0.45 | <0.0001 | 5.56 ± 0.28 | 4.15 ± 0.32 |
| Reproductive ratio | 302 | 0.64 | <0.0001 | 0.62 ± 0.03 | 0.32 ± 0.03 |
| Plant height (cm) | 303 | 0.64 | 0.73 | 22.33 ± 0.77 | 22.74 ± 0.89 |
| Corolla width (mm) | 316 | 0.60 | 0.007 | 19.43 ± 0.32 | 20.72 ± 0.36 |
| Corolla length (mm) | 316 | 0.60 | 0.05 | 13.84 ± 0.19 | 14.4 ± 0.22 |
| Corolla width/length ratio | 316 | 0.26 | 0.09 | 1.41 ± 0.02 | 1.45 ± 0.02 |
| Stigma–anther separation (mm) | 315 | 0.54 | <0.0001 | 0.77 ± 0.07 | 1.37 ± 0.08 |
| Pollen number (×103) | 307 | 0.18 | 0.42 | 17.30 ± 0.98 | 16.12 ± 1.10 |
| Pollen viability | 307 | 0.31 | 0.004 | 0.89 ± 0.01 | 0.83 ± 0.01 |
Consistent with the selection for autogamous self-pollination and reduced pollinator attraction in annual habitats, AH plants had ∼50% lower stigma–anther separation and slightly narrower corollas than PH plants (Fig. 1, Table 1). Parallel reductions in corolla length and width–length ratio were only marginally significant (P = 0.05 and 0.09, respectively). The pollen number did not differ among habitats or families, but the pollen viability was moderately heritable (H2 = 0.38; Table 1) and AH plants had, on average, higher pollen viability than PH plants (0.89 vs. 0.83, P < 0.005; Table 1).
POPULATION GENETIC STRUCTURE ACROSS THE COMPLEX YELLOWSTONE HABITAT MOSAIC
Both DAPC and conStruct primarily clustered individuals by geography (geyser basin) rather than habitat (Fig. 2). In the DAPC, values of k (clusters) from five to nine minimized variance among clusters (Fig. 2B, inset), so we conservatively assigned individuals to five populations (Fig. 2). One consisted entirely of plants from an extreme thermal population AHQT, which was also isolated in previous analyses (Lekberg et al. 2012; Hendrick et al. 2016). The other four clusters correspond to broad geographic regions (designated Central, Northern, Southern, and Southeastern; Fig. 2A–C). AHQT's distinctness does not reflect novel variation; a genomic PCA including only a single AHQT sample places it with Central plants (Fig. S1) and AHQT and the large Central population had similarly low numbers of private alleles per sample (1.3 and 1.1, respectively). conStruct also resolved primarily geographical structure (Fig. 2D), and models including a spatial component within layers were always better supported (Fig. S2). At the k = 5 supported by cross-validation (Fig. S2), only AHQT individuals were >85% assigned to a single layer and individuals within each DAPC-defined region showed substantial admixture (Fig. 2D). Furthermore, at k = 2–8 layers, habitat never defined a discrete component (Fig. S3).
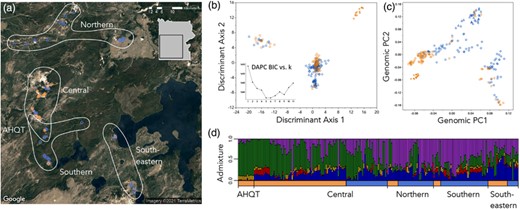
Population genetic structure in Yellowstone Mimulus guttatus is primarily geographical, rather than habitat-associated. (a) Individual sample locations coded by habitat (orange = annual, blue = perennial) and population assignments from DAPC (k = 5). The colors and population symbols are repeated in B–D. (b) Individuals plotted along the first two discriminant axes of the DAPC with best k = 5. Inset: Bayesian information criterion values for DAPC at k clusters 1–11. (c) Individuals plotted along the first two genomic principal component (PC) axes contributing to the DAPC assignments. Including only one individual from AHQT in the PCA shifts it to within the central cluster, while other PC scores remain very similar (Fig. S1). (d) Admixture proportions of individuals from conStruct analysis (k = 5), ordered by habitat and DAPC-defined populations.
The four DAPC-defined regional populations were moderately differentiated from each other (FST = 0.10 − 0.18) and AHQT was highly differentiated from all other populations (FST = 0.23 − 0.35), but AH and PH partitions within each region were largely undifferentiated (FST = 0.01 − 0.05) (Table 2). Geographical region (AHQT excluded) explained a larger portion of the variance (populations; ∼12%) than habitat within region (subpopulations; ∼2%) in AMOVA, but within-subpopulation variation was greatest (∼28%) (all P < 0.001; Table 3). The small but significant habitat effect may reflect sampling of a subset of adaptive loci or neutral effects of the environment on gene flow (Wang and Bradburd 2014).
Pairwise FST (and 95% confidence intervals) among the five DAPC-defined population clusters, including the extreme thermal annual AHQT, and between annual (AH) and perennial (PH) habitats within each regional population. Confidence intervals were calculated with 100 bootstrapped replicates
| Population pair | FST | 95% CI |
|---|---|---|
| AHQT/Southern | 0.279 | 0.277−0.281 |
| AHQT/Central | 0.229 | 0.227−0.231 |
| AHQT/Northern | 0.302 | 0.300−0.304 |
| AHQT/Southeastern | 0.348 | 0.346−0.350 |
| Southern/Central | 0.108 | 0.107−0.109 |
| Southern/Northern | 0.101 | 0.100−0.102 |
| Southern/Southeastern | 0.119 | 0.118−0.120 |
| Central/Northern | 0.124 | 0.122−0.125 |
| Central/Southeastern | 0.170 | 0.168−0.172 |
| Northern/Southeastern | 0.182 | 0.181−0.184 |
| AH/PH Southern | 0.049 | 0.047−0.050 |
| AH/PH Central | 0.027 | 0.026−0.027 |
| AH/PH Northern | 0.013 | 0.012−0.014 |
| AH/PH Southeastern | 0.012 | 0.011−0.013 |
Analysis of molecular variance (AMOVA) across DAPC-assigned regions and habitats (AH vs. PH). Percent Variance Explained (PVE) is the percentage of variance explained by each hierarchical factor, and significance (P) versus zero was calculated by random permutation (n = 999) of the data matrix
| Variance component | df | PVE | P |
|---|---|---|---|
| Among regions (excluding AHQT) | 3 | 11.8 | <0.001 |
| Between habitats within regions | 4 | 2.3 | <0.001 |
| Among individuals within region and habitat | 210 | 27.6 | <0.001 |
| Variance component | df | PVE | P |
|---|---|---|---|
| Among regions (excluding AHQT) | 3 | 11.8 | <0.001 |
| Between habitats within regions | 4 | 2.3 | <0.001 |
| Among individuals within region and habitat | 210 | 27.6 | <0.001 |
As expected, genetic and geographic distance were highly (and nonlinearly) related regardless of habitat (Fig. S4). However, the relationship between genetic and geographic distance varied with the habitat at local spatial scales, with distance class, habitat–pair category (AH–AH, AH–PH, PH–PH) and their interaction all significant by ANOVA (all P < 0.0001; Fig. 3). Specifically, PH–PH pairs were more genetically similar than AH–PH and AH–AH pairs in the shortest distance class (least-squared mean contrasts; P = 0.003), but AH–AH pairs were relatively close genetically at the two intermediate distance classes (both P < 0.0001; Fig. 3). Across-environment (AH–PH) genetic distances were indistinguishable from within-environment pairs at each distance class (all P > 0.05, Tukey's Honest Significant Difference (HSD)). Although parsing the effects of environment versus geographical distance is complicated in patchy landscapes (Wang and Bradburd 2014; Sexton et al. 2014), these patterns suggest that mating system shifts in AH plants reduce gene flow with nearby plants in both AH and PH habitats, but only at local spatial scales.
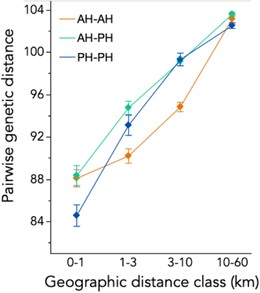
Habitat affects patterns of genetic distance among individuals, but cross-habitat genetic distances are not elevated relative to within-habitat distances at any geographical scale. Least-squared means (LSMs ± 1 standard error) of pairwise genetic distance for pairs of individuals sampled from AH–AH (annual), AH–PH (mixed), and PH–PH habitats across geographical distance categories. Values are from a two-way ANOVA with habitat pair, the distance category, and their interaction (all P < 0.0001). Cross-habitat pairs (AH–PH, mixed) were not statistically different from one or the other within-habitat pair in the three shorter distance categories (Tukey's HSD test, P > 0.05).
HABITAT AND PHENOTYPIC EFFECTS ON GENETIC DIVERSITY
YNP M. guttatus exhibited moderate nucleotide diversity (π = 0.011), higher than genome-wide genotyping-by-sequencing estimates for perennial M. guttatus populations globally (Vallejo Marín et al. 2021) but similar to one deeply sequenced annual population (πS = 0.03; Puzey et al. 2017). Regional populations captured similar diversity (π = 0.009–0.011), as did AH (π = 0.008–0.010) and PH subsets (π = 0.009–0.011) within each region. AHQT was about half as diverse as other partitions (π = 0.005) and relatively invariant at sites segregating YNP-wide (55% of sites polymorphic vs. 87–98% for the regional mixed populations). Despite its lower expected heterozygosity, the mean inbreeding coefficient (FIS) at AHQT was significantly higher than all other regional populations (Table 4). AH plants overall (excluding AHQT) also had significantly higher FIS (mean = 0.41 ± 0.02 SE, N = 103) relative to PH individuals (mean = 0.29 ± 0.02 SE, N = 110; habitat r2 = 0.065, P < 0.0001; Fig. 4; Table 4). This pattern was driven by the larger majority-annual Southeastern and Central populations; in the majority-perennial Northern and Southern regions, AH partitions did not have greater FIS (Table 4).
Mean nucleotide diversity (π) and inbreeding coefficients (FIS) ± SE (as well as N for both analyses) of M. guttatus plants sampled from annual (AH) and perennial (PH) habitats in DAPC-defined regional populations in Yellowstone National Park. For all estimates of π, the 95% bootstrapped confidence intervals were within the rounded digits shown for the means
| Population | π (AH) | π (PH) | FIS (AH) | FIS (PH) |
|---|---|---|---|---|
| AHQT | 0.005 | n/a | 0.52 ± 0.04 (13) | n/a |
| Central | 0.010 | 0.010 | 0.42 ± 0.03 (78) | 0.27 ± 0.04 (33) |
| Northern | 0.009 | 0.011 | 0.22 ± 0.07 (6) | 0.38 ± 0.04 (29) |
| Southern | 0.008 | 0.011 | 0.25 ± 0.05 (7) | 0.25 ± 0.02 (39) |
| Southeastern | 0.009 | 0.009 | 0.43 ± 0.09 (13) | 0.25 ± 0.05 (11) |
| All | 0.011 | 0.40 ± 0.02 (117) | 0.28 ± 0.02 (111) | |
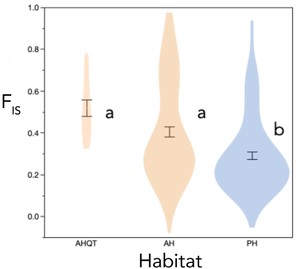
Habitat (including associated phenotypes) affects individual inbreeding history. Means (±1SE) and distributions of individual inbreeding coefficients (FIS) of M. guttatus plants sampled from the isolated thermal annual AHQT population and other annual and perennial habitats in Yellowstone National Park. Individual FIS values were calculated within each the five regional populations. Letters indicate means significantly different by Tukey's HSD test (P < 0.05).
AH plants (even excluding AHQT) exhibited bimodality of FIS values (Fig. 4) and parental inbreeding coefficients were associates with offspring traits. The AH FIS model with minimum AICc (r2 = 0.48) included four traits (Table 5; N = 40 families with all traits measured), with higher FIS values associated with flowering closer to the ground, reduced herkogamy, relatively wide corollas, and lower pollen viability (in progeny). Among PH plants (n = 44), no phenotypic variables improved prediction of FIS over the null model.
Parental inbreeding coefficient (FIS) prediction by common-garden progeny phenotypes across annual habitat (AH) M. guttatus lineages (N = 40 families with genome-wide FIS values and all traits measured in multiple progeny). The four best-fit model (r2 = 0.48) was obtained by forward–backward stepwise model selection using a minimum AICc criterion (AICc for this model = 102.4 vs. 107.3 for three-trait model, 101.3 for five-trait model, and 118.1 for null model)
| Trait | FIS Effect Estimate | FIS Effect SE | FIS Effect P-Value |
|---|---|---|---|
| 1st flower height | −0.51 | 0.14 | 0.001 |
| Corolla width/length ratio | 0.38 | 0.12 | 0.005 |
| Stigma–anther separation | −0.30 | 0.12 | 0.023 |
| Pollen viability | −0.29 | 0.13 | 0.031 |
| Trait | FIS Effect Estimate | FIS Effect SE | FIS Effect P-Value |
|---|---|---|---|
| 1st flower height | −0.51 | 0.14 | 0.001 |
| Corolla width/length ratio | 0.38 | 0.12 | 0.005 |
| Stigma–anther separation | −0.30 | 0.12 | 0.023 |
| Pollen viability | −0.29 | 0.13 | 0.031 |
TESTS FOR GENETIC INDEPENDENCE OF ANNUALITY IN YELLOWSTONE M. GUTTATUS FROM WIDESPREAD INVERSIONS
The DIV1/inv8 inversion, which is phenotypically and genetically diagnostic of life history range-wide, did not show elevated FST between AH and PH plants in Yellowstone (Fig. 5A). Indeed, DIV1 had slightly reduced differentiation relative to the rest of the genome (mean FST = 0.02 vs. 0.03, Fig. 5B). However, the inv5 region exhibited substantially elevated FST (mean = 0.09; Fig. 5B) (Gould et al. 2017), and contained 25% (10/40) of the top 2.5% outlier windows.
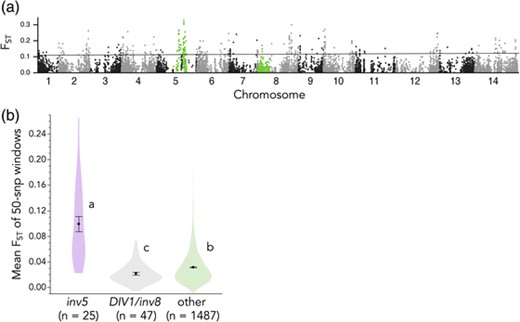
Genome scan reveals independent derivation of annuality in Yellowstone M. guttatus. (a) FST between AH and PH plants at SNPs genome-wide. Highlighted SNP are in inversions that phenotypically define annuals and perennials (inv8/DIV1 only; Hall et al. 2006; Lowry and Willis 2010) and/or show elevated coastal annual–inland perennial differentiation (both; Gould et al. 2017). (b) Means, standard errors, and distributions of mean FST for 50-SNP windows genome-wide. Letters indicate means significantly different by Tukey's HSD test.
Discussion
LIFE HISTORY AND MATING SYSTEM EVOLUTION IN YELLOWSTONE THERMAL ANNUALS INDEPENDENTLY PARALLELS RANGE-WIDE PATTERNS OF M. GUTTATUS ADAPTATION TO EPHEMERAL HABITATS
Our results demonstrate the power of natural selection to generate complex reproductive and edaphic adaptation despite abundant gene flow across a microgeographic habitat mosaic. Although based on a single observation of late summer drought at each site, the definition of annual (AH) versus perennial (PH) sites captured the major axes of phenotypic adaptation in Yellowstone monkeyflowers remarkably well (Fig. 1C, Table 2). These habitats are strongly shaped by geothermal influences on YNP soils (i.e., all AH habitats are in active thermal areas), but soil temperature per se is likely not the major selective agent. Instead, like widespread annual M. guttatus ecotypes (Hall and Willis 2006; Lowry and Willis 2010; Peterson et al. 2020) and Mimulus cardinalis from Southern California (Nelson et al. 2021), geothermal AH plants have adapted via drought-escape into an alternative temporal niche for growth and reproduction. The resulting phenotypic differentiation parallels broader scale patterns in Mimulus and other flowering plants, but with YNP-specific features that illuminate general rules governing life-history and mating system evolution.
The evolution of annuality from perenniality is common in wild and crop plants, but life-history transitions are poorly understood from both fundamental and applied perspectives (Lundgren and Des Marais 2020). Life histories are complex trait syndromes with multiple components that often show consistent correlations (reviewed in Friedman and Rubin 2015; Friedman 2020; Lundgren and Des Marais 2020). In drought-intolerant Mimulus, perennial stolons (or rhizomes) are the key for overwintering after survival through summer, and loss of stolons/rhizomes is diagnostic of annuality in multiple species (Hall and Willis 2006; Lowry and Willis 2010; Nelson et al. 2021). Yellowstone thermal AH plants were dramatically more annual than PH plants, producing fewer stolons, more reproductive branches, and a twofold higher ratio of sexual to asexual reproduction (Table 1, Fig. 1C). A strong negative correlation between stolon and flowering shoot number (Fig. 1C) may reflect a genetic tradeoff in meristem allocation (Friedman and Rubin 2015; Friedman 2020) . However, unlike many systems, greater allocation to sexual reproduction in annuals did not reflect a consistent shift to earlier flowering (i.e., a live-fast, die-young strategy).
Flowering time under summer-like conditions showed high family-level heritability and was significantly bimodal within annuals but exhibited only weak AH–PH differentiation (Table 1). This contrasts with widespread M. guttatus ecotypes, where annuals generally exhibit a “fast” strategy characterized by rapid flowering (Kooyers et al. 2015; Troth et al. 2018) and stolon number and flowering time are positively genetically correlated in hybrids (Lowry and Willis 2010; Friedman et al. 2015). High variation among AH plants may reflect experience relaxed or reversed selection on intrinsic flowering speed, as the most extreme thermal sites (e.g., AHQT) experience an extended winter-spring growing season (November–June; Lekberg et al. 2012). In addition, genetic variation in critical photoperiod cues (Lekberg et al. 2012), likely uncouples developmental speed from realized flowering time in the wild. As with other studies of edaphic adaptation where phenology in common gardens do not necessarily reflect patterns of selection (e.g., Sianta and Kay 2021), abundant intrinsic flowering time variation within AH M. guttatus underlines the complexity of phenological traits. Nonetheless, the disconnect between annuality and fast flowering in YNP suggests that common correlations among life-history components may reflect finely tuned natural selection rather than intrinsic tradeoffs (see also Lundgren and Des Marais 2020; Friedman 2020; Nelson et al. 2021).
Strong reductions in stigma–anther separation (aka herkogamy) in AH flowers (Fig. 1, Table 1) likely promote autogamous self-pollination (Barrett and Harder 1996; reviewed in Sicard and Lenhard 2011; Opedal 2018), providing reproductive assurance during spring flowering prior to pollinator emergence. Low stigma–anther separation as the first step toward routine selfing is predicted by natural selection (Fishman and Willis 2008) and experimental evolution (Bodbyl Roels and Kelly 2011) in the absence of pollinators, as well as by the high evolvability of herkogamy across plant populations (reviewed in Opedal et al. 2017). Across the M. guttatus complex, derived selfer species also exhibit early flowering in ephemeral habitats, even relative to sympatric M. guttatus annuals (Martin and Willis 2007; Ferris et al. 2014; Kenney and Sweigart 2016). Other close selfer-outcrosser pairs show similar habitat/phenology associations (e.g., Pettengill and Moeller 2012; Briscoe Runquist et al. 2014). However, unlike these derived selfer taxa, AH plants likely retain the option of pollinator attraction and outcrossing—even the smallest AH corollas are absolutely larger than those of many highly outcrossing annual M. guttatus (e.g., Bodbyl Roels and Kelly 2011). Two nonexclusive mechanisms, adaptive shifts in energy investment after selfing becomes routine (Charlesworth and Charlesworth 1981) or fixation of formerly deleterious recessive “small” alleles by drift once pollination attraction is unnecessary (Fishman et al. 2002), likely contribute to the slight reductions (on average) in corolla size in AH plants. In some extreme early-drying AH sites (e.g., AHQT) plants may rarely encounter pollinators, promoting corolla reduction via both mechanisms. At others (e.g., Shoshone Geyser Basin, where AH and PH plants were co-flowering in late July), AH plants likely interact with pollinators and PH mates, and thus maintain larger corollas through selection and/or gene flow.
Correlated floral and environmental variation in YNP provides a rare opportunity to investigate the causes and consequences of mating system variation in its very early stages (Whitehead et al. 2018). Our estimates of FIS suggest abundant and structured variation—individual inbreeding coefficients were shaped by habitat (Fig. 4), presumably via diverse mechanisms, and (in AH plants) also associated with heritable phenotypes for four traits (Table 5). The negative correlation of stigma–anther separation with parental inbreeding coefficient in YNP annuals supports herkogamy's importance to autogamous self-pollination (reviewed in Opedal 2018). Similarly, the negative association of FIS with first flower height is likely a proxy for extreme phenology, as short stature adapts plants to the narrow boundary layer of winter-warm air in thermal crusts (Lekberg et al. 2012). The positive association of corolla width/length ratio with FIS is unexpected, as selection for efficient autogamy favors relatively narrow corollas (Fishman and Willis 2008), and perhaps reflects inbreeding depression of this trait in a subset of PH plants. The negative correlation between pollen viability and FIS within AH plants (Table 5) also suggests variation in genetic load, as did the higher pollen viability of experimentally inbred AH versus PH plants (Table 1). However, because AH–PH differentiation largely matches previous common gardens with outbred plants (Lekberg et al. 2012), inbreeding depression is unlikely to account for the overall phenotypic patterns.
The phenotypic diversity of thermal annual M. guttatus (Fig. 1) may in part arise from the distinct genetic basis of their life-history shift, which is independent of the widespread DIV/inv8 inversion polymorphism (Fig 4). DIV1 controls range-wide variation in numerous traits beyond stolon production (Hall et al. 2010; Lowry and Willis 2010; Lowry et al. 2019). By packaging co-favored variation into alternative haplotypes spanning 100s genes, such inversions can accelerate local adaptation in the face of gene flow (Kirkpatrick and Barton 2006). However, suppressed recombination in heterozygotes for established alternative haplotypes may also constrain adaptation to novel habitats. Although we cannot yet say why the widespread DIV1 inversion polymorphism was not used to adapt to novel annual habitats in YNP or what underlies the convergent evolution of annuality there, key life-history traits clearly evolved independently from both genetic and ecological perspectives. Unlike DIV1, inv5 has not been associated with life-history traits in QTL mapping (Hall et al. 2006; Lowry and Willis 2010; Friedman 2014; Friedman et al. 2015), but elevated FST in YNP mirrors inland annual–coastal perennial differentiation in this region (Gould et al. 2017). The only known phenotypic association of inv5 region is with vernalization requirement in hybrids between inland and coastal perennials (Friedman and Willis 2013), suggesting it may contribute to elevational or climatic adaptation within perennials. Selection on similar phenological cues, and/or unmeasured below-ground or physiological traits, may explain YNP differentiation across inv5. Finally, because our ddRAD scan did not reveal extended elevation of FST elsewhere in the genome (Fig. 5), correlated trait shifts in YNP are likely not coordinated by a novel large (>5 Mb, like inv5 and DIV1) inversion.
A LITTLE GENE FLOW GOES A LONG WAY: HABITAT AND PHENOTYPIC VARIATION INFLUENCE INDIVIDUAL MATING PATTERNS, BUT ONLY LEAD TO SUBSTANTIAL CROSS-HABITAT REPRODUCTIVE ISOLATION IN MICROALLOPATRY
Patterns of genome-wide genetic variation in YNP M. guttatus illustrate three distinct outcomes of strong natural selection on life-history and reproductive traits across a complex habitat matrix. First, genetic variation was largely structured by geography rather than ecology, with AH–PH adaptation occurring on a background of abundant genetic exchange within each of multiple regional populations. Second, despite the general lack of habitat-associated population structure, local adaptation and direct environmental effects generate habitat-specific differences in individual inbreeding coefficient and isolation by distance. Third, one large thermal annual population (AHQT) exhibits the signatures of incipient (but still reversible) speciation. These population genetic outcomes of life-history and mating system divergence are a microcosm of those seen across the entire M. guttatus species complex, as well as broadly across plant species. Manifested over short spatial (and likely temporal) scales in this unique system, these results provide a window into evolutionary processes often confounded by geography and multiple layers of reproductive isolation.
Patterns of genomic variation across all major thermal basins demonstrate that shared AH–PH phenotypic divergence generally represents adaptation in the face of gene flow. Multiple clustering approaches (Fig. 2) and estimation of the effects of habitat within the context of geographical structure (Tables 2 and 3), found little genome-wide differentiation between AH–PH plants. This parallels the predominantly geographical structure of annual and perennial ecotypes M. guttatus across the species range (Oneal et al. 2014; Twyford and Friedman 2015; Gould et al. 2017). Low habitat-specific differentiation also characterizes the emergence of dune-specific ecotypes in Helianthus and Senecio (Andrew et al. 2012; James et al. 2021), abundant hybridization between microhabitat-adapted serpentine Monardella species (Kay et al. 2018) and weak habitat-associated population structure in succulents from a South African edaphic mosaic (Musker et al. 2021). However, this finding contrasts with the preponderance of IBE found in a review of many systems (Sexton et al. 2014), though IBD was predominant in plants. Of course, environments (and the traits they shape) matter for gene flow in this system (as evidenced by the significant habitat effects in Table 3 and Fig. 4); however, at the spatial scales that we sampled, geography is clearly the largest barrier to (neutral) genetic exchange.
In the absence of geographic barriers, theory predicts that major (and antagonistically pleiotropic) loci are necessary to generate and maintain phenotypic differentiation resistant to gene flow (Yeaman and Whitlock 2011). For Mendelian traits, such as pigmentation (Schemske and Bierzychudek 2001; Jones et al. 2018) or copper tolerance (Lee and Coop 2017), phenotypic sorting by strong selection in adjacent habitats may generate only low migration load. However, maintaining polygenic multitrait syndromes (such as life-history strategies) in the face of gene flow can generate high load or local maladaptation. Thus, as theory predicts (Kirkpatrick and Barton 2006), complex alternative strategies are often associated with chromosomal inversions, which suppress recombination (in heterozygotes) across large genomic regions containing many functionally diverse genes (Tigano and Friesen 2016; reviewed in Mérot et al. 2020). For example, in the dune Helianthus petiolaris system (Andrew et al. 2012), multiple chromosomal inversions appear to be key to the maintenance of locally adapted ecotypes (Huang et al. 2020). Here, we can rule out re-use of the widespread annual–perennial DIV1/inv8 inversion and do not identify similarly large outlier regions, but the genetic basis of correlated trait divergence (Fig. 1c) awaits further work.
Despite the predominance of geographic structure, reproductive adaptation to the unique temporal niche created by thermal AH habitats nonetheless leaves genomic signatures (Figs. 3 and 4, Tables 4 and 5). Shifts in mating system profoundly should affect patterns of individual genetic variation, as well as population genetic diversity and connectivity (reviewed in Wright et al. 2008, 2013; Barrett et al. 2014; Hu 2015). Over the short term, a shift to exclusive self-fertilization distributes existing variation among increasingly homozygous individuals. However, in established plant populations or species that have evolved the floral selfing syndrome (Sicard and Lenhard 2011), genetic diversity is often further minimized by low effective population size, an ecological propensity for bottlenecks, and accentuated background selection (St Onge et al. 2011; Barrett et al. 2014; Brandvain et al. 2014; Barrett and Harder 2017; López-Villalobos and Eckert 2018). In most AH M. guttatus, we see something closer to the expectation for a recent shift in mating system. In aggregate, each AH “subpopulation” carries nearly the same genetic variation (both in identity and quantity) as nearly PH subpopulations (Table 4), but that variation is (on average) more homozygous in AH individuals (Fig. 4). Furthermore, AH plants were relatively isolated from each other and PH plants at short spatial scales (<1 km), while AH–PH and PH–PH pairs were relatively isolated at intermediate distances (Fig. 3). Habitat effects at short spatial scales may also reflect clonality in PH plants but persisted when the 10 most close genetic pairs (possible clones; 9 PH, 1 AH, all within 10 m) were removed (data not shown). Few studies have examined within-population variation in outcrossing rate (but see Takebayashi et al. 2006) and direct measures of individual outcrossing rates (e.g., Colicchio et al. 2020) will be necessary to tease apart the contributions of the temporal/spatial environment and reproductive phenotypes on patterns of mating and genetic relatedness in YNP M. guttatus. However, our finding that individual inbreeding history is phenotypically and environmentally predictable (Fig. 3, Table 5) suggests novel opportunities for investigating the early dynamics of mating system evolution.
Overall, our results indicate that a multi-trait adaptive syndrome, including floral traits promoting 100% autogamous self-pollination, has evolved and is maintained within the context of regional genetic exchange. Even the most extreme AH individuals appear to be built from essentially random subsets of local PH variation, plus alleles at a limited number of loci under selection. Given the spatial and temporal patchiness of the YNP geothermal matrix (Figs. 1 and 2), AH-adapted alleles likely have an extensive history of transiting through relatively contiguous PH populations, and then reassembling (with help from selection as well as inbreeding) in distant or newly erupted thermal annual sites. This might resemble, on a vastly smaller spatial and temporal scale, the global dynamics of sticklebacks, where (to a large extent) local adaptation to newly appearing freshwater habitats occurs from standing variation persisting as rare maladaptive variants in the marine environment (Colosimo et al. 2005; Nelson and Cresko 2018). This scenario strongly contrasts with the idea that mating system and flowering phenology act as “magic traits” whose divergence can generate sufficient reproductive isolation to initiate plant speciation in sympatry (e.g., Savolainen et al. 2006). Here, despite shifts in mating system and phenological traits sufficient to generate predictable habitat differences in individual outcrossing rate and connectivity, we do not see the build-up of population-level reproductive isolation. Although definitions of species vary (Harrison 2012), this is the exact opposite of speciation (i.e., the maintenance of genome-wide genetic continuity despite strong natural selection on reproductively isolating traits).
The one exception to the overall pattern, AHQT, provides a rare window into an alternative evolutionary outcome of strong microgeographic selection in plants–speciation by mating system shift. Although plants from this population share a common thermal annual phenotype with many other AH plants, they are highly differentiated genome-wide from all other populations (FST ∼ 0.2) and showed reduced π, polymorphism, and heterozygosity despite being sampled over a similar spatial scale. Indeed, the high differentiation of AHQT in this and previous studies (Lekberg et al. 2012; Hendrick et al. 2016) is comparable to values for genome-wide FST for cryptic species of Eucalyalptus and Silene recently identified at much larger spatial scales (Binks et al. 2021; Kahl et al. 2021). High differentiation and low diversity of AHQT also parallels that seen in a (likely selfing) solftara specialist (Nagasawa et al. 2020); however, unlike that sedge and a highly selfing Agrostis grass that also colonizes our YNP thermal areas (Tercek and Whitbeck 2004), AHQT exhibits de novo mating system evolution and reproductive isolation over a scale of meters.
What makes the AHQT population so special? AHQT's genetic distinctness undoubtedly depends on the extreme ecology of this large and uniformly geothermal site, where soils reach 65°C in summer and there is no source of soil moisture other than melting snow. However, the novel trigger of AHQT's differentiation seems to be its discrete geographic setting—even the mildest thermal areas at AHQT are separated by ∼200 m gap of no M. guttatus habitat from the nearest nonthermal population, the late-flowering bog perennial AHQN (Hendrick et al. 2016). This sharp habitat boundary plus geographical gap prevents gene flow via intermediate populations, facilitating both unimpeded thermal-soil specialization and the neutral differentiation by drift typical of established selfers. A perfect storm of habitat-specific selection for reproductive assurance, drift via high selfing rates, and very low migration likely recapitulates the early stages of speciation in numerous derived selfing taxa (Barrett et al. 2014). Alone, each factor would be insufficient to fully isolate AHQT over such a short spatial scale, but all together they appear to allow the first steps toward speciation. Thus, while divergence in “magic traits” like mating system or flowering time undoubtedly contributes to the evolution of reproductive isolation in diverse geographical contexts, a boost from space (plus time) may be necessary for barriers to develop to the point that isolation can persist in full sympatry. In obligate selfer M. nasutus, which often self-pollinates in the bud and doesn't open flowers to pollinators at all, that point was likely reached before its spread into extensive range overlap with progenitor M. guttatus (Martin and Willis 2007; Kenney and Sweigart 2016). Similarly, allopatric isolation appears to have been key to the evolution of a selfing subspecies of Clarkia (Pettengill and Moeller 2012). At AHQ, speciation may continue down that path to the point of no return but would still be easily reversed by the emergence of a warm stream allowing intermediate-flowering M. guttatus to bridge the temporal/ spatial gap. Nonetheless, the current isolation of AHQT (in the context of rampant gene flow elsewhere) suggests that both geographic discontinuity and reproductive trait divergence may be necessary to effectively shut down gene flow genome-wide and lead to speciation.
Conclusions
The yellow monkeyflowers of YNP exhibit dramatic life history, growth form, and reproductive trait adaptation to the novel edaphic environments created by geothermal activity. This microgeographic divergence parallels differentiation between widespread annual and perennial ecotypes range-wide but has a novel genetic basis and reflects the selective pressures of the unique YNP habitat(s). Except for the extreme and isolated AHQT population, thermal annual plants maintain multi-trait adaptation in the face of homogenizing gene flow across the habitat matrix, with geography the primary factor structuring genetic variation on the landscape. Nonetheless, thermal annual individuals exhibit elevated inbreeding coefficients and isolation from neighbors, providing rare insight into the early stages of mating system evolution. Together, these findings have important implications for understanding the (parallel) evolution of trait syndromes, the structuring of genetic variation by intrinsic and extrinsic factors, and the limits to sympatric speciation.
AUTHOR CONTRIBUTIONS
KMK conducted most of the field, greenhouse, and lab work, as well as the bioinformatic analyses, as part of his M.S. thesis under the supervision of LF. CB performed some of the population genetic analyses and assisted with data curation. TCN developed genomics protocols and assisted with lab work and bioinformatics. LF conceived of the research, assisted with field, greenhouse, and lab work, conducted phenotypic and downstream genetic analyses, and constructed most figures. The manuscript was primarily written by LF and KMK, with contributions and editing from all authors.
ACKNOWLEDGMENTS
We are grateful to H. Anderson, A. Carlson, and other Yellowstone National Park staff for facilitating research in Yellowstone National Park, which was conducted under permits YELL-2011/2017/2018-SCI-5834. We thank P. Breigenzer, F. R. Finseth, R. Hanes, M. McIntosh, S. R. Miller, C. L. Pierpont, A. Lapsansky, and M. Hendrick for assistance with field, greenhouse, and/or lab research, and D. Xing of the University of Montana Genomics Core Facility for material support with genotyping and genomics. The research was supported by NSF grants NSF DEB-1457763 and NSF OIA-1736249 to LF.
DATA ARCHIVING
Genomic data will be posted on the NCBI Sequence Read Archive under Bioproject PRJNA744896 and the phenotypic dataset is archived on Dryad at doi:https://doi.org/10.5061/dryad.dfn2z353s.
CONFLICT OF INTEREST
The authors declare there is no conflict of interest.
REFERENCES
———.
———.
———.
Associate Editor: Dr. Catherine Linnen
Handling Editor: Dr. Andrew McAdam
