


Abstract
The high energetic demands associated with the vertebrate brain are proposed to result in a trade-off between the pace of life-history and relative brain size. However, because both life-history and brain size also have a strong relationship with body size, any associations between the pace of life-history and relative brain size may be confounded by coevolution with body size. Studies on systems where contrasts in the pace of life-history occur without concordant contrasts in body size could therefore add to our understanding of the potential coevolution between relative brain size and life-history. Using one such system – 21 species of killifish – we employed a common garden design across two ontogenetic stages to investigate the association between relative brain size and the pace of life-history. Contrary to predictions, we found that relative brain size was larger in adult fast-living killifishes, compared to slow-living species. Although we found no differences in relative brain size between juvenile killifishes. Our results suggest that fast- and slow-living killifishes do not exhibit the predicted trade-off between brain size and life-history. Instead, fast and slow-living killifishes could differ in the ontogenetic timing of somatic versus neural growth or inhabit environments that differ considerably in cognitive demands.
Variation in brain size across species is largely driven by the cognitive benefits and the energetic costs of developing and maintaining a large brain (benefits: Lefebvre et al. 1997, Lefebvre et al. 2004; McDaniel 2005; Sol et al. 2008; Maklakov et al. 2011; Kotrschal et al. 2013, Kotrschal et al. 2015a, Kotrschal et al. 2015b; MacLean et al. 2014; Benson-Amram et al. 2016; Heldstab et al. 2016, and costs: Wang et al. 2012; Kotrschal et al. 2013; Gonzalez-Voyer et al. 2016). The brain typically consumes more energy per unit weight than other somatic tissues (Mink et al. 1981; Aiello and Wheeler 1995) and is consequently restricted in size by a species’ energy budget. An increase in brain size therefore requires an increase in energy input or an adjustment away from the energy allocated to other traits, such as development and reproduction (Expensive brain hypothesis: Isler and van Schaik 2009a). For example, across vertebrates, a larger brain is associated with greater maternal investment, larger neonates, reduced clutch or litter sizes, prolonged parental care, delayed maturity, and a later age of first reproduction (Martin 1996; Deaner et al. 2003; Iwaniuk and Nelson 2003; Kotrschal et al. 2013; Barton and Capellini 2011; Gonzalez-Voyer et al. 2016; Jiménez-Ortega et al. 2020).
Several studies have found that brain size, body size, and life-history often coevolve (e.g., in mammals: Barrickman et al. 2008; Isler and van Schaik 2009b; González-Lagos et al. 2010; Barton and Capellini 2011; Gonzalez-Voyer et al. 2016; fish: Kotrschal et al. 2013; amphibians: Liao et al. 2016; Yu et al. 2018, and birds: Sol et al. 2016; Jiménez-Ortega et al. 2020, but see Isler and van Schaik 2006). To investigate the relationship between relative brain size and life-history, most studies account for body size effects by including body size as a covariate in multiple regression analyses (e.g., Isler and van Schaik 2009b; González-Lagos et al. 2010). In this context, estimates of relative brain size are calculated on a scale – relative to body size – as deviations from the allometric relationship estimated across species. These deviations from the allometric relationship will however be affected by evolutionary changes in both brain size and body size (Smaers et al. 2012; Rogell et al. 2020). As body size often displays higher evolutionary rates than brain size (Gonzalez-Voyer et al. 2009b; Smaers et al. 2012; also see Tsuboi et al. 2018) any condition that imposes selection on body size may also result in correlated responses with the brain that are lower than would be expected from an evolutionary allometry perspective (e.g., evolutionary lags, Riska 1991; Smaers et al. 2012). This is potentially problematic due to the coevolution between life-history and body size (Deaner et al. 2003; Speakman 2005), where changes in relative brain size could be driven by adaptive changes in body size, rather than the trade-off between brain size and life-history (Smaers et al. 2012; Rogell et al. 2020). One approach is to assess the relationship between brain size and life-history in systems where body size and life-history are to a major extent biologically independent (Rogell et al. 2020). Specifically, by performing standard tests (e.g., multiple regression) on carefully chosen study systems, where changes in mean body size among life-history strategies are less likely to confound associations between life-history and relative brain size.
Here, we test for an association between the pace of life-history and relative brain size across 21 species of killifish (Aplocheiloidei). Killifishes display strong divergence in life-history strategy (Eckerström-Liedholm et al. 2017, Eckerström-Liedholm et al. 2019; Sowersby et al. preprint), but importantly, statistically non-significant divergence in mean body size between the different life-history strategies (Eckerström-Liedholm et al. 2017; Sowersby et al. preprint). Killifishes have undergone at least seven independent evolutionary transitions toward living in ephemeral habitats, where an ability to produce eggs capable of entering an extended embryonic diapause stage allows populations to persist during habitat desiccation (Furness et al. 2015; Furness 2016, Gonzalez-Voyer et al. in prep.). These annual killifishes have also evolved several fast-paced life-history traits necessary for living in time-limited ephemeral habitats, including on average 1.3 times faster growth rate, shorter development periods, and seven times higher reproductive rate (Eckerström-Liedholm et al. 2017; Sowersby et al. preprint). This is in comparison to non-annual killifish species, which often live in more permanent habitats and typically lack an embryonic diapause stage capable of surviving extended dry periods (Furness et al. 2015; Sowersby et al. preprint). Annual species also have short lifespans, including the species with the shortest recorded vertebrate lifespan: Nothobranchius furzeri (Genade et al. 2005; Blažek et al. 2013; Berois et al. 2015). One hypothesized benefit of inhabiting these harsh and time-limited ephemeral environments is that they are considered to be relatively inaccessible to many aquatic predators (Werner and McPeek 1994; Fraser et al. 1995) and attract fewer piscivorous birds, compared to more permanent habitats (Mamboleo et al. 2012).
There are now several studies demonstrating that fish can perform a broad range of cognitive tasks once considered limited to only mammals and birds, including learning (Beukema 1970; Brown and Laland 2003; Bshary and Grutter 2005; Kotrschal et al. 2013), cooperation (Bshary et al. 2006; Vail et al. 2014), tool use (Pasko 2010; Brown 2012), long-term memory retention (Brown 2001; Triki and Bshary 2020) and at least one species has demonstrated an ability to pass the mirror-mark test, which is considered a hallmark of advanced cognition across animal taxa (Kohda et al. 2019). Like other vertebrates, there is a clear link between having a large brain and greater cognitive ability in fish (Kotrschal et al. 2013; van der Bijl et al. 2015; Corral-López et al. 2017). Moreover, brain size and development in fish can also respond quickly to variation in the environment, such as predation risk (Kotrschal et al. 2015a, Kotrschal et al. 2017; Dunlap et al. 2019). Combined, these examples demonstrate that fish, like other vertebrates, can benefit from the behavioral flexibility associated with larger brain size.
In congruence with previous studies, we predicted a negative relationship between the pace of life-history and relative brain size in killifishes (Barrickman et al. 2008; González-Lagos et al. 2010; Yu et al. 2018). Specifically, we predicted that annual species would have relatively smaller brains and prioritize energy allocation toward growth and reproduction (see Kuzawa et al. 2014). Furthermore, we speculate that annual species could be subject to relaxed selection on cognitive performance and consequently brain size, due to the aforementioned lower risk of predation (Werner and McPeek 1994; Fraser 1995; Mamboleo et al. 2012) compared to non-annual killifishes inhabiting more permanent habitats. There are differences in body size between species of killifish, however importantly, there is no statistically significant difference in mean body size between annual and non-annual life-history groups (henceforth “fast” and “slow,” respectively; Eckerström-Liedholm et al. 2017). The killifish system appears to offer a seemingly ideal size-standardized system for investigating links between life-history and brain size evolution.
Similar to other fishes, killifishes likely display continuous, albeit attenuating growth of both the body and brain (Brandstätter and Kotrschal 1990). Differences in brain size may therefore evolve either as constitutive changes that are stable over ontogenetic stages (Kotrschal et al. 2013) or by changes to the ontogenetic brain size allometry, which would make differences in brain size across groups more apparent at certain body sizes (Dunlap et al. 2019). These mechanisms are not mutually exclusive and both represent significant implications for our study system. First, constitutive changes that are expressed early in ontogeny are likely to be dependent on maternal investment strategies (Gonzalez-Voyer et al. 2009a; Räsänen and Kruuk 2007; Kotrschal et al. 2013). Fast and slow-living killifishes have similar mean egg sizes but fast-living species have higher reproductive rates and the evolution of egg size is more constrained in this group (Eckerström-Liedholm et al. 2017), potentially modulating qualitative investment into offspring (Räsänen and Kruuk 2007). Second, fast and slow-living killifishes have similar mean adult body sizes, but differ on average in juvenile growth rates (Eckerström-Liedholm et al. 2017; Sowersby et al. preprint). Hence, any evolutionary changes in the energetic allocation between somatic versus neural tissues could yield substantial differences in relative brain size across groups. For example, populations of the slow-living killifish Anablepsoides hartii that inhabit high predation risk environments are both faster growing (Gilliam et al. 1993; Fraser et al. 1999) and reproduce at a higher rate (Walsh and Reznick 2009) compared to populations in low predation risk environments. Interestingly, high predation risk populations also have a steeper brain size allometry compared to low predation populations, meaning that for a given increase in body size, brain size increases faster in high predation risk populations (Dunlap et al. 2019). As a result, in our study we compared relative brain sizes between the life-history strategies at two key ontogenetic stages that differ in the relative importance of growth (juveniles) and reproduction (adults). Due to similar patterns of maternal investment, we predicted that relative brain size will be more similar in fast and slow-living species when they are juveniles, compared to when adults.
To explore the evolutionary relationship between life-history and brain morphology, we also investigated whether different life-history strategies impose selection on certain brain regions. The vertebrate brain consists of several distinct subregions that govern different bodily and cognitive functions (Nieuwenhuys et al. 2014) where the relative size of distinct brain regions likely indicates a species’ proficiency in the corresponding functional domains (Gonzalez-Voyer et al. 2009b; Iwaniuk and Hurd 2005; Striedter 2005). Theoretical predictions regarding a relationship between the pace of life-history and the size of specific brain regions are less clear than for the whole brain; thus, our investigation into relative sub-region sizes is largely exploratory and aimed at generating specific hypotheses for the study system. By testing relative changes in the size of brain regions across fast and slow-living species, we can also assess whether the brain develops mainly in a concerted or a mosaic pattern (see, e.g., Gonzalez-Voyer et al. 2009b, Finlay and Darlington 1995, Barton and Harvey 2000). Across taxa, there is often a shift in behavior from a focus on foraging to fuel growth to foraging to fuel reproductive effort (in addition to survival), during the transition from juvenile to adult life-stages. The higher rates of both growth and reproduction observed in fast-living killifish could be reasonably expected to result in changes in the relative size of brain regions across ontogeny, in accordance with a shift in the relative importance of different life-history traits (e.g. growth and reproduction).
Methods
STUDY SYSTEM
During 2017–2018, we reared individuals from 21 species of killifish (Aplocheiloidei) from the egg stage to either non-sexually mature juveniles (in their linear growth phase, Sowersby et al. preprint) or sexually mature adults (adults: Nspp = 17, Nind = 234; juveniles: Nspp. = 18, Nind = 110; see Supplementary Information for a description of fish maintenance, and Table 1 and Tables S1 to S7 for details on sample sizes, body size and age at sampling, and population origin). As environmental factors can induce plastic responses in brain size in fishes (Gonda et al. 2011), we kept all individuals in an environmentally standardized, common garden setting. The species included in the study were purposely selected to represent the five major evolutionary transitions between fast-living (annual) and slow-living (non-annual) life-history strategies (see Table 1; Table S1 and S2), characterized by the presence or absence of eggs capable of entering embryonic diapause (as per Furness et al. 2015). Previous studies have confirmed that fast-living species exhibit faster life-history traits, compared to slow-living species (reproduction: Eckerström-Liedholm et al. 2017, development and growth: Sowersby et al. preprint), and that these traits are strongly correlated across species (the dominant eigenvector of a principal component analysis explain 75.4% of the total variation; Eckerström-Liedholm et al. 2019). After hatching, a subset of individuals was reared in 0.75-L plastic boxes (although some individuals were then moved to 13-L tanks in species that grew quickly), and was weighed and dissected as juveniles (at ∼1 cm total body length) before they had reached sexual maturity (mean wet mass: 0.10 g; range: 0.015 to 0.34, no gonad tissue was observed during dissection). The remainder of the individuals were reared identically but were transferred to 13-L tanks 10 to 14 days after hatching. Each tank contained a mixed-sexed group of conspecifics of up to eight individuals, because some species produced more hatchlings, the number of groups and sample sizes are therefore not equal across species. Upon reaching sexual maturity, these individuals were weighed and then dissected (i.e. after sexual maturity, but prior to showing signs of senescence). Sexual maturity was determined by the presence of species-specific male coloration. All individuals, juveniles and adults, were euthanized with a lethal dose of benzocaine solution, with experimental procedures approved by the Ethical Committee in Stockholm, Sweden (license N132/15).
Sample sizes for juveniles and adults. The total number of individuals was 344
| Species | Juveniles | Adults |
|---|---|---|
| Fast-paced (annual species) | ||
| Austrolebias nigripinnis | - | 5 |
| Callopanchax toddi | 5 | 20 |
| Fundulopanchax filamentosus | 10 | 16 |
| Gnatholebias zonatus | - | 6 |
| Millerichthys robustus | 10 | - |
| Nematolebias whitei | 6 | 20 |
| Nothobranchius guentheri | 7 | 18 |
| Nothobranchius kadleci | 8 | 6 |
| Notholebias minimus | 5 | 4 |
| Ophtalmolebias constanciae | 6 | - |
| Rachovia sp. (Monteria) | 3 | - |
| Total | 60 | 95 |
| Slow-paced (non-annual species) | ||
| Aphyosemion striatum | 5 | 14 |
| Aphyosemion splendopleure | 6 | 19 |
| Cynodonichthys chucunaque | - | 18 |
| Cynodonichthys fuscolineatus | 5 | 7 |
| Epiplatys roloffi | 6 | 16 |
| Fundulopanchax cinnamomeus | 6 | 16 |
| Fundulopanchax scheeli | 5 | 21 |
| Kryptolebias marmoratus | 4 | - |
| Pachypanchax playfairii | 8 | 14 |
| Scriptaphyosemion cauveti | 5 | 14 |
| Total | 50 | 139 |
BRAIN AND BODY SIZE MEASUREMENTS
For olfactory bulbs, telencephalon, optic tectum, and hypothalamus, the measurements of the two lobes were taken separately and thereafter added together; while the cerebellum and medulla oblongata were treated as single-lobed structures. The total brain volume was calculated by summing all sub-region volume estimates. Adult brains were blotted and weighed after photography (precision: 0.01 mg; MT5, Mettler-Toledo GmbH, Giessen, Germany). Correlation between brain mass and calculated total brain volume was high (r = 0.93, N = 234), but due to the adhesive nature of some brains, which led to slight damage and loss of tissue, we proceeded to analyze brain volume rather than mass. Juvenile brains were not weighed.
PHYLOGENY
To control for phylogenetic non-independence, a phylogenetic effect was added to all analyses (Freckleton et al. 2002). For this purpose, we used a previously published time-calibrated phylogeny (Furness et al. 2015), with an additional four species inserted into said phylogeny (see Fig. 1). These additional species were inserted into the phylogeny based on taxonomic information and other published phylogenies. Specifically: Ophthalmolebias constanciae was placed within the main Simpsonichthys clade (Pohl et al. 2015), Nothobranchius kadleci alongside its sister species N. furzeri (Dorn et al. 2014), Scriptaphyosemion cauveti and Rachovia aff. brevis (“Monteria” population)” in their respective genera, and Millerichthys robustus was placed as a sister species of Rivulus cylindraceus (Gonzalez-Voyer et al. in prep). After these species were added, the tree was then pruned, leaving the overall structure of the tree unchanged. Therefore, the position of the additional species reflects the phylogenetic relationships that would be recovered from a tree with complete species sampling.
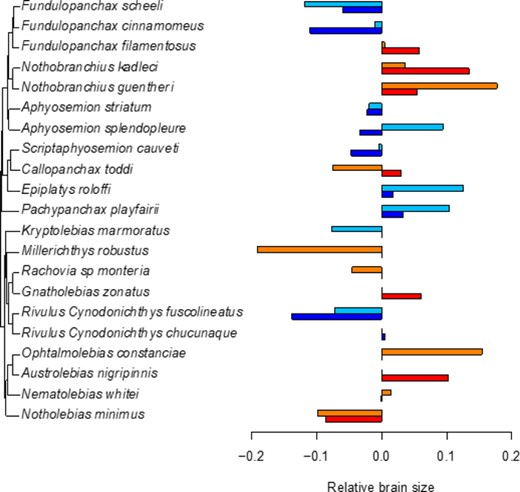
Phylogeny including all species for which we had samples (including species added based on previously published trees) with bar charts showing mean relative brain sizes (residuals from a phylogenetic linear model of log-transformed brain and body size). Blue colors refer to non-annual species, light blue for juveniles, dark blue for adults, while red colors refer to annual species, orange for juveniles, red for adults.
STATISTICAL ANALYSES
Relative brain-/sub-region size
To test for differences in relative brain- and sub-region size between the two life-history strategies, we fit models with absolute brain volume (mm3; log10-transformed) as a response variable, and the explanatory variables: log10-transformed body mass (mean centered based on species means), life-history strategy (“fast” and “slow”), the interaction between body mass and life-history strategy, and sex (“female” and “male”). In addition, species identity and phylogenetic distance were added as random effects (Felsenstein 1985; Gelman and Hill 2007). Since the adult allometric slopes, between brain and body size, differed for different species (ΔDIC = 25.7 for adults, ΔDIC = 1.5 for juveniles, random slopes < equal slopes), we chose to use random slope models. Adult and juvenile brain volumes were analyzed separately, but the models were identically applied, except for excluding sex as an explanatory factor in the juvenile analysis. In both adults and juveniles, we analyzed differences in intercepts and slopes of evolutionary static allometric slopes. As we only had one sampling point per individual, we did not obtain any estimates of ontogenetic slopes. In order to confirm that body size did not differ across the fast- and slow-living killifishes, we tested the effect of life-history strategy and sex (only for the adult model) on log10-transformed body mass, with species identity and phylogenetic relationship as random effects. Further, in the analysis above we used the classification of “annual” and “non-annual” as a proxy for fast and slow-living species. To validate our use of this proxy, we repeated the analysis (as described above), using the scores along the dominant eigenvector from a principal component analysis on growth rate, development time, and reproductive rate (see Eckerström-Liedholm et al. 2019; Sowersby et al. preprint). These scores represent indirect measures of the pace-of-life and were available for all but two species.
To analyze the relative volume of specific subregions of the brain (i.e., log10-transformed volumes of the olfactory bulbs, telencephalon, optic tectum, cerebellum, medulla oblongata, and hypothalamus), we fitted one model per sub-region. Each model contained the following explanatory variables: log10-transformed brain volume (mean centered based on species means), life-history strategy (“fast” or “slow”), and their interaction. Species identity and the phylogeny were added as random effects.
All models were analyzed using the MCMCglmm package Hadfield 2010 in R (R Core Team 2017). Fixed effects were fitted with flat priors, while random effects were fitted with parameter-expanded locally non-informative priors (Murphy 2007). The parameter sampling was run for 2.01M iterations (burn-in: 10,000; thinning-interval: 2000; posterior samples: 1000). Autocorrelations between parameter estimates were within the interval of −0.1 and 0.1 for all analyses. For all analyses, the assumption of normally distributed residuals was assessed using visual examination. In the results, statistics from the Bayesian models are presented with parameter estimates (β) followed by their 95% credibility intervals (lower bound; upper bound), and Bayesian P-values (PMCMC).
Growth rate and brain size
We examined relative brain size under stages and conditions where energetic investment into life-history traits were realized; i.e. the subject fish were growing juveniles in isolation and reproducing (i.e. sexually mature) adults in mixed-sex groups. However, rearing density has previously been found to suppress growth rates in fish, both in the laboratory (Ribas et al. 2017) and in the wild (Lorenzen and Enberg 2002; Vrtílek et al. 2019) and if body size has a stronger plastic response than brain size, this could potentially affect relative brain size. As the fast- and slow-living species differ in terms of growth (Sowersby et al. preprint), it is plausible that plastic effects (suppression of growth) will be stronger in those species with faster growth rates (Auld et al. 2010). Hence, consistent differences in relative brain size among the fast-living and the slow-living groups could arise due to plastic effects of growth changes, rather than differential energetic budgets. To explore these options, we analyzed the relationship between brain size and growth rate (species means, cm/day; Sowersby et al. preprint) using total brain volume as a response variable in a phylogenetic generalized least squares (PGLS) model with body mass and growth rate used as predictor variables, using a pruned version of the phylogenetic tree described above, with maximum likelihood estimation of λ (the strength of the phylogenetic signal; Freckleton et al. 2002). The model was fitted with the function pgls in the package caper (Orme 2018) in R.
Results
RELATIVE BRAIN SIZE
Contrary to our predictions, adult slow-living killifishes had smaller relative brain volumes than fast-living species [βlife-history: −0.0846 (−0.166; −0.0338), PMCMC = 0.014; Figure 2; Table S8]. However, we found no difference between slow- and fast-living species at the juvenile stage [βlife-history: 0.00368 (−0.0916; 0.114), PMCMC = 0.900; Figure 3; Table S9]. At the adult stage, males tended to have larger relative brain sizes than females, although this difference was not significant [βsex: 0.011 (−0.00192; 0.0254), PMCMC = 0.0820]. The evolutionary brain-body size allometries among species were hypoallometric (i.e. proportional brain size decreases with increasing body size) [fast-living species, adults – βslope: 0.461 (0.329, 0.563); slow-living species adults – βslope: 0.446 (0.327, 0.552); fast-living species, juveniles – βslope: 0.637 (0.426; 0.812); slow-living species, juveniles – βslope: 0.514 (0.297; 0.752)]. We found no support for a difference in the allometric slopes between the fast-living and the slow-living species [adults – βinteraction: −0.00693 (−0.176; 0.155), PMCMC = 0.846; juveniles – βinteraction: −0.139 (−0.382; 0.213), PMCMC = 0.496]. When we analyzed life- history as a continuous variable, rather than a dichotomous classification, we found similar results in terms of directionality and significance. As we did not have continuous scores for two of the included species, we only present this analysis in the supplementary material (Tables S8 and S9).
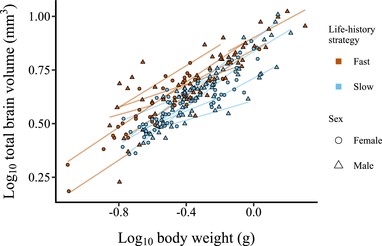
Allometric slopes of log10-transformed total brain volume (mm3) (sum of all subregions) to log10-transformed body weight (g) for adult killifish. Each data point represents an individual, and each line represents an allometric slope for a species calculated using separate regression models. The two life-history strategies are represented by blue (slow) and red (fast) colors, and the two sexes are represented by circles (females) and triangles (males).
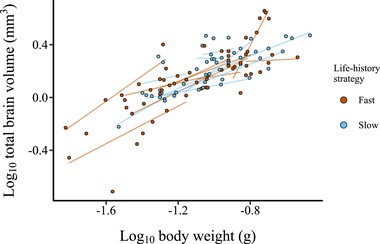
Allometric slopes of log10-transformed total brain volume (mm3) (sum of all subregions) to log10-transformed body weight (g) for juvenile killifish. Each data point represents an individual, and each line represents an allometric slope for a species calculated using separate regression models. The two life-history strategies are represented by blue (slow) and red (fast) colors.
RELATIVE SIZE OF BRAIN SUB-REGIONS
In adults, we found no significant main effect of life-history on the size of different brain subregions (all PMCMC > 0.11; see Table S10–S15). However, the allometric slopes of hypothalamus and optic tectum to total brain volume differed significantly between the fast- slow-living species, being steeper for hypothalamus [βinteraction: 0.128 (0.00427; 0.239), PMCMC = 0.038] and shallower for optic tectum [βinteraction: −0.1 (−0.147; −0.054), PMCMC < 0.001], in slow-living species. In juveniles we found significant effects of life-history strategy, where species with slow life-histories had smaller olfactory bulbs [βlife-history: −0.0655 (−0.15; −0.00878), PMCMC = 0.038], hypothalami [βlife-history: −0.0403 (−0.0867; −0.00324), PMCMC = 0.030], and cerebella [βlife-history: −0.0653 (−0.109; −0.00744), PMCMC = 0.024]; summaries for all sub-regions are found in Table S16–S21. Furthermore, we found significant interactions between life-history strategy and total brain volume on sub-region volume for juveniles, where the slope was shallower in slow-living species for the olfactory bulb [βinteraction: −0.319 (−0.513; −0.0815), PMCMC = 0.014] but steeper for the cerebellum size [βinteraction: 0.288 (0.101; 0.448), PMCMC < 0.001].
BODY SIZE
Although body size varied among killifish species, we did not detect any significant differences in mean body size between the fast- and slow-living species in either adults [βlife- history: 0.139 (−0.126; 0.388), PMCMC = 0.254; Figure 2, Table S22] or juveniles [βlife-history: 0.0281 (−0.24; 0.307), PMCMC = 0.692; Table S23]. Overall, males were larger than females [βsex: 0.171 (0.111; 0.262), PMCMC < 0.001].
GROWTH RATE AND BRAIN SIZE
In a subsample of 17 species (see Table S24), we found a non-significant trend (β = 3.73 ± 1.84 SE, t = 2.03, df = 14, P = 0.061, R2 = 0.781, λ = <0.01) toward juvenile somatic growth affecting relative brain volume in adults (Fig. 4). We note that the significance of this trend could change with increased power.
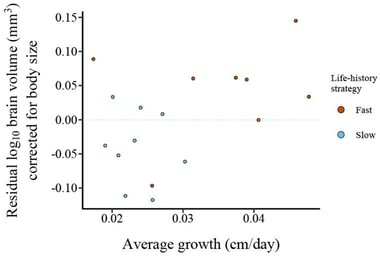
Residuals from PGLS model of species-average log10-transformed total brain volume (mm3) (sum of all sub-regions) to species-average log10-transformed body weight (g) of adult killifish is presented on the y-axis. The species-average slope of the growth curve (cm/day) for juvenile killifish is presented on the x-axis. Each point represents a species. The two life-history strategies are represented by blue (slow) and red (fast) colors.
Discussion
In contrast to our predictions, we found that killifish species with a faster pace of life-history had a larger relative brain. However, this pattern was only observed in adults and we found no relationship between life-history strategy and relative brain size in juveniles. Importantly, killifishes present contrasting life-history strategies but no significant difference in mean body size between fast and slow-living species. Our results therefore raise important questions about the generality of the well-supported trade-off between the pace of life-history and brain size. Below, we offer several adaptive and non-adaptive possible explanations for the patterns we observed.
Similar to other fishes, killifishes display continuous, albeit attenuating growth of both the body and brain. A previous study on a slow-living species of killifish found that individuals from low or high predation populations differed in their brain-body size allometry, with high predation populations having a steeper brain allometry (Dunlap et al. 2019). As a consequence, the observable effects of predation risk on relative brain size in this species are greater in smaller-sized individuals while negligible in larger fish. Across fishes, ranges in body size within a population are likely to be age-structured, and hence, any difference in brain size ontogenetic allometry has the potential to drive divergences in adult relative brain sizes (Dunlap et al. 2019). In contrast to slow-living species, fast-living killifishes have similar mean egg sizes between species (Eckerström-Liedholm et al. 2017), which suggests they have similar levels of maternal investment. In combination with our main result that significant differences in relative brain size between life-history strategies only occur in adults, the similar mean egg sizes among fast-living species leads us to speculate that these differences derive from different slopes of ontogenetic allometry (not measured in this study). Therefore, despite having significantly faster rates of growth, fast-living species appear to still allocate substantial amounts of energy to neural development.
Why do fast-living species have larger brains? Underlying one adaptive explanation is the prediction that the evolution of brain size involves a trade-off between the cognitive benefits and the energetic costs (Deaner et al. 2003; Kotrschal et al. 2013). For example, if fast-living species inhabit environments that impose greater demands on cognitive function, a larger brain could be adaptive provided they have the required energy budget. Initially, we predicted that fast-living species would experience lower demands on cognitive performance, mainly because their temporary habitats are likely to have fewer aquatic predators (Werner and McPeek 1994; Fraser et al. 1995). However, while we acknowledge assumptions based on habitat differences are speculative, previous studies have found that temporary or variable environments can impose higher cognitive demands and thus favor larger brain sizes, compared to more stable environments (van Woerden et al. 2012; Sayol et al. 2016). For instance, within and between species, gobies (Gobiidae) inhabiting intertidal rock pools have higher spatial cognition and larger juvenile brain sizes, compared to gobies from less spatially complex sandy bottoms (Brown and White 2014; White and Brown 2014, 2015). Similarly, pumpkinseed sunfish (Lepomis gibbosus) living in more complex shoreline habitats have larger brains (∼8.3%) than conspecifics living in relatively simpler open water habitat (Axelrod et al. 2018). In other taxa, such as black-capped chickadees (Poecile atricapillus), individuals from harsher environments significantly outperform conspecifics from more benign conditions in cognitive tasks (Roth et al. 2010). Whereas across species of mockingbird (Mimidae), song complexity - assumed to reflect cognitive ability - is more elaborate in species inhabiting areas where climate patterns are not that predictable, compared to species from more stable environments (Botero et al. Botero et al. 2009). These examples give weight to the prediction that harsh, spatially complex, and/or unpredictable environments may select for larger brains and increased cognitive abilities across animals (Godfrey-Smith 2002; Dukas 2004). In a similar manner, the often-unpredictable ephemeral habitats inhabited by fast-living killifishes could impose selection on increased cognitive ability, yielding larger relative brain sizes in comparison to slow-living killifish. Yet, some slow-living killifish species can migrate in and out of temporary habitats by moving over land, where they co-occur with fast-living species and are likewise subjected to unpredictable environmental conditions (Furness 2016; Livingston et al. 2018; Eckerström- Liedholm et al. Eckerström-Liedholm et al. 2019). Additional research is hence required to determine whether differences in relative brain size are associated to differences in cognitive ability between the life-history groups.
Despite our predictions, fast-living species may have an energy budget capable of producing and maintaining a large brain. A negative association between somatic maintenance and brain size seems evident in guppies (Poecilia reticulata), where a larger brain size is associated with both lowered investment into the immune system and faster rates of aging (Kotrschal et al. 2016, Kotrschal et al. 2019). Likewise, parasitoid wasps (Nasonia vitripennis) with larger brains age faster than parasitoid wasps with smaller brains (van der Woude et al. 2019). Among vertebrate taxa, fast-living killifishes have some of the highest recorded rates of aging (Genade et al. 2005; Blažek et al. 2013; Berois et al. 2015), which is commonly linked to decreased energetic investment into somatic maintenance (Kirkwood 1977). Hence, if fast-living killifishes reduce energetic investment into somatic maintenance, energy may be available for relevant life-history traits (e.g., growth) and a larger brain. The patterns we observed may alternatively be driven by selection for smaller brain sizes in slow-living killifishes. As mentioned previously, some slow-living killifish species do periodically move across terrestrial habitats to find new water bodies (Livingston et al. 2018). Exposure to air generally increases oxygen usage (Livingston et al. 2018), therefore it is possible that these species have specific adaptations to minimize their oxygen usage under conditions where typical fish respiration mechanisms are inefficient (e.g., on land), such as reducing the size of costly and oxygen-demanding tissues like the brain. Comparable patterns have been observed in birds, where migratory species have smaller relative brain sizes, presumably as a consequence of energetically demanding migratory behaviors (Sol et al. 2010). Although the mechanisms we have discussed are unavoidably speculative, there are clear arguments for both selection for higher cognitive ability in fast-living fish, and/or selection for tolerance to air-exposure in slow-living fish.
Possible non-adaptive explanations for brain size divergence among killifishes arise from evolutionary processes not directly linked to brain size. For example, differences in brain size could be a side effect of divergent selection on body shape, as many slow-living killifishes tend to have a more elongated body shape, compared to fast-living species (Sowersby et al. unpublished data). In general, fish with more elongated bodies, such as moray eels, tend to have smaller relative brain sizes (Bauchot et al. 2019; cf. Tsuboi et al. 2018). The head size of many slow-living species could be smaller relative to trunk mass compared to fast-living species, which would constrain the evolution of absolute brain size and result in smaller relative brain sizes. Another non-adaptive explanation could stem from differences in the magnitude of plastic responses in absolute brain size and body size (sensu Gonda et al. 2011). For example, studies on salmonid fish have indicated that neural growth is at least partly decoupled from somatic growth (Pankhurst and Montgomery 1994; Devlin et al. 2012; Kotrschal et al. 2012). Rearing density has also previously been found to suppress growth rates in both laboratory (Ribas et al. 2017) and wild fish species (Lorenzen and Enberg 2002). Preliminary analyses from a follow-up killifish study suggests that under a 7-day food restriction period, killifish growth in brain size is ∼3% less plastic (across ad libitum - restricted feeding regimes) than growth in body size (Näslund et al. unpublished data). If social conditions also reduce somatic growth more than neural growth, such effects could potentially explain our results and would further explain why these effects were not found in juveniles, which were kept in social isolation. The fact that we found a non-significant but positive correlation between growth rate and relative brain size demonstrates some support for this hypothesis. Lastly, we consider other possibilities such as maternal effects unlikely to have influenced our results, as the parent generation of all species were housed either in our own laboratory or in very similar captive conditions.
We detected significant differences in the relative sizes of certain brain regions in juveniles, but not in adults. Specifically, we found that olfactory bulbs, the cerebellum, and the hypothalamus were larger in fast-living species. Differences in brain regions between juveniles of fast- and slow-living species may have an adaptive explanation. For example, the hypothalamus is functionally linked to the release of growth hormones (Roberts and Savage 1978; Blanton and Specker 2007) and a larger hypothalamus in fast-living species could facilitate faster growth. Similarly, the olfactory bulbs and the cerebellum may be larger in fast-living species to increase foraging ability (e.g., through increased olfactory and motor function, respectively, Broglio et al. 2003; Rodríguez et al. 2005), which may be required to support fast growth rates. Our results hence suggest that the brain regions that are likely important for rapid growth and development in fast-living killifishes are larger compared to slow-living species. However, these differences are only observed in juveniles, which could be due to differences in growth rates across groups being larger in the juvenile stage compared to adults.
Differences in brain region size among fast- and slow-living species could also be a consequence of different developmental rates or a response to different cognitive demands at different ontogenetic stages. Previous studies on other fish taxa have found that relative sub-region sizes change through ontogeny. For instance, in salmonids, the proportional size (compared to total brain size) of the cerebellum, the olfactory bulbs, and the telencephalon, increases through the juvenile stage, whereas optic tectum size decreases (Näslund et al. 2012). In cyprinid fish, interspecific differentiation increases toward adulthood (Brandstätter and Kotrschal 1990); a contrasting pattern to our results. In our study, adults were sacrificed when all individuals had reached sexual maturity, as a standardized biological time point with respect to ontogenetic development (i.e., an evolutionary static allometry). Juveniles on the other hand were sacrificed before they reached sexual maturity and if fast-paced species were closer to maturity at sampling, the brain could be more reflective of the adult morphology.
Conclusions
Whether body size effects influence the often observed trade-off between brain size and life-history has remained unclear. This knowledge gap motivated our study on killifishes, which have distinct contrasts in fast and slow life-history strategies across species, but importantly non-significant variation in mean body size between life-history strategies. Interestingly, we did not find the predicted trade-off between brain size and the pace of life-history, but rather that adults from fast-living species had larger relative brain sizes, compared to slow-living species. In contrast to other studies, our comparison between these fast and slow life-history strategies was not confounded to a great extent by body size effects. Our results hence provide some challenge to the generality of the link between brain size and investment into costly life-history traits. In order to test the wider implications of our results, we recommend that future studies should aim to assess the relationship between the pace of life-history and relative brain size in carefully selected mammal and bird systems in which there are non-significant or minimal differences in mean body size across species. Finally, assays on cognitive abilities and physiology will be necessary to assess why a fast pace-of-life can result in larger relative brain size.
AUTHOR CONTRIBUTIONS
A.G.V., W.S., and B.R. conceived the study. All authors contributed to the planning and aims of the study. Data collection was performed by S.E. and W.S. Data analysis was conducted by S.E. and B.R. The first draft of the manuscript was written by W.S. and S.E., all authors contributed to the final version.
ACKNOWLEDGMENTS
This study was funded by Swedish Research Council (Vetenskapsrådet) Young Researcher Grants to BR and AGV (2013-5064 and 2013–4834, respectively) and small research grants from the Association for the Study of Animal Behaviour and the Alice & Lars Siléns Fond awarded to WS. We thank Alma Tiwe and Olivia Selander for assistance with animal husbandry, Niclas Kolm and Meet Zandawala for providing equipment and space to perform dissections, and Wouter van der Bijl for statistical advice. The authors declare no conflicts of interest.
DATA ARCHIVING
Data is available from the Dryad digital repository https://doi.org/10.5061/dryad.f7m0cfxwf
LITERATURE CITED
Associate Editor: M. Walsh
Handling Editor: A. McAdam
Author notes
Equal author contributions
Equal author contributions
