


Abstract
A current debate within population genomics surrounds the relevance of patterns of genomic differentiation between closely related species for our understanding of adaptation and speciation. Mounting evidence across many taxa suggests that the same genomic regions repeatedly develop elevated differentiation in independent species pairs. These regions often coincide with high gene density and/or low recombination, leading to the hypothesis that the genomic differentiation landscape mostly reflects a history of background selection, and reveals little about adaptation or speciation. A comparative genomics approach with multiple independent species pairs at a timescale where gene flow and ILS are negligible permits investigating whether different evolutionary processes are responsible for generating lineage-specific versus shared patterns of species differentiation. We use whole-genome resequencing data of 195 individuals from four Ficedula flycatcher species comprising two independent species pairs: collared and pied flycatchers, and red-breasted and taiga flycatchers. We found that both shared and lineage-specific FST peaks could partially be explained by selective sweeps, with recurrent selection likely to underlie shared signatures of selection, whereas indirect evidence supports a role of recombination landscape evolution in driving lineage-specific signatures of selection. This work therefore provides evidence for an interplay of positive selection and recombination to genomic landscape evolution.
Understanding the evolutionary processes that shape genome-wide patterns of diversity and differentiation within and between species is a central aim in population genomics. Advances in genome sequencing technologies have significantly improved our understanding of how variation is distributed across the genome (often referred to as the genomic landscape). In particular, it has become clear that the genomic landscapes of diversity and differentiation are often highly heterogeneous, with distinct “differentiation islands” emerging from the genomic background (Turner et al. 2005; Ellegren et al. 2012; Martin et al. 2013; Renaut et al. 2013). Comparing the genomic landscape across different species has shown that patterns of variation across the genome can covary across remarkably broad evolutionary timescales (Dutoit et al. 2017b; Van Doren et al. 2017; Vijay et al. 2017; Delmore et al. 2018). Additionally, there has been considerable interest in the evolution of coincident peaks of differentiation within independent species comparisons (Burri et al. 2015; Van Doren et al. 2017; Stankowski et al. 2019).
Early attempts to make sense of the genomic differentiation landscape largely interpreted the observed patterns in the framework of speciation with gene flow (Nosil 2008; Nosil et al. 2009; Feder et al. 2012; Via 2012). Under this model, in the early stages of speciation, low levels of differentiation across much of the genome were thought to be the result of ongoing gene flow. At the same time, local peaks of high differentiation (typically estimated with FST, a measure of relative differentiation) were thought to result from divergent selection or reproductive barriers (Turner et al. 2005; Feder et al. 2012; Via 2012). Within this framework, it is possible to identify the genomic regions underlying adaptation and speciation readily with a genome scan.
Although clear examples of divergence occurring in the face of gene flow do exist (Nadeau et al. 2012; Poelstra et al. 2014; Ottenburghs et al. 2020), subsequent reanalysis of some of this work demonstrated that there was often no evidence for differential gene flow across the genome underlying differentiation islands (Cruickshank and Hahn 2014). If FST peaks represented genomic regions that were resistant to gene flow, these peaks would also exhibit elevated DXY (an estimate of absolute sequence divergence) compared to the rest of the genome, which was often not the case (Cruickshank and Hahn 2014). Other models were suggested to better explain some of the common patterns observed in the genomic landscape without ongoing gene flow. One of these models proposes that elevated differentiation occurs due to post speciation selection in distinct genomic regions in separate species, sometimes referred to as selection in allopatry (Cruickshank and Hahn 2014; Han et al. 2017; Irwin et al. 2018). Another model, sometimes referred to as recurrent selection, is thought to better explain the often-observed evolution of coincident FST peaks across different species (Burri 2017). This model suggests that the same genomic regions experience selection repeatedly in two species and their common ancestor, leading to long-term reductions in nucleotide diversity (π), elevated relative differentiation (FST), and reduced absolute divergence (DXY; Cruickshank and Hahn 2014; Irwin et al. 2016, 2018; Han et al. 2017; Ravinet et al. 2017). Distinguishing between these two scenarios is thought to be possible by comparing patterns of the three statistics FST, π, and DXY. Because DXY is unaffected by current levels of diversity, under the selection in allopatry scenario, DXY is expected to be similar both within and outside of FST peaks (Cruickshank and Hahn 2014; Han et al. 2017). However, when selection has recurrently impacted a region from the common ancestor of two species, ancestral diversity will have also been reduced, leading to a reduction in DXY in FST peaks (Nachman and Payseur 2012; Cruickshank and Hahn 2014). We emphasize, however, that this pattern is primarily observed when overall species differentiation is low. DXY is affected by both ancestral diversity and the substitution rate, and as species differentiation increases ancestral diversity will have a comparatively lower impact on DXY. In fact, DXY may be higher in regions where many substitutions have been fixed by selection (Cruickshank and Hahn 2014). Accordingly, it is necessary to consider the divergence time of species comparisons to distinguish between different models of genomic landscape evolution based on comparisons of relative and absolute divergence.
An important aspect of these models is that either negative (also known as background) or positive selection may be responsible for generating differentiation islands (Cutter and Payseur 2013; Cruickshank and Hahn 2014; Burri et al. 2015; Irwin et al. 2018; Stankowski et al. 2019). Indeed, some authors have emphasized that background selection may play an underappreciated role in shaping the genomic landscape (Ravinet et al. 2017; Wolf and Ellegren 2017), and many studies have sought to distinguish the relative contribution of background selection and positive selection in shaping patterns of variation (McVicker et al. 2009; Elyashiv et al. 2016). Background selection has been emphasized in the recurrent selection model, and has been proposed to explain the evolution of highly correlated patterns in the genomic landscape across species (Burri 2017). The logic of this argument is that positive selection is unlikely to occur in the same genomic regions across such broad evolutionary timescales as coincident FST peaks are observed. When the distribution of genomic features such as recombination rate and gene density is well conserved between species, the targets of background selection will be similar (Burri et al. 2015; Vijay et al. 2016, 2017). The recurrent impact of background selection over time could potentially lead to large reductions in diversity where recombination is low, and in turn lead to peaks of FST when looking across species (Charlesworth et al. 1997). One implication of this hypothesis is that genomic regions deviating from a common pattern and showing lineage-specific signatures of differentiation may be more likely to result from positive selection (Berner and Salzburger 2015; Vijay et al. 2016; Wolf and Ellegren 2017). This hypothesis has been especially prominent in studies of birds, owing to the broadscale conservation of the recombination landscape and karyotype over a large evolutionary timescale (Ellegren 2010; Singhal et al. 2015). The widespread observation that patterns of nucleotide diversity and species differentiation are correlated with recombination rate is sometimes taken as support for the importance of background selection (Begun and Aquadro 1992; Begun et al. 2007; Corbett-Detig et al. 2015; Phung et al. 2016). Nevertheless, a recent spate of studies using simulation-based and analytical results have indicated that background selection alone is unlikely to generate the very severe reductions in diversity or corresponding peaks of FST frequently observed in genome scans (Matthey-Doret and Whitlock 2019; Rettelbach et al. 2019; Stankowski et al. 2019; Schrider 2020). The impact of different forms of selection in shaping the genomic landscape therefore remains an open and pressing question in the field.
Here, we use a comparative population genomics approach to understand the forces important in generating both shared and lineage-specific patterns in the genomic landscape of two independent species pairs of Ficedula flycatchers. The group of closely related black-and-white flycatchers is a well-studied system in the field of speciation genetics (Alatalo et al. 1990; Sætre et al. 1999; Qvarnström et al. 2010; Ellegren et al. 2012), comprising the four species—the atlas, collared, pied, and semi-collared flycatchers. Previous work has shown that a highly correlated genomic landscape has evolved among the four black-and-white flycatcher species (Burri et al. 2015); however, these species recently and rapidly diverged (∼1 million years ago), and much of the similarity might be explained by their recent shared ancestry (Nadachowska-Brzyska et al. 2013, 2016; Nater et al. 2015). We focus here on the collared and pied flycatcher species pair within the black-and-white flycatchers, and compare patterns of differentiation and selection in these species with a more distantly related species pair, the red-breasted and taiga flycatchers. The red-breasted and taiga flycatchers are estimated to have split from each other ∼3 million years ago (Hung and Zink 2014) and form a sister group to the four black-and-white flycatchers (Outlaw and Voelker 2006; Moyle et al. 2015). Although the broader Ficedula radiation contains many rapid speciation events, the divergence time between these two sister groups is much greater than, for instance, the divergence between any of the four recently split black-and-white flycatchers (Outlaw and Voelker 2006; Moyle et al. 2015). This system offers an excellent opportunity to perform a detailed analysis into the processes generating both shared and lineage-specific signatures of selection at a timescale where the contribution of gene flow and incomplete lineage sorting (ILS) is negligible. Because we focus on two independent sister species pairs, shared signatures of selection should represent either conserved patterns or similar processes acting in the two comparisons. Additionally, as these species represent a much deeper timescale than previous work focusing only on the black-and-white flycatchers, we expect a greater prevalence of lineage-specific signatures of selection across the genome.
We used existing genome resequencing data for pied and collared flycatcher, combined with resequencing performed here of red-breasted and taiga flycatcher samples. We first sought to identify regions of the genome showing shared and lineage-specific patterns of differentiation. We then addressed several questions regarding the evolutionary processes responsible for generating shared and lineage-specific patterns in the genomic landscape. First, is there evidence for selective sweeps underlying either lineage-specific and/or shared signatures of differentiation? Second, if shared patterns of differentiation do show signatures of selective sweeps, can these be explained by the retained signal of an ancestral sweep or by the action of recurrent sweeps in independent lineages? And finally, we ask whether there is evidence for changes in recombination rate underlying lineage-specific signatures of differentiation.
Materials and Methods
SAMPLING, DNA EXTRACTION, AND GENOME SEQUENCING
Population-level sequencing data were collated for four Ficedula flycatcher species, including 95 collared flycatcher (F. albicollis) (Dutoit et al. 2018), 20 pied flycatcher (F. hypoleuca) (Burri et al. 2015), 15 red-breasted flycatcher (F. parva), and 72 taiga flycatcher (F. albicilla). Collared flycatcher samples were from the island of Gotland and pied flycatcher samples were from mainland Sweden. Museum specimens were provided by the Bell Museum of Natural History for red-breasted flycatcher samples, originally collected from western Russia, and for taiga flycatcher samples collected from eastern Russia (Zink et al. 2008). Additionally, one sample of snowy-browed flycatcher (F. hyperythra) from Indonesia (Burri et al. 2015) was included as an outgroup to polarize polymorphisms.
Given that collared, pied, and snowy-browed flycatcher samples were sequenced in previous studies (Burri et al. 2015; Dutoit et al. 2018), we retrieved available sequence data from these samples. For collared flycatcher, we retrieved GVCF files (deposited at the European Nucleotide archive: accession PRJEB22864). For pied and snowy-browed flycatchers, we retrieved BAM files aligned to the collared flycatcher reference genome (deposited at the European Nucleotide archive: accession PRJEB7359). Base quality score recalibration (BQSR) was performed for all samples based on the best practice guidelines at the time sequencing was performed (using UnifiedGenotyper for pied flycatcher samples and HaplotypeCaller for collared flycatcher samples; McKenna et al. 2010; DePristo et al. 2011).
[Corrections added on July 12, 2021 after first online publication: The correct ENA accession number for the collared flycatcher samples added.]
VARIANT CALLING AND FILTERING
Raw reads for red-breasted and taiga flycatcher samples were aligned to the collared flycatcher reference genome, FicAlb1.5 (Kawakami et al. 2014) using BWA version 0.7.15 (Li 2013). Duplicates were marked using MarkDuplicates from Picard tools version 2.0.1 (http://broadinstitute.github.io/picard). Variant calling was performed using GATK version 3.8 or GATK version 3.6 (genotype GVCFs and HaplotypeCaller), following the best practices guidelines (McKenna et al. 2010; DePristo et al. 2011). BQSR was performed using bootstrapping with an initial set of filtered variants before performing a second round of variant calling. Variant calling was performed using GATK HaplotypeCaller, hard filtering thresholds were applied (QD < 2.0, FS > 60.0, MQ < 40.0, MQRankSum < −12.5, ReadPosRankSum < −8.0), and the variants that passed this threshold were used as input for BQSR.
After performing BQSR for red-breasted and taiga flycatchers, we performed a second round of variant calling with GATK HaplotypeCaller for pied, red-breasted, taiga, and snowy-browed flycatchers. We then took the resulting GVCF files, and the collared flycatcher GVCF files, and performed joint genotyping with all species combined. The same hard filtering thresholds as before were applied. Variants were repeat masked using the collared flycatcher repeat annotation (Suh et al. 2018) and multiallelic sites were removed. Genotype filters included a minimum sequencing depth of 5×, a maximum depth of 200×, and a minimum genotype quality of 30. Genotypes that did not pass genotype depth or genotype quality filters were set to missing data. After filtering for high-quality genotype calls, samples with greater than 20% missing data were removed from subsequent analysis, which included seven taiga flycatcher samples (remaining n = 65) and nine pied flycatcher samples (remaining n = 11). Reducing the number of samples allowed us to maximize the number of callable sites, and was justified by previous work (Dutoit et al. 2017a). Finally, for each species sites with greater than 10% missing data in that species were removed (see Table S1 for number of SNPs for each species). All analyses were performed for autosomes only.
IDENTIFICATION AND FILTERING OF COLLAPSED GENOMIC REGIONS
To avoid false signals of shared polymorphisms due to collapsed assembly regions, we identified potential collapsed duplications in our assembly and removed them from subsequent analyses. We expect that collapsed regions should show abnormally high heterozygosity at multiple sites. We used data from collared and taiga flycatchers to identify these regions, as these had the largest sample sizes, which reduces stochasticity. For both species, we calculated the percentage of heterozygous genotypes for all SNPs with a minor allele frequency of 10% or greater, separately for male and female samples to account for potential W-chromosome sequences. We used a custom python script to identify regions that showed an excess of heterozygosity in multiple SNPs, if a region contained at least three SNPs, each within 1000 bp of the next, with heterozygosity above 70% of individuals. We then merged regions identified as collapsed in collared and taiga flycatchers for both sexes, combining regions fewer than 5000 bp apart. This approach identified 2366 nonoverlapping putatively collapsed regions, accounting for 17,412,069 bp (1.8 %) of the collared flycatcher reference genome. Finally, we removed any SNPs that fell within those putatively collapsed regions.
ESTIMATES OF DIVERSITY AND SPECIES DIFFERENTIATION
In addition to π and DXY, we estimated genome-wide and window-based FST for two species comparisons: collared flycatcher versus pied flycatcher and red-breasted flycatcher versus taiga flycatcher. We chose these two comparisons because the genome-wide levels of sequence divergence of the other species comparisons indicate that these comparisons are at a stage of species differentiation where FST will become saturated for values close to 1. These two independent comparisons allow us to compare the genomic landscape at two very different stages of species differentiation, as sequence divergence between red-breasted and taiga flycatchers is almost twice as high as between collared and pied flycatchers. FST was calculated in 50-kb and 200-kb nonoverlapping windows with VCFtools using Weir and Cockerham's weighted FST (Weir and Cockerham 1984).
Finally, we estimated the number of shared SNPs between species as another measure of species differentiation. Because sample size has a large impact on the number of segregating sites, we randomly down-sampled all species to the lowest number of samples (n = 11). Shared SNPs were then defined as any site where two species have the same two alleles segregating within the 11 samples.
WINDOW-BASED TREE ANALYSIS
We investigated the possibility of phylogenetic discordance among these species with a window-based tree approach. Phylogenetic discordance can result from ILS when the time between successive speciation events is short or from gene flow when species boundaries remain porous. Although this approach will not reveal if gene flow has occurred between sister species, it will tell whether phylogenetic discordance could underlie the genomic patterns we see across the two independent species pairs.
Using mvftools (Pease and Rosenzweig 2018; https://www.github.com/jbpease/mvftools), we estimated the ML tree with raxml version 8.2.12 (Stamatakis 2014) in the same 50-kb and 200-kb genomic windows as used for estimating population genomic statistics. Trees were rooted with F. hyperythra, and the resulting phylogenies were analyzed with a custom python script, using the ete3 python package (Huerta-Cepas et al. 2016).
IDENTIFICATION OF SHARED AND UNIQUE FST PEAKS
We identified significantly elevated FST peaks in the two species comparisons with a permutation test. We first Z-transformed the observed FST values based on the mean and standard deviations of each individual chromosome. Z-transformation was performed at the chromosome level because the average value of FST was found to vary across chromosomes, in agreement with earlier observations in birds (Burri et al. 2015; Van Doren et al. 2017). We performed permutations by randomly shuffling the order of the genomic windows and applying a Savitzky-Golay smoothing filter to the shuffled Z- FST values, using a polynomial order of 3 fitted to seven windows (Savitsky and Golay 1964). For each window, we compared the original smoothed value of Z- FST to the distribution of smoothed values across 10,000 permutations, and calculated the P-value based on the number of permutations with a value of Z- FST as large or larger than the original value. Adjacent windows that were both considered to have significantly elevated FST (P < 0.05) were merged into a single FST peak.
We then identified regions of the genome that showed significantly elevated FST in both species’ comparisons. We defined a peak as shared if any part of the peak in one comparison overlapped with any part of a peak in the other comparison. Peaks that did not overlap at all with the other comparison were defined as unique. Following this procedure, we assigned each genomic window to one of four FST peak classes: no FST peak; collared and pied unique peak (CP unique); red-breasted and taiga unique peak (RT unique); and shared peak.
SWEEP DETECTION AND GENE ONTOLOGY ENRICHMENT ANALYSIS
We used two site-frequency spectrum (SFS)-based test statistics to look for signatures of selective sweeps across the genome in each species. These were Fay and Wu's H (Fay and Wu 2000) and composite likelihood ratio (CLR) tests (Nielsen et al. 2005), implemented in SweepFinder2 (DeGiorgio et al. 2016). Because both of these approaches use the unfolded SFS, we first polarized SNPs. To perform polarization, we separated collared and pied flycatchers and red-breasted and taiga flycatchers into two groups. We then used snowy-browed flycatcher as one out-group and alternated collared and pied or red-breasted and taiga as the second out-group to polarize SNPs for the respective in-group. We defined an allele as the ancestral state when any two of the three groups were fixed for the same allele. After identifying ancestral alleles, we removed sites where the ancestral allele formed a CpG or CpG-prone site (CpA, TpG, NpG, and CpN) to account for the high mutability of these sites (Hernandez et al. 2007; Bolívar et al. 2018).
To calculate Fay and Wu's H, we used VCFtools (Danecek et al. 2011) to obtain the derived allele counts, and used a custom python script using the scikit-allel library to obtain the derived SFS in 200-kb genomic windows (Miles et al. 2020). Fay and Wu's H was calculated following the equations (11) and (12) in Zeng et al. (2006). We obtained a significance threshold for H based on simulations (details provided below). We then ran SweepFinder2 with the -ug option using a precomputed background SFS, and a user-defined grid of locations for every variant. As with H, our significance threshold for CLR was based on simulations. Additionally, we calculated the average CLR in 200-kb windows.
To define significance thresholds for both H and CLR, we built a null model incorporating background selection using SLiM 3 with tree-sequence recording (Haller and Messer 2019; Haller et al. 2019). We performed 1000 simulations, across one 21-Mbp chromosome, using the genome annotation (Uebbing et al. 2016) and recombination map (Kawakami et al. 2014) estimated from collared flycatcher chromosome 11. We set population size to 10,000 and scaled our estimates of mutation rate and recombination rate by a factor of 10 to match a population size of 100,000, as estimated for the collared flycatcher (Nater et al. 2015; Smeds et al. 2016; Table S2). We chose selection coefficients using the distribution of fitness effects estimated in collared flycatcher (Table S2; Bolívar et al. 2018; Rettelbach et al. 2019) and allowed deleterious mutations to occur in exons and CNEs. We ran the simulations for 100,000 generations, before adding neutral mutations and performing recapitation using msprime (Kelleher et al. 2016). We then obtained a critical value for CLR of 46.25 and for Fay and Wu's H of −1.60 based on a P-value cutoff of P < 0.001.
To identify genomic windows showing a significant sweep signature, we used a permutation test to generate a null distribution for how many significant CLR values could be expected by chance in a 200-kb window. We performed 1000 permutations where we randomly reshuffled the order of CLR values for each species, and counted the number of significant CLR values in each 200-kb genomic window to obtain a threshold for significance of P < 0.05.
We performed a similar permutation test to estimate how many significant CLR sites could be expected by chance overlapping with annotated genes, again for a significance threshold of P < 0.05. We then retrieved gene annotations that overlapped with significant sweeps for each species, and performed a gene ontology (GO) enrichment analysis using ShinyGO version 0.61 (Ge et al. 2020). We tested for enrichment of GO terms for genes overlapping with sweeps uniquely in each species, as well as sweeps that were shared between the two independent sister species pairs. We used the collared flycatcher genome annotation (Uebbing et al. 2016) as the reference.
IMPACT OF GENOMIC FEATURES ON PATTERNS OF DIFFERENTIATION
We analyzed the impact of two genomic features, recombination rate and the density of functional elements, on patterns of diversity and differentiation. We used a pedigree-based recombination map from collared flycatcher (Kawakami et al. 2014), with the most fine-scale resolution of 200 kb. The proportion of a genomic window annotated as an exon or a CNE in collared flycatcher (Uebbing et al. 2016; Craig et al. 2018) was used as a proxy for density of functional elements within a genomic window (hereafter referred to as functional density). We then performed linear regression with the functional density as a predictor variable and multiple linear regression with both recombination rate and functional density as predictor variables for 50-kb and 200-kb windows, respectively. We log-transformed the recombination rate and square-root-transformed functional density (Fig. S1), and then estimated the variance inflation factor of the two predictor variables (VIF = 1.03). Separate analyses were performed for each species or species comparison to understand the variation in nucleotide diversity or differentiation explained by these genomic features. Additionally, we compared the distribution of recombination rate and functional density in genomic windows identified as different categories of FST peak.
All statistical analyses were performed in R.
Results
INDEPENDENT SPECIES COMPARISONS ACROSS DIFFERENT EVOLUTIONARY TIMESCALES
Genome-wide estimates of diversity varied moderately between the different species included in this study. Pied flycatcher showed the lowest nucleotide diversity (π = 0.0023), followed by red-breasted flycatcher (π = 0.0029), taiga flycatcher (π = 0.0030), and collared flycatcher (π = 0.0031). Estimates of divergence varied much more between species comparisons, with both DXY and FST between red-breasted and taiga flycatchers almost twice as high as between pied and collared flycatchers (Fig. 1A; Table S3). These estimates of differentiation are consistent with previous findings based on mitochondrial divergence between red-breasted and taiga flycatcher, which showed high levels of genetic differentiation despite the two long being considered the same species (Zink et al. 2008; Hung and Zink 2014). Additionally, the estimates of shared SNPs decreased greatly with increasing species differentiation (Collared and pied: 28.2%; red-breasted and taiga: 3.69%; collared or pied and red-breasted or taiga: 1.82–2.60%; Table S3).
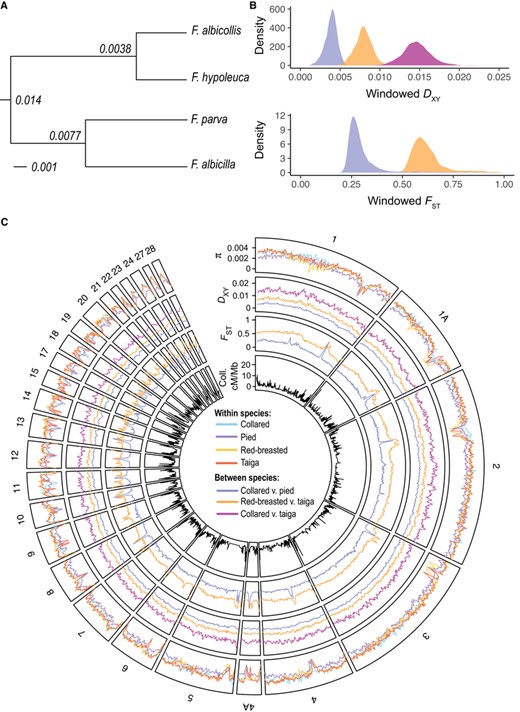
Genome-wide variation in diversity and divergence. Panel A shows the topology of relationships between the four species of flycatchers studied here, with node labels displaying genome-wide DXY. Panel B shows the distribution of DXY in collared flycatcher versus pied flycatcher (blue), red-breasted flycatcher versus taiga flycatcher (orange), and collared flycatcher versus taiga flycatcher (pink), and the distribution of FST in collared flycatcher versus pied flycatcher and red-breasted flycatcher versus taiga flycatcher for 200-kb nonoverlapping windows. Panel C shows variation in π, DXY, FST, and pedigree-based recombination rate in collared flycatcher (cM/Mb) across the collared flycatcher reference genome. A Savitzky-Golay smoothing filter (p = 3, n = 7) has been applied to π, DXY, and FST. Colors for single species are as follows: cyan, collared flycatcher; purple, pied flycatcher; yellow, red-breasted flycatcher; red, taiga flycatcher. Colors for species comparisons are as follows: blue, collared flycatcher versus pied flycatcher; orange, red-breasted flycatcher versus taiga flycatcher; pink, collared flycatcher versus taiga flycatcher.
Using genome-wide estimates of DXY and π, we calculated the divergence time for collared and pied as approximately 250,000 ya (0.436 CU), red-breasted and taiga approximately 1,000,000 ya (1.62 CU), and collared and pied compared to red-breasted and taiga as approximately 2,500,000 ya (3.76 CU; Table S3). We caution that the estimated split times here are more recent than previous estimates based on demographic modeling (Nadachowska-Brzyska et al. 2013, 2016; Hung and Zink 2014; Nater et al. 2015). Nevertheless, the range in divergence times highlights that the two independent species comparisons, that is, collared versus pied flycatcher and red-breasted versus taiga flycatcher, are at very different stages of species differentiation. This was also demonstrated by a window-tree analyses, which revealed that red-breasted and taiga flycatchers formed a reciprocally monophyletic group sister to collared and pied flycatcher in each of the 200-kb windows. The split between collared and pied flycatchers was less well resolved, with 173 windows (4.05%) having pied flycatcher nested within collared flycatcher. Phylogenetic resolution was worse in 50-kb windows, with the collared and pied flycatcher split not resolved in 4773 windows (27.6%), and the red-breasted and taiga split not resolved in only 16 windows (0.0924%). Moreover, as our goal in this study is primarily to investigate the processes underlying shared and lineage-specific signatures of selection at a timescale where gene flow and ILS are negligible, the distinct boundary between the two independent species comparisons demonstrates that this is an excellent system in which to study this question.
DIFFERENTIATION LANDSCAPES REVEAL BOTH SHARED AND LINEAGE-SPECIFIC FST PEAKS
To explore patterns in the genomic landscape at these different evolutionary timescales, we analyzed window-based estimates of diversity and differentiation in 200-kb nonoverlapping windows based on coordinates of the collared flycatcher reference genome (the same analyses performed in 50-kb nonoverlapping windows are provided as Supporting Information). For simplicity, throughout the remaining results we present data from the comparison between collared and taiga flycatchers as representative of the deepest evolutionary timepoint examined here, which includes all four possible comparisons between the two sister species groups. Results for all species comparisons can be found in the Supporting Information. Window-based estimates of each of π, DXY, and FST varied widely across the genome (Figs. 1B, 1C, and S2). All species showed a similar range in values of π estimated in 200-kb windows (Table S4). In contrast, the distribution of DXY in windows showed little overlap between the different evolutionary timepoints, as did the distribution of FST in the two species comparisons (Fig. 1B; Table S5).
We quantified the prevalence of FST peaks that were shared between both species comparisons (shared peaks) and FST peaks unique to one species pair (lineage-specific peaks). We found 127 peaks between red-breasted and taiga flycatchers and 107 between collared and pied flycatchers. Of these FST peaks, 56 peaks were shared in both comparisons (shared peaks), 71 peaks were unique to red-breasted and taiga flycatchers (RT unique), and 49 peaks were unique to collared and pied flycatchers (CP unique).
BOTH SHARED AND LINEAGE-SPECIFIC FST PEAKS SHOW SIGNATURES OF SELECTIVE SWEEPS
We performed scans for selective sweeps using Fay and Wu's H and CLR tests in each of the four flycatcher species. First, we compared the correlation between H and the average CLR in 200-kb windows. For each species, this correlation was significant, with the strongest correlation observed in taiga flycatcher (R = −0.574, P < 2.2 × 10⁻¹⁶) and the weakest in pied flycatcher (R = −0.0454, P = 0.00295; Table S6).
Next, to address whether positive selection could explain the evolution of either shared or lineage-specific FST peaks, we examined if there was evidence that sweeps tended to coincide with regions where we identified FST peaks. The CLR test, which provides fine-scale detection of sweeps, showed that sweep signatures tended to overlap with both shared and lineage-specific FST peaks (Figs. 2 and S3; Tables 1 and S7). Fay and Wu's H revealed fewer significant windows in each species compared to CLR (Table S6; Fig. S4), but the majority of these windows also coincided with either shared or lineage-specific FST peaks (Table S8). Additionally, most of the FST windows with a significant H overlap also showed a significant CLR overlap (Table S8). These results suggest that many of the FST peaks observed here are in fact the result of selective sweeps.
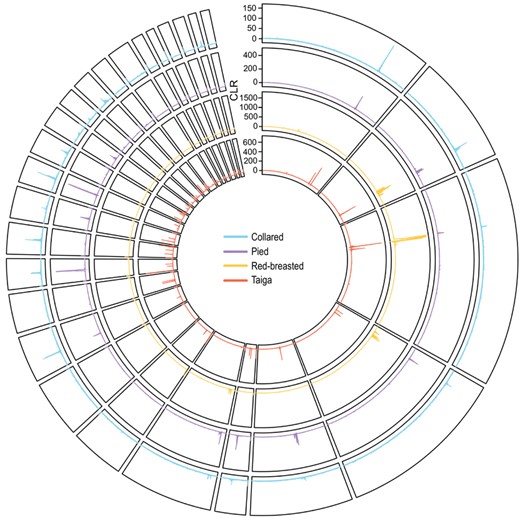
Genome-wide sweep signatures. Shown are smoothed CLR values for each species across the collared flycatcher reference genome. Colors for single species are as follows: cyan, collared; purple, pied; yellow, red-breasted; red, taiga.
Number of windows with significant sweep signatures for each class of FST peak. For each species, the number of 200-kb windows with a significant sweep signature based on a permutation test is shown for the four FST peak classes previously defined. In parentheses is the total number of 200-kb windows in each category. CP unique peaks are unique to collared and pied flycatchers, and RT unique peaks are unique to red-breasted and taiga flycatchers
| Number of windows with sweep overlap (total windows) | ||||
|---|---|---|---|---|
| Peak class | Collared | Pied | Red-breasted | Taiga |
| No FST peak | 0 (3655) | 2 (3655) | 9 (3655) | 6 (3655) |
| Shared FST peak | 7 (242) | 46 (242) | 71 (242) | 44 (242) |
| CP unique peak | 3 (154) | 9 (154) | 0 (154) | 0 (154) |
| RT unique peak | 0 (216) | 2 (216) | 36 (216) | 52 (216) |
We found that genes showing a significant signature of a sweep shared between the two independent species comparisons were enriched for GO terms relating to small GTPase binding (Table S9). These include genes with essential functions, such as cytoskeletal rearrangement, and are associated with a number of health conditions and diseases in humans (Stendel et al. 2007; Heasman and Ridley 2008; Fabrizi et al. 2009; Shirakawa and Horiuchi 2015). When looking at genes showing sweep signatures that were unique to a single species, we found GO enrichment for genes primarily associated with fatty acid metabolism and carboxylic acid binding in pied flycatcher (Table S9). These included a gene associated with fear response in humans (Deckert et al. 2017; Lueken et al. 2017). GO analysis in red-breasted flycatcher also included an enrichment for genes involved in small GTPase binding, as well as regulation of synaptic transmission, oxidized DNA binding, and methyltransferase activity (Table S9). We did not find a significant enrichment for GO terms in lineage-specific sweeps of collared or taiga flycatchers.
SUPPORT FOR A RECURRENT SELECTION SCENARIO DRIVING SHARED PEAKS
To distinguish between multiple scenarios of genomic landscape evolution (i.e., ancestral sweeps, recurrent selection), we examined how relationships between estimates of diversity and differentiation changed over time. In agreement with earlier observations within black-and-white flycatchers (Burri et al. 2015), the variation in π across the genome was significantly correlated among more divergent flycatcher species (Figs. 3 and S5; Table S10). Window-based estimates of π were strongly correlated between collared and pied flycatchers (Fig. 3A; R = 0.903, P < 2.2 × 10⁻¹⁶), but the correlation between π in different species appeared to weaken as the divergence time between the species increased (Figs. 3B and 3C; red-breasted and taiga R = 0.668, P < 2.2 × 10⁻¹⁶; collared and taiga R = 0.576, P < 2.2 × 10⁻¹⁶). At higher levels of species differentiation, the patterns of diversity appeared to become particularly dissimilar in windows with low diversity in at least one species (Figs. 3 and S5). This observation agrees with our above result that there is an increased prevalence of lineage-specific patterns in the genomic landscape between more distantly related species. Conversely, patterns of diversity appeared to remain quite similar in windows of intermediate and above-average nucleotide diversity, even in the most distantly related species comparison (Figs. 3 and S5).
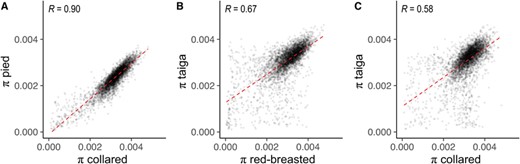
Correlations between levels of diversity at three evolutionary timescales. Correlations between window-based estimates (200-kb nonoverlapping) of nucleotide diversity are shown between (A) collared and pied flycatchers, (B) red-breasted and taiga flycatchers, and (C) collared and taiga flycatchers. All correlation coefficients displayed are significant (P < 2.2 × 10⁻¹⁶).
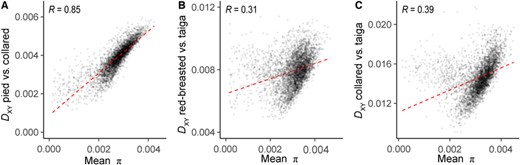
We then compared how the relationship among estimates of species differentiation, FST and DXY, changed over time. Although the correlation between π decreased with increasing differentiation, DXY between collared and pied flycatchers showed a strikingly high correlation with DXY between red-breasted and taiga flycatchers (Fig. 4A; R = 0.801, P < 2.2 × 10⁻¹⁶). Interestingly, although the FST landscape of collared and pied flycatchers was significantly correlated with the FST landscape between red-breasted and taiga flycatchers (Fig. 4B; R = 0.402, P < 2.2 × 10⁻¹⁶), the correlation was almost half as strong as observed among more closely related flycatcher species (R = 0.804; Burri et al. 2015). This again demonstrates the increased prevalence of lineage-specific patterns in FST, but suggests that the processes shaping patterns of DXY are remarkably conserved.
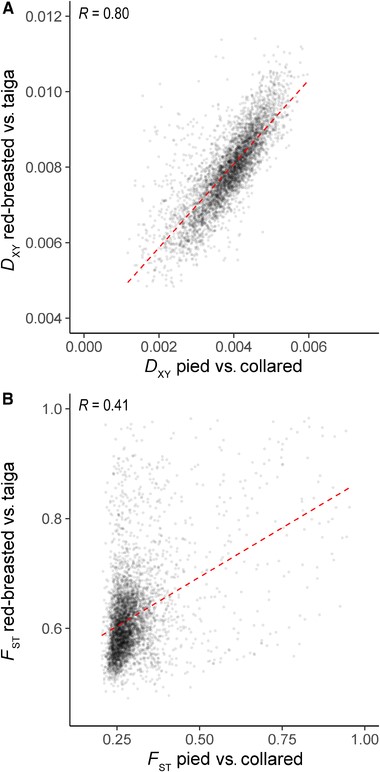
Correlations between measures of species differentiation among the species comparisons. (A) The correlation between estimates of DXY in 200-kb windows between pied versus collared flycatchers and red-breasted versus taiga flycatchers. (B) The correlation between FST estimated in the same 200-kb windows. Both correlation coefficients shown are significant (P < 2.2 × 10⁻¹⁶).
The relationship between measures of species differentiation and within-species diversity is also informative for our understanding of how the genomic landscape evolves over time. Between collared and pied flycatchers, π and DXY showed a very strong positive relationship (Fig. 5A; Table S10), which is consistent with their recent common ancestry. However, the strength of the relationships was much weaker when deeper evolutionary timescales were considered (Figs. 5B, 5C, and S6; Table S10). Intriguingly, when comparing red-breasted and taiga flycatchers or collared and taiga flycatchers it appeared that there was a different pattern in the relationship between π and DXY for genomic windows with the lowest estimates of π. As these are primarily the windows where we identified FST peaks, we compared the average window-based estimates of DXY in the four different FST peak classes. Average DXY between collared and pied flycatchers was lower in all FST peaks compared to windows with no FST peak, and was the lowest in shared FST peaks (Tables 2, S11, and S12). On the contrary, windows with shared FST peaks showed the highest average DXY for both red-breasted and taiga flycatchers, and collared and taiga flycatchers (Tables 2, S11, and S12).
Change in the strength of correlations between diversity and divergence over time. Shown is the relationship between DXY and mean π for each species pair estimated in 200-kb genomic windows, with increasing species differentiation: (A) pied versus collared flycatchers, (B) red-breasted versus taiga flycatchers, and (C) collared versus taiga flycatchers. All correlation coefficients displayed were significant (P < 2.2 × 10⁻¹⁶).
Average DXY (± SD) for three species comparisons for windows categorized by FST peak class. All 200-kb genomic windows are categorized as four different types of FST peak. These are as follows: no FST peak, shared FST peak, collared and pied unique peak (CP unique), and red-breasted and taiga unique peak (RT unique)
| Species comparison | No FST peak | Shared peak | CP unique | RT unique |
|---|---|---|---|---|
| Collared vs. pied | 0.00391 ± 0.000699 | 0.00336 ± 0.000931 | 0.00362 ± 0.00109 | 0.00377 ± 0.000690 |
| Red-breasted vs. taiga | 0.00789 ± 0.00101 | 0.00820 ± 0.00125 | 0.00802 ± 0.00128 | 0.00811 ± 0.000911 |
| Collared vs. taiga | 0.0145 ± 0.00165 | 0.0157 ± 0.00178 | 0.0154 ± 0.00182 | 0.0149 ± 0.00377 |
Initially, these results appear to be at odds with the expectations of a scenario where recurrent selection has generated shared FST peaks. Under this scenario, the expectation is that DXY in FST peaks will be lower compared to other genomic regions, as recurrent selection since the common ancestor will also have reduced ancestral diversity. However, as species differentiation progresses, ancestral diversity will contribute less to DXY compared to the input of substitutions. In regions where many substitutions have been fixed by, for instance, positive selection, DXY may in fact be elevated. Thus, the low DXY in FST peaks observed between collared and pied flycatchers is expected, as average DXY is not much higher than π within these species (DXY 1.4 times greater than π). However, DXY is 2.6 and 4.7 times higher than π between red-breasted and taiga and between collared and taiga flycatchers, respectively, and we expect a greater contribution of substitutions to DXY in these comparisons.
CHANGES IN RECOMBINATION RATE MAY UNDERLIE LINEAGE-SPECIFIC FST PEAKS
As recombination rate and gene density have been shown to be important factors in shaping genome-wide patterns of diversity (Nachman and Payseur 2012; Cutter and Payseur 2013), we were interested in whether changes in the distribution of these genomic features contributed to evolution of the differentiation landscape among these species. Genomic regions with lower recombination rate are expected to experience a wider extent of linked selection; conversely, a higher functional density may increase the frequency of selection. If recombination rate and functional density are conserved between species, the recurrent action of linked selection can cause both π and DXY to become reduced in the same genomic regions in both species. We would also predict both π and DXY to show a positive relationship with recombination rate and a negative relationship with functional density. As FST is influenced by within species diversity and can become elevated when diversity is low, the opposite relationships are expected between FST and recombination rate and functional density, with high FST tending to occur in regions of low recombination.
A pedigree-based recombination map and genome annotation are available only for the collared flycatcher species and we use these as estimates of recombination rate and exon and CNE density (used here as proxy for functional density) for all four species. We calculated π and DXY after removing sites that may be direct targets of selection (sites within exons or CNEs) to look for an impact of linked selection on diversity and divergence. For each species, multiple linear regression analysis showed a significant relationship between neutral π and both recombination rate and the functional density (Tables 3 and S13). Recombination rate showed a significant positive relationship with neutral π, and functional density showed significant negative relationship with neutral π. Notably, the R-squared was much lower for both red-breasted and taiga flycatchers compared with collared and pied flycatchers (Table 3). This provides indirect evidence that changes in the recombination landscape and/or the distribution of functional elements contribute to changes in patterns of diversity at deeper evolutionary timescales.
Relationship between recombination rate and density of functional sites with neutral nucleotide diversity (π) in 200-kb windows
| Collared π | Estimate | SE | T-value | P-value |
|---|---|---|---|---|
| ln(cM/mb + 1) | 0.000257 | 1.46 × 10⁻⁵ | 17.6 | <2.2 × 10⁻¹⁶ |
| Sqrt(density selection) | −0.00326 | 0.000105 | −31.0 | <2.2 × 10⁻¹⁶ |
| R-squared = 0.206 | ||||
| Pied π | ||||
| ln(cM/mb + 1) | 8.43 × 10⁻⁵ | 1.24 × 10⁻⁵ | 6.80 | 1.17 × 10⁻¹¹ |
| Sqrt(density selection) | −0.00297 | 8.93 × 10⁻⁵ | −33.2 | <2.2 × 10⁻¹⁶ |
| R-squared = 0.206 | ||||
| Red-breasted π | ||||
| ln(cM/mb + 1) | 0.000129 | 2.01 × 10⁻⁵ | 6.43 | 1.39 × 10⁻¹⁰ |
| Sqrt(density selection) | −0.00129 | 0.000145 | −8.92 | <2.2 × 10⁻¹⁶ |
| R-squared = 0.0236 | ||||
| Taiga π | ||||
| ln(cM/mb + 1) | 7.52 × 10⁻⁵ | 1.75 × 10⁻⁵ | 4.30 | 1.77 × 10⁻⁵ |
| Sqrt(density selection) | −0.00219 | 0.000126 | −17.4 | <2.2 × 10⁻¹⁶ |
| R-squared = 0.0668 | ||||
We tested the strength of the relationships between the distribution of genomic features with both neutral DXY and FST (Tables 4, S14, and S15). Functional density and recombination rate showed a negative relationship with neutral DXY for all three species comparisons. The R-square values did not decrease with increasing divergence, and it appears that functional density is more strongly driving this relationship. This may help to explain why patterns of DXY are more conserved than diversity. Additionally, changes in recombination rate or functional density unique to a single lineage should have a greater impact on diversity within that lineage than on divergence between lineages. For FST, recombination rate showed a significant negative relationship with both species comparisons; however, functional density only showed a significant positive relationship in collared and pied flycatchers. The strength of the relationship was much weaker in red-breasted and taiga flycatchers, which corresponds with the results for nucleotide diversity that collared flycatcher recombination rate explains less of the genome-wide variation in π for red-breasted and taiga flycatchers. Regression analyses thus indicate that changes in the recombination landscape or the distribution of functional elements could explain the presence of lineage-specific FST peaks.
Relationship between recombination rate and density of functional sites with neutral DXY and FST landscapes
| Collared vs. pied DXY | Estimate | SE | T-value | P-value |
|---|---|---|---|---|
| ln(cM/Mb + 1) | −0.000158 | 1.59 × 10⁻⁵ | −9.93 | <2.2 × 10⁻¹⁶ |
| Sqrt(selection density) | −0.00416 | 0.000115 | −36.3 | <2.2 × 10⁻¹⁶ |
| R-squared = 0.276 | ||||
| Red-breasted vs. taiga DXY | ||||
| ln(cM/Mb + 1) | −0.000430 | 1.96 × 10⁻⁵ | −21.94 | <2.2 × 10⁻¹⁶ |
| Sqrt(selection density) | −0.00540 | 0.000142 | −38.2 | <2.2 × 10⁻¹⁶ |
| R-squared = 0.357 | ||||
| Collared vs. taiga DXY | ||||
| ln(cM/Mb + 1) | −0.000534 | 3.22 × 10⁻⁵ | −16.6 | <2.2 × 10⁻¹⁶ |
| Sqrt(selection density) | −0.00863 | 0.000232 | −37.2 | <2.2 × 10⁻¹⁶ |
| R-squared = 0.318 | ||||
| Collared vs. pied FST | ||||
| ln(cM/Mb + 1) | −0.0561 | 0.00216 | −25.9 | <2.2 × 10⁻¹⁶ |
| Sqrt(selection density) | 0.356 | 0.0259 | 13.8 | <2.2 × 10⁻¹⁶ |
| R-squared = 0.152 | ||||
| Red-breasted vs. taiga FST | ||||
| ln(cM/Mb + 1) | −0.0304 | 0.00200 | −15.2 | <2.2 × 10⁻¹⁶ |
| Sqrt(selection density) | −0.0130 | 0.0239 | −0.544 | 0.586 |
| R-squared = 0.0542 | ||||
To address this further, we compared the distributions of recombination rate and functional density in windows categorized as shared FST peaks, unique FST peaks, and the remaining genomic background. Functional density showed very little difference across the four peak classes (Figs. 6A and S7; Table S16). Recombination rate, however, was greatly reduced in both shared peaks and collared and pied unique peaks (Fig. 6B; Table S16). Red-breasted and taiga unique peaks showed a similar distribution to the remaining genome (Fig. 6B; Table S16). Overall, these results agreed with the relationships between genome-wide estimates of diversity and differentiation with patterns of recombination and functional density. Taken together, this provides multiple lines of evidence that changes in recombination rate may underlie lineage-specific FST peaks in red-breasted and taiga flycatchers.
![Distribution of statistics in each FST peak class. All 200-kb windows have been divided into four different classes, based on whether they have been defined as an FST peak unique to collared versus pied (CP unique), an FST peak unique to red-breasted versus taiga (RT unique), an FST peak shared in both species comparisons, or no peak at all. The distribution of density of targets of selection (defined as proportion of bases in a window falling in exons or conserved noncoding elements [CNEs]) and cM/Mb is shown for each of the four peak classes.](https://oup.silverchair-cdn.com/oup/backfile/Content_public/Journal/evolut/75/9/10.1111_evo.14234/3/m_evo14234-fig-0006.jpeg?Expires=1750221192&Signature=Gmer0GpRI6OmEpWkEQaukoLG90V3B4TVg58sIMEcx0YQGcLOukIbFdzL5noGblFZIbP4L5DFKdkqlsjxFYuS0h0z44Ig2m-DwPm5bdS-y7zzT-TUNz5UY7YXZNA7YLAWNHq7yjdEm--UO8jsl2h4qGP5LwyD7kBPrCGKI69SA0qB2F-HRnkpNyo9b1zA2wfxI4edYIl17B4BywKTxFJQLDGOpFejvjbhe~R9fnnZSKjef5Hi3~VdrhBmEbGksrM8IgW1D1DNmcsp54i~TqJ9kXFMVI759CGe3di1b-BsQrXwPwd6Z01H3Vzd4grS4shZ9CKsaXXroYFbt~RaUOJabw__&Key-Pair-Id=APKAIE5G5CRDK6RD3PGA)
Distribution of statistics in each FST peak class. All 200-kb windows have been divided into four different classes, based on whether they have been defined as an FST peak unique to collared versus pied (CP unique), an FST peak unique to red-breasted versus taiga (RT unique), an FST peak shared in both species comparisons, or no peak at all. The distribution of density of targets of selection (defined as proportion of bases in a window falling in exons or conserved noncoding elements [CNEs]) and cM/Mb is shown for each of the four peak classes.
Discussion
Correlated patterns of genome-wide diversity and differentiation have been observed across many organisms, particularly throughout birds (Burri et al. 2015; Van Doren et al. 2017; Delmore et al. 2018). Levels of nucleotide diversity have been shown to covary across millions of years (Dutoit et al. 2017b; Vijay et al. 2017), an observation that is thought to be explained by the long-term conservation of the distribution of genomic features such as density of functional elements and recombination rate (Ellegren 2010; Singhal et al. 2015; Kawakami et al. 2017). Similarly, shared FST peaks across different species have been proposed to arise through the recurrent action of background selection occurring in a conserved recombination landscape (Burri 2017). However, many recent results from analytical studies and simulations have questioned whether background selection alone can generate very large reductions in diversity and, in turn, peaks of FST (Matthey-Doret and Whitlock 2019; Rettelbach et al. 2019; Stankowski et al. 2019; Schrider 2020).
We used a comparative population genomics approach using two independent flycatcher species pairs to understand what processes generate shared versus lineage-specific signatures of selection. Many previous studies of genomic landscape evolution have focused primarily on closely related species where gene flow and ILS make a relevant contribution to shared signatures of selection (Martin et al. 2013; Burri et al. 2015; Irwin et al. 2016, 2018; Vijay et al. 2016; Stankowski et al. 2019) or on broadscale patterns over large evolutionary times (Dutoit et al. 2017b; Vijay et al. 2017; Delmore et al. 2018). For instance, the positive relationship between recombination rate and FST in some systems has been suggested to directly result from selection against introgressed variation (i.e., Heliconius in Martin et al. 2019; Swordtail fish in Schumer et al. 2018). In other cases, introgression has been shown to share adaptive variation between species (Pardo-Diaz et al. 2012; Stankowski and Streisfeld 2015; Moest et al. 2020). With the species studied here we are able to rule out a major contribution of gene flow and ILS to shared patterns and ask whether different evolutionary processes are responsible for generating shared and lineage-specific patterns.
We first showed that despite the high sequence divergence between the two species pairs, shared FST peaks were still evident across the genomic landscape. However, compared to previous studies focusing only on the closely related black-and-white flycatchers (Burri et al. 2015), we observed more lineage-specific signals in this study. Interestingly, there was evidence that selective sweeps coincide with both shared and lineage-specific FST peaks. This result adds to a growing body of literature suggesting that positive selection is critical for the generation of differentiation islands (Delmore et al. 2018; Stankowski et al. 2019). That this is also the case for shared FST peaks pairs is notable, as coincident FST peaks have been suggested to reflect the long-term action of background selection rather than positive selection (Burri 2017). A number of recent studies, including a study in collared flycatcher (Rettelbach et al. 2019), have shown analytically or with simulations that background selection does not impact diversity in the same way as positive selection (Mathey-Doret and Whitlock 2019; Stankowski et al. 2019; Schrider 2020). Our results have important implications for the interpretation of the genomic landscape, as it demonstrates that regions showing elevated differentiation in multiples species should not simply be disregarded as unimportant to adaptation.
It is noteworthy that positive selection appears to impact similar genomic regions in these two independent species comparisons, considering they diverged several million years ago (previous work estimates the split time of red-breasted and taiga flycatchers as 3–4 million years ago; Hung and Zink 2014). Many authors have described that comparing estimates of DXY and FST can be used to distinguish between different histories of selection (Irwin et al. 2016, 2018; Ravinet et al. 2017). DXY is impacted by levels of ancestral diversity but not current levels of diversity, and may therefore be reduced in FST peaks that have experienced selection within a common ancestor and then recurrently in the descendent lineages (Nachman and Payseur 2012; Cruickshank and Hahn 2014; Han et al. 2017). One problem with this expectation is that it is primarily applicable to relatively recent species split times. As divergence time increases, substitutions will start to contribute more to DXY than ancestral diversity. This means that in regions where many substitutions are fixed by positive selection, DXY may be elevated (Cruickshank and Hahn 2014). This expectation matches what we observed in our data. Between collared and pied flycatcher DXY was reduced in all FST peaks. Given the recent timing of their divergence, and that the whole group of black-and-white flycatchers rapidly split (Nater et al. 2015), it is possible that the signature of an ancestral sweep would remain between these two species today (Rettelbach et al. 2019). Conversely, with increasing species differentiation, DXY was increasingly higher in shared FST peaks compared to the rest of the genome. Considering that we found evidence for selective sweeps underlying shared FST peaks, the elevated DXY observed at greater species differentiation could reasonably be the consequence of substitutions fixed by positive selection. A major implication of these results is that it is necessary to consider the stage of divergence between species when interpreting relationships between different measures of divergence. Otherwise, one may be misled based on expectations that only hold for a certain level of species differentiation.
In addition to the role of selection in shaping the genomic landscape, we investigated the importance of different genomic characteristics in generating shared versus lineage-specific patterns in the genomic differentiation landscape by comparing distributions of recombination rate and the density of functional sites across genomic regions. In particular, the role of recombination rate in generating shared patterns of genome-wide differentiation has been emphasized by many authors (Nachman and Payseur 2012; Cutter and Payseur 2013). The recombination landscape is thought to be remarkably conserved in birds (Singhal et al. 2015; Kawakami et al. 2017), which may contribute to why similar patterns of differentiation repeatedly evolve in many bird species (Burri et al. 2015; Vijay et al. 2016, 2017; Dutoit et al. 2017b; Van Doren et al. 2017). We observed here that FST peaks that were shared between both species comparisons did overall have a lower recombination rate compared to the genomic background, as estimated by the collared flycatcher linkage map. Functional density was similar between shared and lineage-specific FST peaks. This suggests that not only recurrent selection is necessary to generate shared FST peaks, but also a conserved pattern of low recombination in the regions affected by selection. We also observed that changes in the recombination landscape may be responsible for the evolution of lineage-specific FST peaks in combination with selective sweeps, which could, for example, be the result of structural variation. We expect that these sweep signatures are particularly likely to coincide with low recombination, as the sweep signature will erode less quickly. Although our evidence is indirect as we do not currently have estimates of recombination rate from red-breasted or taiga flycatchers, a similar result has been observed previously. Estimates of population recombination rate, rho, from collared and pied flycatchers were most strongly correlated with population branch statistics estimated in the corresponding species (Kawakami et al. 2017). Thus, although recombination rate in birds may show greater levels of conservation over large evolutionary timescales compared with other systems (Singhal et al. 2015), changes in recombination rate may still have an important role in genomic landscape evolution.
Ultimately, this study has a wide-reaching impact for the interpretation of the differentiation landscape. First, our study suggests an important role of positive selection in differentiation peaks. We thereby add to a growing body of research that demonstrates that background selection is not such a strong confounding factor in genome scans as previously thought. Second, we demonstrate that despite a highly conserved karyotype and recombination landscape in birds, changes in recombination rate can lead to signatures of lineage-specific selection. Third, we have chosen a timescale at which ILS and introgression can be ruled out as major drivers of shared peaks, highlighting the importance of considering the timescale of species differentiation in the interpretation of genomic landscape evolution.
AUTHOR CONTRIBUTIONS
HE conceived of the study. HE and CFM supervised the study. MAC performed data analyses. MAC, HE, and CFM wrote this article.
ACKNOWLEDGMENTS
This study was funded by grants from the Swedish Research Council (2013-8271 to HE) and the Knut and Alice Wallenberg Foundation (2014/0044 to HE). Red-breasted and taiga flycatcher samples were provided by the Bell Museum of Natural History, University of Minnesota. Sequencing was performed by the SNP&SEQ technology platform at Uppsala University. Support by the National Bioinformatics Infrastructure Sweden (NBIS) in initial processing of sequencing data is gratefully acknowledged. Computations were performed on resources provided by the Swedish National Infrastructure for Computing (SNIC) through Uppsala Multidisciplinary Center for Advanced Computational Science (UPPMAX). We thank members of the Ellegren and Suh labs for their helpful discussions.
CONFLICT OF INTEREST
The authors declare no conflict of interest.
DATA ARCHIVING
Resequencing data for samples newly sequenced in this study are available in the EMBL-EBI European Nucleotide Archive (ENA; http://www.ebi.ac.uk/ena) under accession number PRJEB43825. Variant call data generated here for all samples are deposited on Dryad: https://doi.org/10.5061/dryad.n2z34tmw6. Code used for analyses is available on GitHub: https://github.com/madeline-chase/flycatcher_shared_lineage_spec_selection.
LITERATURE CITED
Associate Editor: W. Haerty
Handling Editor: M. L. Zelditch
Author notes
This article corresponds to Y. Wang and V. Narayan. (2021). Digest: Positive selection and recombination shape the genomic landscape in flycatchers . Evolution. https://doi.org/10.1111/evo.14309.
