


Abstract
Severe flooding often leads to downstream displacement of aquatic animals. Despite this, many salmonid populations persist in habitats located upstream of tall barriers, such as artificial check dams and/or natural waterfalls, that completely block fishes from returning to the upstream areas after flooding. The evolution of such populations may be affected by spatial sorting due to differential rates of downstream displacement. This study examined whether a morphological trait (increased body depth) that allows individuals to better maintain their position during flooding has evolved in juvenile amago salmon Oncorhynchus masou ishikawae inhabiting above-barrier habitats in two rivers. In both rivers, juveniles collected at the stations with multiple downstream barriers had deeper bodies than those collected at other stations. Similar differences were found in juveniles reared in a common-garden experiment. Field experiments with natural flooding also indicated that deep bodies help juveniles resist downstream displacement. These results consistently suggest that juveniles in some above-barrier habitats have evolved deep bodies to resist downstream displacement due to flooding. Our study is the first to show the evolutionary outcomes of passive spatial sorting during severe climate events.
Severe climate events, such as hurricanes, winter storms, droughts, and floods, can cause dramatic phenotypic changes in populations and lead to microevolution (Grant and Grant 2006; Grant 2017; Campbell-Staton et al. 2017; Donihue et al. 2018; Donihue et al. 2020). For instance, hurricanes have induced morphological microevolution in the arboreal anole Anolis scriptus. Anoles with larger toe pads are better able to survive hurricanes because they can grip trees more tightly, allowing them to withstand more violent wind gusts (Donihue et al. 2018); consequently, hurricanes have induced genetic changes in toe pad size (Donihue et al. 2020; Huey and Grant 2020). As severe climate events become more frequent worldwide, there has been growing interest in their evolutionary consequences (Grant 2017; Grant et al. 2017; Pruitt et al. 2019; Huey and Grant 2020). However, few studies have directly examined the evolutionary impact of severe climate events (Grant 2017; Grant et al. 2017; Huey and Grant 2020).
Flooding is a severe climate event that can impact aquatic organisms by causing serious declines in physiological condition (Natsumeda 2003; Jones and Sievert 2009), as well as injury (Jones and Sievert 2009) and extensive mortality (Seegrist and Gard 1972; Hanson and Waters 1974; Erman et al. 1988; Spink and Rogers 1996; Jensen and Johnsen 1999; Weese et al. 2011). In rivers, flooding can also lead to downstream displacement (Harvey 1987; Jones and Sievert 2009; Pearse et al. 2009; Veith et al. 2019). In this study, we define downstream displacement as a nonlethal process through which individuals are forced to emigrate from their home river section. If individuals displaced by flooding do not return to their original local population, this may lead to microevolution. Here, we focus on this evolutionary mechanism as a form of spatial sorting (Shine et al. 2011a).
Spatial sorting is an evolutionary mechanism whereby traits evolve because genes are differentially successful through space rather than time (Shine et al. 2011a; Phillips and Perkins 2019). Although natural selection can arise from differential survival or reproductive success, spatial sorting can arise from differential dispersal rates (Shine et al. 2011a; Clarke et al. 2019). Specifically, Shine et al. (2011a) predicted that, in a population that is expanding its range, individuals with high dispersal ability will distribute at the edge of the range and mate with other high-dispersal individuals, resulting in the evolution of high dispersal ability in the area. Similarly, individuals with low dispersal ability would remain in the original range and mate with other low-dispersal individuals, meaning that low dispersal ability would evolve within the core of the range. Additionally, we hypothesized that spatial sorting may arise from differences in the rate of downstream displacement due to flooding, leading to the evolution of functional traits to withstand flooding in certain river sections.
We expect spatial sorting after flooding events to drive evolution in populations of landlocked salmonids. Salmonids are well known as anadromous fishes, but they also establish landlocked populations composed entirely of fluvial forms upstream of tall barriers, such as artificial check dams and/or natural waterfalls, that completely block fishes from returning to their original populations after downstream displacement (Morita et al. 2000; Morita and Yamamoto 2002; Sakata et al. 2005; Girman et al. 2006; Sato 2006; Kikko et al. 2008; Makiguchi et al. 2009; Pearse et al. 2009; Kawamura et al. 2012; Pujolar et al. 2016). These landlocked populations are found even in areas with heavy rainfall and frequent flooding (Sato 2006; Makiguchi et al. 2009; Kawamura et al. 2012; Pujolar et al. 2016). Here, we investigate the effects of evolution due to flooding-induced spatial sorting in such populations.
We hypothesize that landlocked salmonid populations in above-barrier areas have developed deeper bodies than those in open-stream areas to allow them to remain in above-barrier habitats even after severe flooding. Fish with deeper bodies are able to generate higher thrust due to their larger body surface area and greater muscle power (Taylor and McPhail 1985a; Seiler and Keeley 2007; Domenici et al. 2008). We focus particularly on juveniles because juvenile salmonids are more vulnerable to flooding than adults (Jowett and Richardson 1989; Koizumi et al. 2012).
We tested the above hypothesis in landlocked populations of amago salmon Oncorhynchus masou ishikawae. First, we conducted a field survey to determine whether juveniles from above-barrier populations have deeper bodies than those from open-stream populations. We then conducted a field experiment by utilizing the occurrence of natural flooding to examine whether juveniles with deeper bodies are better able to resist downstream displacement, and whether they show ascent behavior to reduce the risk of downstream displacement. Finally, in a common-garden experiment, we tested whether interpopulation variation in body depth persists in an artificial common environment. Downstream displacement across a barrier is more likely to occur if the barriers are not associated with reservoirs, because individuals can more readily migrate over the barrier to the downstream side (see Morita et al. 2000; Pearse et al. 2009; Pujolar et al. 2016). Therefore, we focused on habitats located upstream of barriers without reservoirs.
Materials and Methods
STUDY SITE AND SPECIES
Our study was conducted in the Koza and Hirai rivers in the southernmost region of the Kii Peninsula in Honshu, Japan. This area experiences the highest rainfall amounts in Japan (annual precipitation can reach 4000 mm; see also Ohta et al. 2014). Flooding occurs from late June to late July, and coincides with the growth period of juvenile O. masou ishikawae.
Oncorhynchus masou ishikawae is an endemic salmonid in the mountain streams of western Japan. We defined juveniles as individuals less than 110 mm in fork length (FL), because most individuals less than 110 mm are immature during the spawning season (October) in natural rivers (Morita et al. 2018). Anadromous individuals do not occur in this study area because it is isolated from the ocean by the Shichikawa Reservoir (Fig. 1A). Local fishery associations have released hatchery-reared fish in some parts of this river system.
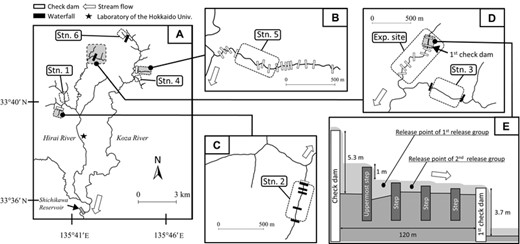
Map of the study stations. (A) Overall view showing the locations of each study station (Stn.), the experimental field site (Exp. site), the furthest-downstream barriers (i.e., check dams and waterfalls) on each tributary, a large dam with a reservoir (the Shichikawa dam), and the laboratory of Hokkaido University (black star). (B) Detailed map of Stn. 5, including the 16 check dams. (C) Detailed map of Stn. 2, including one check dam and five waterfalls. (D) Detailed map of the area around Stn. 3 and the Exp. site, including eight check dams and two waterfalls. (E) Schematic cross-sectional view of the experimental release section for the field experiment conducted at Exp. site, showing unpassable check dams and passable steps. Only up to four passable steps are shown for simplicity.
We established six survey stations in the study area (Fig. 1). Stations 1 and 4 have no nearby downstream barriers (i.e., are open-stream habitats), and hatchery-reared fish have been stocked at these stations. Stations 2, 3, 5, and 6 include or are in the vicinity of barriers such as dams and waterfalls (i.e., are above-barrier habitats). Stations 2 and 5 have a series of barriers that prevent fish from ascending upstream (Fig. 1B, C; Table S2). Station 2 is inhabited by an indigenous population (Kawamura et al. 2007, 2012), and Station 5 is inhabited by a population of unknown genetic background. Stations 3 and 6 are inhabited by indigenous populations (Kawamura et al. 2007, 2012). We also chose an additional site for the field experiment (described below) where the river bed remains dry for most of the year (i.e., the site marked “Exp. site” in Figs. 1D and 1E, Table S1).
FIELD SURVEY
We surveyed the stations on the Koza River (Stations 4-6) in late April 2018 to late May 2018, and the stations on the Hirai River (Stations 1-3) in early May 2018 to mid-June 2018. No major flooding occurred during this period. Juvenile O. masou ishikawae were collected by electrofishing and angling and transported back to the laboratory, where we photographed each fish using a digital camera (TG-4, Olympus Co., Japan) affixed to a photography platform. We then used image analysis software (ImageJ, National Institutes of Health, Bethesda, MD, USA) to measure morphological traits. We focused on four morphological traits related to body depth (Fig. 2): (1) caudal peduncle depth at the posterior end of the adipose fin (CPD1), (2) caudal peduncle depth from the posterior end of the anal fin to the anterior end of the adipose fin (CPD2), (3) body depth from the lateral line to the anterior end of the dorsal fin (BD1), and (4) body depth at the anterior end of the anal fin (BD2). All juveniles were released back into the river at their original station after measurement. The same procedure was used to measure juveniles in subsequent experiments.
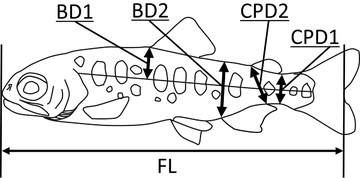
Morphometric measurements of juvenile O. masou ishikawae. FL = fork length; BD1 = body depth from the lateral line to the anterior end of the dorsal fin; BD2 = body depth at the anterior end of the anal fin; CPD1 = caudal peduncle depth at the posterior end of the adipose fin; CPD2 = caudal peduncle depth from the posterior end of the anal fin to the anterior end of the adipose fin. These four body depth measurements were aggregated into a single variable (PC1) by using principal component analysis after log10 transformation.
We first analyzed interstation variation in FL, because FL has a large effect on body shape. To improve normality, FL was log10-transformed and interstation variation was analyzed by analysis of variance without assuming equal variances (i.e., Welch's ANOVA). This analysis was performed separately for each of the two rivers (i.e., the Koza River and Hirai River). Post hoc comparisons between stations were then conducted by using the Games-Howell test for data with unequal variances.
We constructed an allometric model of FL and body depth, and interstation variation in body depth was tested by using the residuals calculated from this model. First, principal component analysis (PCA) was performed to aggregate the four log10-transformed body depth measurements (i.e., log10 [BD1], log10 [BD2], log10 [CPD1], and log10 [CPD2]). To obtain common aggregate values, PCA was performed using data for all individuals in this study (i.e., all individuals collected for the field survey, field experiment, and common-garden experiment). This resulted in a first principal component (PC1) that explained 99.6% of the total variance. Therefore, we adopted PC1 as the aggregate value of the multiple log10-transformed body depths (i.e., an index of body depth). PC1 scores were multiplied by −1 (i.e., positive and negative values were reversed) so that the values correlated positively with body depth before constructing the linear models. Separate regressions of PC1 against log10-transformed FL were calculated for the Koza and Hirai rivers. Then, PC1 residuals were calculated from the regression results. To evaluate interstation variation in body depth, the PC1 residuals were analyzed by using Welch's ANOVA. We then performed post hoc comparisons between the stations by using the Games-Howell test.
FIELD EXPERIMENT
We transplanted fish into an experimental area of the above-barrier river section before the flooding that occurs in the early-summer rainy season (late June 2018) to examine the relationship between morphological traits and downstream displacement due to flooding. The release point was designated as the experimental site (Exp. site in Fig. 1D). Because the river bed at the experimental site was usually dry (Table S1), there were initially no fish in this area. However, water flow gradually increased from early June 2018 because of frequent rainfall. Subject fish were collected from an above-barrier station (i.e., the indigenous local population at Station 3; see Fig. 1D) by using an electrofishing unit prior to the heavy rainfall. Capture dates were 25-27 May for the first group and 12, 14, and 19 June for the second group. We released the first group (n = 103) at the experimental site on the morning of 8 June and the second group (n = 58) on the morning of 20 June. Prior to flooding, the water depth at the release point was about 1 m for the first group and about 0.5 m for the second group. The two release groups were identified by using a visible implant elastomer (Northwest Marine Technologies, Anacortes, WA, USA).
Although we relied on weather forecasts to decide the release dates, rainfall amounts remained low from the end of May to early June. The first heavy rainfall event began at sunset on 20 June, followed by flooding that began at around midnight on 20 June and lasted until 11 July. No rainfall occurred from 12 to 25 July, and streamflows gradually decreased. We recaptured both release groups during this period of declining water levels (i.e., 12, 17, 19, 23, and 25 July).
For recapture, we used electrofishing and angling. Ninety-nine of 161 released fish (61%) were recaptured and photographed in the same manner as in the field survey. After water levels declined and flow became intermittent, we snorkeled and searched for released fish in all pools around the experimental site and found no fish beyond the third check dam on the downstream side (Fig. 1D). Recaptured fish were categorized by retention status based on the location of recapture: juveniles were assigned a retention status of 1 if they were recaptured above the first check dam (i.e., they were retained upstream), and a retention status of 0 if they were recaptured further downstream (i.e., they were displaced) (see Figs. 1D and 1E). We also defined ascent behavior as the movement of juveniles above the uppermost step (approximately 1 m in height; Fig. 1E). Recaptured fish were categorized by ascent status as follows: juveniles were assigned an ascent status of 1 if they were recaptured upstream of the uppermost step, and an ascent status of 0 if they were recaptured further downstream (see Fig. 1E). Six individuals with injured and/or deformed fins were excluded from the analysis (i.e., total n = 93). We did not observe any piscivorous animals near the experimental site (although we did observe one ruddy kingfisher [Halcyon coromanda] on one occasion in 2018), implying that predator effects are likely to have been negligible.
To examine whether deeper bodies help fish avoid downstream displacement due to flooding, we constructed generalized linear models (GLMs) for each of the two release groups. We used a binomial error distribution and logit link function for the GLMs because the response variable consisted of binary data on retention status. Explanatory variables were log10-transformed FL and PC1 (an index of body depth), as described above. The statistical significance of the explanatory variables was tested by using analysis of deviance.
We also constructed two GLMs (i.e., for the first and second release groups) to evaluate the relationship between morphological traits and whether fish showed ascent behavior. The response variable consisted of binary data on ascent status. The explanatory variables were log10-transformed FL and PC1. The statistical significance of the explanatory variables was tested by using analysis of deviance.
COMMON-GARDEN EXPERIMENT
We conducted a common-garden experiment to evaluate the genetic basis of the focal morphological traits. We first captured a mature female and three mature males from each station in November 2017. Sperm from the three mature males (approximately 5 mL in total) were pooled in a plastic cup and used to fertilize eggs ovulated by a mature female from their respective stations. Fertilized eggs were then separately placed in incubation trays (20 × 15 × 1.5 cm with 1-mm bottom mesh). The incubation trays were placed in a 60-L experimental tank and submerged in natural water (a mix of water from the Hirai River and spring water), which constantly flowed through the tank at approximately 5 L/min. Water temperatures remained below 10°C during this incubation stage.
After hatching, we haphazardly chose 40 individuals from each station group. To reduce any differences in competitive ability, we divided them into two rearing groups (i.e., 20 individuals/rearing group; Table 1) by body size at the start of rearing. These rearing groups were separately reared in a net cage (18 × 18 × 13 cm with 1-mm mesh). Because the number of eggs obtained from Station 5 was small, all 14 individuals from this station were raised in a single rearing cage (Table 1). The rearing groups were moved to a larger cage (18 × 36 × 13 cm with 1-mm mesh) in late May 2018. All rearing cages were placed in three consecutive experimental tanks (60 L × 3) under the same water conditions as the incubation trays; however, the speed of water flow (approximately 8 L/min) was higher than in the egg-incubation stage. Rearing cages were cleaned and randomly translocated every 10 days. All individuals were fed on commercial salmonid food. All morphological measurements were made in late May and early June 2018 by the same methods as in the field survey. Both rearing groups for Station 3 failed to survive, perhaps because of their low feeding rates under the rearing conditions. Thus, we did not obtain any data for Station 3 in the common-garden experiment (Table 1). Water temperatures remained below 20°C during this rearing stage.
Summary of the number of reared Oncorhynchus masou ishikawae juveniles and rearing groups in the common-garden experiment
| Hirai River | Koza River | |||||
|---|---|---|---|---|---|---|
| Station type | Group ID | n (initial) | n (final) | Group ID | n (initial) | n (final) |
| Open stream | H1 | 20 | 19 | K1 | 20 | 20 |
| H2 | 20 | 20 | K2 | 20 | 16 | |
| Above barrier (multiple downstream barriers) | H3 | 20 | 20 | K3 | 14 | 13 |
| H4 | 20 | 18 | K4 | NA | NA | |
| Above barrier (one downstream barrier) | H5 | NA | NA | K5 | 20 | 19 |
| H6 | NA | NA | K6 | 20 | 17 | |
The rearing groups and stations are as follows: Station 1: H1 and H2; Station 2: H3 and H4; Station 3: H5 and H6; Station 4: K1 and K2; Station 5: K3 and K4; and Station 6: K5 and K6. Station 2 (H3 and H4) and Station 5 (K3 and K4) are above-barrier stations with multiple downstream barriers. Station 3 (H5 and H6) and Station 6 (K5 and K6) are above-barrier stations with one downstream barrier. NA = not available.
We first analyzed differences in FL between the rearing groups by using Welch's ANOVA for each of the two rivers (i.e., the Koza and Hirai rivers). The response variable was log10-transformed FL, and the explanatory variable was rearing group (for the Hirai River: H1, H2, H3, H4; for the Koza River: K1, K2, K3, K5, K6; Table 1). We then compared log10-transformed FL among the rearing groups by using post hoc Games-Howell tests.
To compare body depth among rearing groups, we used the same statistical analysis procedure as in the field survey (i.e., the PC1 residuals calculated for each river were analyzed by using Welch's ANOVA, and post hoc comparisons were made by using the Games-Howell test).
We used R version 4.0.3 (R Core Team 2020) for the statistical analyses. We used the function Anova in the package “car” (Fox and Weisberg 2019) for analysis of deviance for all GLMs constructed for the field experiment. χ2 values were used as the test statistic. We used the function posthocTGH in the package “userfriendlyscience” version 0.7.2 (Peters 2018) for post hoc comparisons of the field survey and common-garden experiment.
Results
FIELD SURVEY
The total number of juveniles examined was 185, with the number of juveniles examined from each station as follows: Station 1, 33; Station 2, 30; Station 3, 30; Station 4, 32; Station 5, 30; and Station 6, 30. Significant interstation variability in FL and PC1 (an index of body depth) was detected by using Welch's ANOVA in both the Hirai River (FL: F2, 59.48 = 28.29, P < 0.001; PC1 residuals: F2, 59.65 = 7.84, P = 0.001) and Koza River (FL: F2, 58.96 = 8.44, P = 0.001; PC1 residuals: F2, 54.71 = 16.48, P < 0.001). In the Hirai River, post hoc comparisons using the Games-Howell test showed that FL at Station 3 (which features one downstream barrier) was significantly smaller than at Station 1 (no downstream barriers; t58.8 = 4.90, P < 0.001) and Station 2 (multiple downstream barriers; t55.8 = 7.21, P < 0.001) (Fig. 3; Table S3). In addition, PC1 residuals at Station 2 (which features multiple downstream barriers) were significantly larger than at Station 1 (no downstream barriers; t60.3 = 3.51, P = 0.002) and Station 3 (one downstream barrier; t56.5 = 3.51, P = 0.003) (Fig. 4; Table S3), indicating that juveniles at Station 2 had deeper bodies than those found at other stations on the Hirai River. In the Koza River, post hoc comparisons using the Games-Howell test showed that FL at Station 6 (which features one downstream barrier) was significantly smaller than at Station 4 (no downstream barrier; t59.2 = 3.84, P = 0.001) and Station 5 (multiple downstream barriers; t56.1 = 2.99, P = 0.011) (Fig. 3; Table S3). In addition, PC1 residuals at Station 5 (which features multiple downstream barriers) were significantly larger than at Station 4 (no downstream barriers; t57.9 = 4.95, P < 0.001) and Station 6 (one downstream barrier; t43.4 = 5.54, P < 0.001) (Fig. 4; Table S3), indicating that juveniles at Station 5 had deeper bodies than those found at other stations on the Koza River.
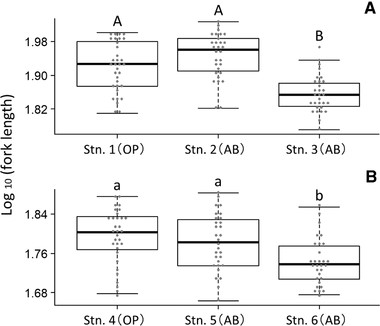
Comparison of log10-transformed fork length among juveniles captured at each study station (Stn.) in the (A) Hirai River and (B) Koza River. Station types are indicated in parentheses as open stream (OP) or above barrier (AB). Stations 2 and 5 are above-barrier stations with multiple downstream barriers. Stations 3 and 6 are above-barrier stations with one downstream barrier. Letters indicate homogenous subsets at the P < 0.05 level based on Games-Howell post hoc comparisons.
![Comparison of PC1 (an index of body depth) residuals obtained from regression models among juveniles captured at each study station (Stn.). Regression models were separately constructed for the Hirai River (PC1 = 2.27302 × log10 [FL] – 4.03596) and Koza River (PC1 = 2.24280 × log10 [FL] – 3.95556). Panels show PC1 residuals for stations in the (A) Hirai River and (B) Koza River. Station types are indicated in parentheses as open stream (OP) or above barrier (AB). Stations 2 and 5 are above-barrier stations with multiple downstream barriers. Stations 3 and 6 are above-barrier stations with one downstream barrier. Letters indicate homogeneous subsets at the P < 0.05 level based on Games-Howell post hoc comparisons.](https://oup.silverchair-cdn.com/oup/backfile/Content_public/Journal/evolut/75/7/10.1111_evo.14281/3/m_evo14281-fig-0004.jpeg?Expires=1750301021&Signature=l~RM62JbCZX9Joj88pNNi2pE0bm-ePCIyidyOnaTi1pVLaHG3vYnCeXsLp0SxX7oRMjfnQ48MClFYtBDBQ-DbGPAAMRRntWj~sBPVR600kHVEgRKaI5Bwz6BUDwa1WwYO3Do8OaG6943Kuo7CTPtTc8vkZ-832kOf-8bd7AmQq6A~GQQRi8Zl2APFxaQFPm~mRv0LyIy5tQZ0ENA3ouArjT52jYO-M79A38sy-ofQEBHlhmOH9wsV1dmXpHvqfPhr77kIrHx2dHGL5akZ6PsuZ70Ofb-T8We9dKPz0aBMXK5cH-DzeJwIzOX-7~eWdX-~JMNOUru3IRb~-JLl2xzvQ__&Key-Pair-Id=APKAIE5G5CRDK6RD3PGA)
Comparison of PC1 (an index of body depth) residuals obtained from regression models among juveniles captured at each study station (Stn.). Regression models were separately constructed for the Hirai River (PC1 = 2.27302 × log10 [FL] – 4.03596) and Koza River (PC1 = 2.24280 × log10 [FL] – 3.95556). Panels show PC1 residuals for stations in the (A) Hirai River and (B) Koza River. Station types are indicated in parentheses as open stream (OP) or above barrier (AB). Stations 2 and 5 are above-barrier stations with multiple downstream barriers. Stations 3 and 6 are above-barrier stations with one downstream barrier. Letters indicate homogeneous subsets at the P < 0.05 level based on Games-Howell post hoc comparisons.
FIELD EXPERIMENT
For the first release group, the GLM for retention status (i.e., whether individuals were retained above the first check dam [status = 1] or were displaced [status = 0]) did not detect significant effects on PC1 (χ21 = 0.0450, P = 0.832; Fig. 5; Table 2) and log10-transformed FL (χ21 = 0.198, P = 0.657; Fig. 5; Table 2). By contrast, the GLM for ascent status (i.e., whether individuals did [status = 1] or did not [status = 0] ascend the uppermost step) detected a significant positive effect on PC1 (χ21 = 4.952, P = 0.026; Table 2), but did not detect a significant effect on log10-transformed FL (χ21 = 1.628, P = 0.202; Table 2). The significant positive effect on PC1 indicates that deeper-bodied juveniles were more likely to ascend the uppermost step (Fig. 5). For the second release group, GLMs for retention status and ascent status detected significant positive effects on PC1 (retention status: χ21 = 6.651, P = 0.010; ascent status: χ21 = 10.006, P = 0.002; Table 2) and negative effects on log10-transformed FL (retention status: χ21 = 4.652, P = 0.031; ascent status: χ21 = 6.728, P = 0.009; Table 2). These findings indicate that juveniles with deeper bodies relative to their FL were more likely to remain above the first check dam and to ascend the uppermost step (Fig. 5).
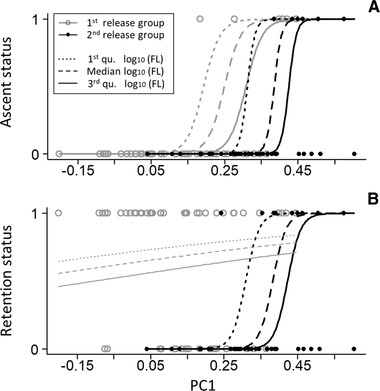
Logistic relationships between PC1 (an index of body depth) and (A) the proportion of juveniles ascending the uppermost step or (B) the proportion of juveniles remaining above a barrier. The y-axis shows juvenile status, whereby 0 indicates individuals remaining downstream of the uppermost step and 1 indicates ascent above the uppermost step in panel A and 0 indicates displacement downstream of a barrier and 1 indicates remaining above a barrier in panel B. Gray, open circles and gray lines indicate the first release group. Black, solid circles and black lines indicate the second release group. In both panels, regression curves show log10-transformed fork length (FL)-specific logistic relationships between PC1 and juvenile status. Dotted, dashed, and solid lines represent logistic relationships for the first quartile, median, and third quartile of log10-transformed FL values, respectively.
Summary of generalized linear models with binomial error distributions used to analyze relationships between morphological traits and the proportion of O. masou ishikawae juveniles remaining upstream of barriers or ascending the uppermost step during the field experiment
| Variables | Estimate | SE | χ2 | df | P |
|---|---|---|---|---|---|
| First release group | |||||
| Proportion of juveniles remaining above the barrier | |||||
| Log10 (FL) | −8.58 | 19.32 | 0.1976 | 1 | 0.657 |
| PC1 | 1.64 | 7.73 | 0.0450 | 1 | 0.832 |
| Proportion of juveniles ascending the uppermost step | |||||
| Log10 (FL) | −57.98 | 47.42 | 1.6282 | 1 | 0.202 |
| PC1 | 44.22 | 23.13 | 4.9517 | 1 | 0.026 |
| Second release group | |||||
| Proportion of juveniles remaining above the barrier | |||||
| Log10 (FL) | −101.53 | 56.66 | 4.6518 | 1 | 0.031 |
| PC1 | 55.21 | 26.80 | 6.6509 | 1 | 0.010 |
| Proportion of juveniles ascending the uppermost step | |||||
| Log10 (FL) | −178.56 | 100.23 | 6.7276 | 1 | 0.009 |
| PC1 | 97.63 | 48.50 | 10.0059 | 1 | 0.002 |
Significant P-values are shown in bold. FL = fork length. PC1 is an index of body depth.
COMMON-GARDEN EXPERIMENT
Juveniles were reared until 15 June 2018, and 162 juveniles originating from five stations were used for measurement (Table 1). Although there were no significant differences in FL among rearing groups from either the Hirai River (Welch's ANOVA: F3, 39.96 = 0.10, P = 0.960) or Koza River (F4, 37.31 = 0.71, P = 0.593) (see Fig. 6), significant differences in PC1 residuals were detected among rearing groups from both the Hirai River (Welch's ANOVA: F3, 40.34 = 63.5, P < 0.001) and Koza River (Welch's ANOVA: F4, 36.40 = 47.1, P < 0.001). In the Hirai River, the PC1 residuals of the two groups originating from Station 2 (groups H3 and H4) were significantly larger than those of the other rearing groups (Games-Howell test; Fig. 7; Table S4), indicating that juveniles derived from Station 2 (which features multiple downstream barriers) have deeper bodies than those derived from other groups along the Hirai River. In the Koza River, the PC1 residuals of one of the groups originating from Station 5 (group K3) were significantly larger than those of the other rearing groups (Games-Howell test; Fig. 7; Table S4), indicating that juveniles derived from Station 5 (which features multiple downstream barriers) have deeper bodies than those derived from other groups along the Koza River. There were no significant differences between rearing groups originating from the same study station in either river (Games-Howell test; Fig. 7; Table S4).
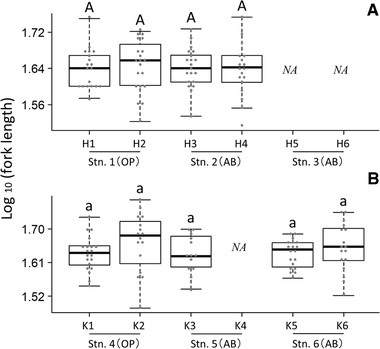
Comparison of log10-transformed fork length among juveniles reared in a common-garden experiment. Panels show differences among rearing groups originating in the (A) Hirai River and (B) Koza River. Station (Stn.) types are indicated in parentheses as open stream (OP) or above barrier (AB). Stations 2 and 5 are above-barrier stations with multiple downstream barriers. Stations 3 and 6 are above-barrier stations with one downstream barrier. Letters indicate homogenous subsets at the P < 0.05 level. NA = not available.
![Comparison of PC1 (an index of the body depth) residuals obtained from regression models among juveniles reared in a common-garden experiment. Regression models were separately constructed for the Hirai River (PC1 = 2.52489 × log10 [FL] – 4.46386) and Koza River (PC1 = 2.49194 × log10 [FL] – 4.39887). Panels show differences among rearing groups originating in the (A) Hirai River and (B) Koza River. Station (Stn.) types are indicated in parentheses as open stream (OP) or above barrier (AB). Stations 2 and 5 are above-barrier stations with multiple downstream barriers. Stations 3 and 6 are above-barrier stations with one downstream barrier. Letters indicate homogeneous subsets at the P < 0.05 level based on Games-Howell post hoc comparisons. NA = not available.](https://oup.silverchair-cdn.com/oup/backfile/Content_public/Journal/evolut/75/7/10.1111_evo.14281/3/m_evo14281-fig-0007.jpeg?Expires=1750301021&Signature=siJFK4UG4k3fBdv4-gCYQ3S7q2msSIedd20ML4PByGJzO1hzkXPBShIs1CV96-scUFLaLRY2YrufqNY8FYuu71jrydWVZp14k695u6RuwQSNPY7pg94uj~nBNGEPjuQOqo4isS~~2LsoUujYA~9xmY8caF-0t6BE43AAWaHd3DGd86qmN0JgHOqpnHNYbCgz5Da1YpKT72KeaTM1XtkoIN5gKDgB8kX0I0cOlxbOrCUu-hepUCdICQCBHpWaEiTkOvMt5KPxGoeqrlAQFZ0qVfA-b633Vl85mKakZbY1dMJ1UTaZ8~pjosAvXi7yUfnQpEvrjKiUOr2RR-G1ORSj1g__&Key-Pair-Id=APKAIE5G5CRDK6RD3PGA)
Comparison of PC1 (an index of the body depth) residuals obtained from regression models among juveniles reared in a common-garden experiment. Regression models were separately constructed for the Hirai River (PC1 = 2.52489 × log10 [FL] – 4.46386) and Koza River (PC1 = 2.49194 × log10 [FL] – 4.39887). Panels show differences among rearing groups originating in the (A) Hirai River and (B) Koza River. Station (Stn.) types are indicated in parentheses as open stream (OP) or above barrier (AB). Stations 2 and 5 are above-barrier stations with multiple downstream barriers. Stations 3 and 6 are above-barrier stations with one downstream barrier. Letters indicate homogeneous subsets at the P < 0.05 level based on Games-Howell post hoc comparisons. NA = not available.
Discussion
Juvenile O. masou ishikawae in above-barrier habitats in areas with multiple downstream barriers (i.e., stations 2 and 5) have significantly deeper bodies than those in other areas of the same river (Fig. 4). Differences in body depth among the rearing groups were also consistent with those found in the field data, suggesting a genetic basis for body depth (Fig. 7). However, the body depth of juvenile salmonids is known to vary with maternal effects such as egg size (Cogliati et al. 2018). Thus, caution should be exercised in interpreting the results of the common-garden experiment, because we used F1 individuals and the possibility of a maternal effect cannot be ruled out (but see Taylor and McPhail 1985b; Swain and Holtby 1989; Pakkasmaa and Piironen 2001; Pon et al. 2007; Seiler and Keeley 2007). The results of our field experiments, which were based on natural flooding events, indicate that increased body depth helps avoid downstream displacement during flooding (Fig. 5; Table 2). Although we did not detect any significant effects of body depth in the first release group, in the second release group, body depth had a significantly positive effect on the fish's ability to remain upstream of barriers (Fig. 5; Table 2). Also, a significantly positive effect of body depth on ascent behavior (i.e., ascent of the uppermost step; see Fig. 1E) was detected in both release groups (Fig. 5; Table 2). Deeper bodies likely enhance swimming ability and allow individuals to reach upstream sections where there is less risk of displacement during flooding. Overall, our results consistently suggest that the deep bodies of O. masou ishikawae juveniles inhabiting above-barrier habitats in areas with multiple downstream barriers have at least partly evolved to avoid downstream displacement during flooding.
SPATIAL SORTING BY FLOODING CREATES LONG-TERM INTERPOPULATION VARIATION
Downstream displacement due to flooding can be classified as a form of spatial sorting (Shine et al. 2011a). As stated previously, ours is the first study to observe passive spatial sorting caused by a severe climate event and to provide evidence for the occurrence of microevolution due to spatial sorting. Many studies have suggested that aquatic animals adapt to severe flooding events (e.g., the Sonoran topminnow, Meffe 1984; mayflies, Poff et al. 1991; stream-dwelling benthic invertebrates, Dole-Olivier et al. 1997; turtles, Jones and Sievert 2009; salmonids, Makiguchi et al. 2009; crayfish, Perry et al. 2013; and salamander larvae, Segev and Blaustein 2014, Veith et al. 2019). For instance, in Arizona, the indigenous Sonoran topminnow Poeciliopsis occidentalis is more able to withstand flooding displacement than the exogenous mosquitofish Gambusia affinis, suggesting that the Sonoran topminnow has adapted to periodic flooding (Meffe 1984). Generally, previous studies have implicitly assumed that functional traits to withstand flooding have evolved due to natural selection (see Lytle and Poff 2004). Our study suggests that spatial sorting may also operate alongside or independently of natural selection on microevolution due to flooding (see Shine et al. 2011b).
Previous studies on spatial sorting have mainly focused on the active dispersal of individuals in a population with an expanding range (Lee 2011; Shine et al. 2011a, 2011b; Phillips and Perkins 2019). Similarly, most empirical studies of spatial sorting have examined the evolution of enhanced dispersal ability at the expanding edge of a population's range (native species: Thomas et al. 2001, Simmons and Thomas 2004, Pelletier and Carstens 2016, Reim et al. 2018, Wolz et al. 2020; invasive alien species: Phillips et al. 2006, 2008, Berthouly-Salazar et al. 2012, Messager and Olden 2019; experimental populations: Ochocki and Miller 2017, Weiss-Lehman et al. 2017). Therefore, some studies have posited that spatial sorting does not have lasting evolutionary importance, because individuals at the edge of the range eventually return to the original core range once the period of range expansion has ended, diluting the spatial gradient of phenotypes created by spatial sorting (see Lee 2011; Shine et al. 2011b).
In our study system, the spatial distribution of phenotypes generated by downstream displacement is perpetuated by the presence of a migration barrier, which maintains the integrity of the above-barrier population (see Lee 2011). Therefore, the spatial sorting caused by flooding can have lasting effects on interpopulation variation. Shine et al. (2011b) provided several examples of persistent spatial sorting occurring even in populations that are not experiencing range expansion, in metapopulations, and habitat margins with rapid habitat turnover (i.e., the metapopulation effect; see also Hanski et al. 2002; Dytham 2009; Phillips and Perkins 2019). Our study provides a new mechanism for persistent spatial sorting that should be added to these examples.
FACTORS AFFECTING THE INTENSITY OF SPATIAL SORTING BY FLOODING
Our results also provide some insight into biological and environmental factors that can alter the intensity of spatial sorting due to flooding. The first factor is juvenile body size. In this study, we did not find evidence for the evolution of deeper bodies at above-barrier stations with only one downstream barrier (i.e., stations 3 and 6). Populations at these stations also had smaller bodies than at other stations according to measurements obtained during the field survey prior to the flooding season. Although the reasons for this smaller body size are not clear, the relatively cold water temperatures at these stations due to their high altitude (Table S1) may have suppressed juvenile growth rates. Smaller bodies can be advantageous during flooding because they experience lower hydrologic stress (Moore 1964; Poff et al. 1991; Clark and Kershner 2011), and smaller individuals can more easily escape areas of high flow by seeking safety in shelters and shallow riffles (Good et al. 2001; Clark and Kershner 2011). This advantage of small size has been widely observed in aquatic animals (Moore 1964; Poff et al. 1991; Good et al. 2001; Clark and Kershner 2011). Good et al. (2001) found that larger juveniles of the Atlantic salmon Salmo salar were lost at disproportionately high rates under flood conditions in their first summer of life. In our field experiment, negative effects of body size (i.e., log10 [FL]) were estimated in the analysis of the propensity to ascend steps and the ability to remain above barriers (Table 2). Our results suggest that small body size is an advantage during flooding in this study system. Because the juveniles in above-barrier stations with one downstream barrier in our study already had small bodies, and were therefore better able to withstanding flooding, this may have reduced the effectiveness of spatial sorting during the flooding season (i.e., late June to late July).
Second, the microenvironments that juveniles inhabit during flooding could also alter the intensity of spatial sorting due to flooding. In our field experiment, we detected a relationship between body depth and the proportion of juveniles remaining above the barrier in the second release group, but could not detect this same relationship in the first release group. This discrepancy can be attributed to the difference in water depth at the release point for each group. The maximum depth of the release site for the first release group (in a deep pool created by a step) was about twice that of the release site for the second release group (see Materials and Methods). Deep pools provide safe microenvironments during flooding, as they are less susceptible to strong currents. Radio-tracking studies have shown that the Formosan landlocked salmon Oncorhynchus masou formosanus survives severe flooding by sheltering in deep pools (Makiguchi et al. 2009). Therefore, the effects of spatial sorting due to flooding may be reduced by the availability of deep-water habitats.
GENE FLOWS THAT DIRECTLY FACILITATE INTERPOPULATION VARIATION
Finally, our results also have implications for local adaptation studies. We suggest that downstream displacement of O. masou ishikawae directly facilitates the local evolution of traits that are adaptive against flooding displacement, and thereby creates interpopulation variation. Downstream displacement from above-barrier to below-barrier populations can be viewed as a gene flow system (see Pearse et al. 2009; Plath et al. 2010; Pujolar et al. 2016). In general, gene flow is thought to homogenize any interpopulation variability created by local adaptations (Kawecki and Ebert 2004) by counteracting the effects of natural selection in local environments (Lenormand 2002; Kawecki and Ebert 2004). For instance, Plath et al. (2010) investigated whether displacement (i.e., gene flow) caused by extreme flooding leads to the homogenization of gene pools among locally adapted populations of the Atlantic molly Poecilia mexicana, and found that the magnitude of population mixing among habitat types was small, and that the genetic differentiation created by local adaptation was maintained. Moderate gene flow is known to have an indirect positive effect on local adaptation and interpopulation variation by increasing the genetic diversity of local populations and improving their responsiveness to selection (Gomulkiewicz et al. 1999; Nadeau and Urban 2019). However, this differs fundamentally from the situation examined in this study, in which gene flow had the novel and intriguing effect of directly increasing phenotypic heterogeneity among local populations in a similar manner to a selection pressure.
Conclusion
Our results suggest that O. masou ishikawae has evolved deeper-bodied juveniles in some above-barrier habitats. The evolution of this phenotype is considered to be driven, at least in part, by downstream displacement due to flooding. We argue that this constitutes a novel mechanism of evolution by spatial sorting during severe climate events. The intensity of spatial sorting due to flooding is likely to be affected by juvenile body size and the availability of certain microhabitats. However, additional studies are needed to determine the extent to which downstream displacement is a driving force of morphological evolution in the wild.
AUTHOR CONTRIBUTIONS
Hiroyuki Yamada collected and analyzed the data. Hiroyuki Yamada and Satoshi Wada designed the study and wrote the manuscript.
ACKNOWLEDGMENTS
We thank the staff of the Wakayama Experimental Forest, Field Science Center for Northern Biosphere, Hokkaido University for providing long-term accommodations and helping with our fieldwork. We also thank the editors for their critiques of and constructive comments on the manuscript. This work was supported by a Grant-in-Aid for JSPS Research Fellow (JSPS KAKENHI Grant Number JP 20J20820).
DATA ARCHIVING
Data are available in the Dryad data repository (https://doi.org/10.5061/dryad.280gb5mq4).
CONFLICT OF INTEREST
The authors declare no conflict of interest.
LITERATURE CITED
Associate Editor: M. R. Walsh
Handling Editor: A. G. McAdam
