


Abstract
The importance of hybridization in generating biological diversity has been historically controversial. Previously, inference about hybridization was limited by dependence on morphological data; with the advent of the next-generation sequencing tools for nonmodel organisms, the evolutionary significance of hybridization is more evident. Here, we test classic hypotheses of hybrid origins of two species in the Phlox pilosa complex. Morphological intermediacy motivated the hypotheses that Phlox amoena lighthipei and Phlox pilosa deamii were independent homoploid hybrid lineages derived from P. amoena amoena and P. pilosa pilosa. We use double-digest restriction site-associated DNA sequencing of individuals from throughout the range of these taxa to conduct the most thorough analysis of evolutionary history in this system to date. Surprisingly, we find no support for the hybrid origin of P. pilosa deamii or P. amoena lighthipei. Our data do identify a history of admixture in individuals collected at a contemporary hybrid zone between the putative parent lineages. We show that three very different evolutionary histories, only one of which involves hybrid origin, have produced intermediate or recombinant morphological traits between P. amoena amoena and P. pilosa pilosa. Although morphological data are still an efficient means of generating hypotheses about past gene flow, genomic data are now the standard of evidence for elucidating evolutionary history.
The evolutionary significance of natural hybridization and gene flow has been the subject of theory and debate for decades (Anderson and Stebbins 1954; Stebbins 1959; Barton 2001; Ellstrand 2014; Yakimowski and Rieseberg 2014; Mallet et al. 2016). One of the sources of controversy is disagreement about the prevalence of gene flow and its possible evolutionary outcomes in the wild. Although botanists have long believed natural hybridization to be widespread in plants, zoologists have historically viewed hybridization as less evolutionarily significant (Stebbins 1950; Mayr 1963; Mallet 2005; Arnold 2006; Goulet et al. 2017). Uncertainty has persisted for the simple fact that gene flow is difficult to detect.
For centuries, evidence for hybridization and gene flow depended primarily on morphology, ecology, and/or a low number of molecular markers (Anderson 1949; Gottlieb 1972; Grant 1979, 1981). However, hybridization and gene flow are not necessarily expected to leave consistent or predictable phenotypic clues (Anderson 1948; Rieseberg et al. 1993). Trait-based approaches produced important insights into the evolutionary impact of natural hybridization, but they lacked power and could even mislead researchers about the evolutionary history of a system (Schumer et al. 2013; Owens et al. 2016). Fortunately, next-generation sequencing data offer a new standard of clarity regarding the frequency of natural hybridization and its outcomes, including in many nonmodel systems (Gompert and Buerkle 2013; Payseur and Rieseberg 2016). Restriction-site-associated DNA sequencing (RADseq) and related methods (e.g., ddRAD and GBS) have proven especially powerful because they can be used without access to a reference genome and can frequently scale to large sample sizes at an accessible budget (Baird et al. 2008; Peterson et al. 2012). With these technologies at hand, we should apply them not only to systems in which a detailed evolutionary history has not previously been studied, but also to systems with standing hypotheses of reticulate evolution based on older methods.
In cases where evolutionary consequences of hybridization have been posited and studied, it is important that we confirm the action of hybridization and gene flow with the new data and analyses that are now available. Genomic data are not simply the latest incremental improvement, but rather a paradigm shift in our sensitivity to detect (or fail to detect) a history of gene flow. In cases where next-generation sequencing fails to find evidence in support of a previous hypothesis of reticulate evolution, we need to ask ourselves what to make of previous evidence for hybridization (Schumer et al. 2013; Owens et al. 2016). These discrepancies are not simply opportunities to compare methods, but are chances to think critically about how traits evolve on a phylogeny and update our expectation of the consequences of hybridization.
Hypotheses of ancient hybridization and gene flow often posit specific evolutionary consequences, for example, reinforcement, adaptive introgression, or hybrid speciation (Anderson and Stebbins 1954; Schumer et al. 2014; Yakimowski and Rieseberg 2014; Garner et al. 2018). These phenomena have been popular subjects of both theory and empirical study because they offer mechanisms by which gene flow, which is otherwise expected to erode genetic diversity, could contribute to diversification (Pardo-Diaz et al. 2012; Suarez-Gonzalez et al. 2016; Wang et al. 2021). However, in many cases where natural hybridization has been identified, its consequences remain unknown. Natural hybridization can also shed light on the genetic variants that contribute to differentiation between populations and species, for instance at hybrid zones (Barton 1979; Harrison 1990; Janoušek et al. 2012).
Natural hybridization is thought to be widespread within the genus Phlox (Anderson and Gage 1952; Levin 1963, 1975; Levin and Schaal 1970). Hybridization produced a classic case of reinforcement in P. drummondii (Levin 1975; Hopkins and Rausher 2012) and is also thought to have led to both allopolyploid and homoploid hybrid speciation (Levin 1966; Levin and Smith 1966; Smith and Levin 1967; Fehlberg and Ferguson 2012). Phlox amoena amoena [amoena] and Phlox pilosa pilosa [pilosa] are outcrossing perennial wildflowers native to the midwestern and southern United States. These species are the hypothesized parents of two putative homoploid hybrid species, Phlox pilosa deamii [deamii] and Phlox amoena lighthipei [lighthipei] (Fig. 1; Levin and Smith 1966). All four taxa are diploid and have the same chromosome number (n = 7) and similar C-values (around 6 pg, or roughly 6 Gbp) (Zale 2014). The ranges of pilosa and amoena overlap in a broad swath from western Kentucky to southern Georgia. Within this zone of sympatry, deamii is found in the northwestern corner in western Kentucky and southern Indiana, whereas lighthipei occurs in the southeastern corner in southern Georgia and northern Florida. Although the putative hybrid species live within the ranges of their putative parent lineages, they have not been found to co-occur in the same locality with either parent, suggesting differences in habitat preference (Levin and Smith 1966; Locklear 2011; Zale 2014).
![Phlox pilosa deamii [deamii] and P. amoena lighthipei [lighthipei] are hypothesized to be homoploid hybrid species derived from P. amoena amoena [amoena] and P. pilosa pilosa [pilosa]. The geographic ranges of amoena and pilosa overlap across a broad swath of the southeastern United States, and the ranges of deamii and lighthipei are restricted to smaller areas at opposite corners of this zone of sympatry. The putative hybrid species (deamii and lighthipei) will be noted by an asterisk throughout the figures.](https://oup.silverchair-cdn.com/oup/backfile/Content_public/Journal/evolut/75/7/10.1111_evo.14279/3/m_evo14279-fig-0001.jpeg?Expires=1750188893&Signature=YH-qRvivAGjlKRUUilL~HaOgtZX-NMMgq129fCe1-Ju6jxr4h1oRO2WU57hV-HK8zy2mEV4Lh-NhYt2KkuQ1SWC8NUN1Od5oXInU4aq2EGPyg08LM98enNDiFGgTN7hig2m5PY9dU-cVTyGbLO3d7pt3qVsnhTKG89q9Qk1HJedEQ~tlUkF1VK12S5lWADz3GLQI-UYBTNqFr9Nwh4yF7gAHjP6eqCroJCE64lx-1jzCNSuu2KwAb4~JuS1h5k-wlUV8dQECQBv3q4xBfyeAqHOhftN~hoy6vup3d8AVU9oLlPP5pop4v-zKfDqWvYKghjnBUSByBkCuP78xr3ZylQ__&Key-Pair-Id=APKAIE5G5CRDK6RD3PGA)
Phlox pilosa deamii [deamii] and P. amoena lighthipei [lighthipei] are hypothesized to be homoploid hybrid species derived from P. amoena amoena [amoena] and P. pilosa pilosa [pilosa]. The geographic ranges of amoena and pilosa overlap across a broad swath of the southeastern United States, and the ranges of deamii and lighthipei are restricted to smaller areas at opposite corners of this zone of sympatry. The putative hybrid species (deamii and lighthipei) will be noted by an asterisk throughout the figures.
The hybrid origin hypotheses for deamii and lighthipei were originally based on the observation that they have morphological characters that are recombined or intermediate between amoena and pilosa and that deamii- and lighthipei-like traits are observed at contemporary hybrid zones between amoena and pilosa in Tennessee and Alabama (Levin and Smith 1966; Zale 2014). The relatively restricted ranges of deamii and lighthipei at opposite corners of a large zone of sympatry between the putative parent species bolstered the hypotheses. Further studies of deamii concluded that seed protein profiles (Levin and Schaal 1970) and microsatellite markers (Fehlberg et al. 2014) are consistent with genetic variation in deamii being derived from amoena and pilosa. Thus, in this system, we have access to two putative homoploid hybrid lineages (deamii and lighthipei), both putative parent species (amoena and pilosa), as well as recent hybrid individuals from a contemporary amoena-pilosa hybrid zone.
Observations of morphology and hybrid zones for both taxa, as well as seed proteins and microsatellites for deamii, are consistent with the hypothesis of homoploid hybrid origin. However, more rigorous tests for signatures of hybridization have not been performed in this system. Our goal is to assess genetic variation, population structure, and evolutionary history of these four closely related lineages of eastern Phlox, focusing particularly on their areas of range overlap. In doing so, we will explicitly test the standing hypothesis that deamii and lighthipei are stabilized lineages that originated via hybridization between pilosa and amoena.
Methods
SAMPLING
We collected wild growing plants throughout the southeastern United States, both within and outside of the area of sympatry between amoena and pilosa. In total, we sequenced plants from seven populations of Phlox amoena amoena (48 amoena individuals in total), three populations of Phlox amoena lighthipei (14 lighthipei individuals in total), 10 populations of Phlox pilosa pilosa (59 pilosa individuals in total), and three populations of Phlox pilosa deamii (15 deamii individuals in total) (Table S1). Additionally, we sequenced eight individuals [amoXpil] collected at a contemporary amoena-pilosa hybrid zone in western Tennessee that were putative early generation hybrids based on morphological intermediacy between amoena and pilosa. Finally, for geographic and phylogenetic context, we included eight individuals of Phlox pilosa sampled in the northern edge of their range that have historically been considered Phlox pilosa pilosa [pilosa(N)] or Phlox pilosa fulgida [fulgida], six individuals of the closely related species Phlox divaricata [divaricata], and two individuals of outgroup species Phlox subulata [subulata]. One fulgida individual, one pilosa(N) individual, and both subulata individuals were sourced from the Ornamental Plant Germplasm Center (OPGC) at Ohio State University, and the rest were wild collected. In total, 160 individuals were sequenced for this study. All wild plants were collected as cuttings that were rooted and grown in a greenhouse before gathering tissue for DNA extraction.
MORPHOLOGY
We measured several leaf morphology and physiology traits on all wild-collected plants, including plants that were not used for DNA sequencing (Table S1). We also measured five amoena X pilosa F1 hybrid individuals that were produced by crossing wild collected plants in the greenhouse. After we collected plants as cuttings, we rooted and grew them in a greenhouse for several months to allow them to produce new leaves. From each plant, the most recently fully expanded leaf was collected and the following measurements taken: fresh mass, relative chlorophyll content using an atLeaf chlorophyll meter (FT Green, Wilmington, DE, USA), and dry mass. Each leaf was also scanned while fresh, and we used ImageJ to measure leaf length, width, area, and perimeter. We calculated specific leaf area (SLA) as area (cm2) divided by dry mass (g). We summarized variation in leaf traits by performing principal component analysis (PCA) on leaf length, width, length/width ratio, area, relative chlorophyll content, and SLA using the correlation matrix.
ddRAD SEQUENCING
DNA was extracted from fresh leaf tissue using the P1 and P2 buffers from an EZNA Plant DNA kit (Omega Bio-Tek) with RNase A, followed by a chloroform extraction and two washes with cold 96% ethanol. We prepared libraries for sequencing with a double-digest restriction site-associated DNA sequencing (ddRAD-seq) protocol (Peterson et al. 2012). For each sample, 120 ng of DNA was digested using the restriction enzymes PstI (6 bp recognition site) and MspI (4 bp recognition site). We ligated a unique combination of two DNA barcodes at the cut sites, one of which contained a unique molecular identifier (a sequence of eight random nucleotides) that would allow us to identify and remove PCR amplification errors after sequencing (Kivioja et al. 2012). Samples were then cleaned with AMPure beads (Beckman Coulter Life Sciences) before 18 cycles of PCR amplification. Individual libraries were quantified using a Qubit Fluorometer (Thermo Fisher Scientific) before being pooled in equimolar quantities. We used a Pippin Prep (Sage Biosciences) to select DNA fragments between 300 and 500 bp. Finally, the pooled and size-selected library was cleaned using a Monarch PCR and DNA Cleanup Kit (New England Biolabs). Samples were paired end sequenced (2 × 150 bp) at the Bauer Core of Harvard University on one lane of an Illumina NovaSeq 6000. Illumina reads are accessible in NCBI's Sequence Read Archive (SRA; http://www.ncbi.nlm.nih.gov/sra; SRA data PRJNA701424).
ASSEMBLY AND ANALYSIS OF SEQUENCE DATA
After receiving the raw sequence data, we used a custom Python script to move the unique molecular identifier to the header of each read (https://github.com/bengoulet11/Phlox_hybrid_hypotheses). Then, we used the “process radtags” and “clone filtering” functions in STACKS 2.4 (Catchen et al. 2013) to demultiplex our samples and filter for PCR errors using the unique molecular identifier. After demultiplexing and clone filtering, we used Trimmomatic to remove adapter sequences and trim reads based on quality score (Bolger et al. 2014). We assembled the demultiplexed, filtered, and trimmed reads using the de novo assembly method in the ipyrad 0.9.50 pipeline (Eaton and Overcast 2020) with the parameters specified in Table S2. The final assembly included 16,024 RAD loci that were present in at least 40 individuals (25% of total sample). A “RAD locus” consists of the consensus sequence from each cluster of trimmed and merged paired-end reads. The computations in this article were run on the FASRC Cannon cluster supported by the FAS Division of Science Research Computing Group at Harvard University (https://www.rc.fas.harvard.edu/).
We used IQ-TREE 1.6.10 (Nguyen et al. 2015) to estimate a maximum likelihood phylogeny, using the PHYLIP format output from ipyrad, which included all 16,024 RAD loci (2,717,120 sites; 323,087 SNPs). We ran IQ-TREE with a general time reversable (GTR) substitution model and the ultrafast bootstrap approximation (Hoang et al. 2018) to estimate branch support values, specifying 10,000 replicates. The resulting tree was rooted at known outgroup subulata (Ferguson and Jansen 2002).
We performed PCA on our assembled data as implemented in the ipyrad-analysis toolkit. Prior to analysis, SNP data were filtered to require that each SNP was present in at least 50% of individuals within each taxon and furthermore that each SNP was present in at least 75% of individuals overall. Missing data were imputed using the “sample” method in ipyrad-analysis (Eaton and Overcast 2020). That is, missing genotypes were randomly sampled based on the frequency of alleles at that site in each taxon. The choice to impute or not impute missing data did not affect the grouping of individuals into clusters nor the relationships among clusters. Finally, one SNP per RAD locus was randomly subsampled to reduce the effects of linkage. After filtering, 1,694 SNPs were included in the analysis.
To infer population structure and admixture, we ran STRUCTURE (Pritchard et al. 2000) as implemented in the ipyrad-analysis toolkit. Data were filtered as in the PCA analysis, except that SNPs were required to be present in at least 90% of individuals overall, and no subsampling step was performed. The filtered SNP matrix included 18,149 sites with 4.92% missing data. We ran STRUCTURE with a burn-in period of 150,000 and 200,000 MCMC generations with K = 2-7, repeated 20 times each. The optimal value of K was chosen using the statistic ΔK (Evanno et al. 2005). Both PCA and STRUCTURE analyses identified three major groups within our focal taxa: one consisting of all pilosa samples, one consisting of all amoena + lighthipei samples, and one consisting of all deamii + fulgida/pilosa(N) samples. To further investigate genetic clustering within these groups, we performed separate STRUCTURE analyses on each of these three groups (as in Spriggs et al. 2019). We re-filtered the data for each of the three groups, this time requiring that SNPs were present in at least 40% of individuals from each sampled population and 90% of all individuals in the group. Then we ran STRUCTURE with a burn-in period of 150,000 and 200,000 MCMC generations with K = 1-4, repeated 20 times each. Again, we used the statistic ΔK to choose the optimal value of K.
We calculated Weir and Cockerham FST between all pairs of populations that included at least four individuals collected at the same site using VCFtools 0.1.14 (Weir and Cockerham 1984; Danecek et al. 2011). We used the R package vegan 2.5-6 (Oksanen et al. 2020) to perform Mantel tests on the association between FST and geographic distance between populations, specifying 1,000 permutations.
We used TreeMix (Pickrell and Pritchard 2012) as implemented in the ipyrad-analysis toolkit to infer a population network that describes the relationship between our samples, allowing for both population splits and migration (admixture). We filtered the dataset by grouping individuals by population for wild-collected plants in our focal taxa, or by taxon for divaricata and fulgida/pilosa(N), and then requiring that SNPs were present in at least 40% of individuals from each population. Then, one SNP was randomly sampled from each RAD locus to diminish the effects of linkage. After filtering and subsampling, 1,472 SNPs were included in the analysis. Based on our phylogenetic analysis, we defined deamii populations as an outgroup and ran TreeMix with m = 0-10. To determine the best supported number of migration edges (m), we plotted ln(likelihood) of each model as the number of migration edges was increased (Fig. S1). We used the same filtered dataset to calculate all possible f3 (Reich et al. 2009) and f4 (Keinan et al. 2007) statistics as implemented in TreeMix.
Results
MORPHOLOGY
We summarize variation across focal lineages in six leaf morphology and physiology traits (leaf length, width, length/width ratio, area, relative chlorophyll content, and SLA) using a PCA (Fig. 2A). The first two principal components explain 77% of the variation. The putative parental lineages (pilosa and amoena) form distinct morphological clusters along PC1. The putative hybrid lineage, deamii, has been considered a subspecies of P. pilosa, yet is morphologically distinct from other pilosa individuals and phenotypically overlaps considerably with amoena plants. The putative hybrid lineage, lighthipei, has been considered a subspecies of P. amoena but is also morphologically distinct from other amoena individuals and shows overlap with pilosa, instead. Furthermore, we confirm that deamii and lighthipei are intermediate to pilosa and amoena in leaf length/width ratio (Fig. 2B), recapitulating observations that contributed to the hybrid origin hypothesis for these two taxa (Levin and Smith 1966).
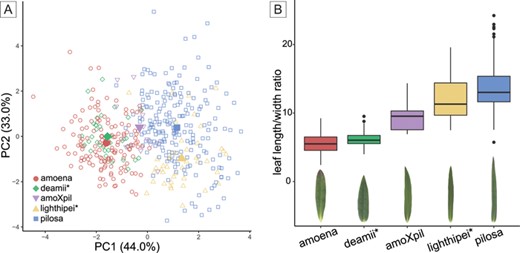
(A) Principal component analysis (PCA) of six morphological and physiological leaf traits (leaf length, width, length/width ratio, area, relative chlorophyll content, SLA). The centroid for each taxon is indicated by the larger, solid shape. (B) Boxplot comparing leaf length/width ratio by taxon (consistent with figs. 2-3 in Levin and Smith 1966). Below each box is a typical leaf and flower from each taxon.
ddRAD SEQUENCING
The assembled RADseq dataset includes 16,024 loci that are present in at least 40 out of 160 (25%) individuals (Table S3). These loci include 323,087 SNPs, with 53.52% missing data in the SNP matrix. This SNP matrix was filtered significantly before performing analyses to reduce the effects of missing data and linkage, as described in the methods.
RELATIONSHIPS AMONG TAXA
Although a set of morphological and physiological leaf traits supports the taxonomic distinctions among amoena and lighthipei as well as pilosa and deamii, phylogenetic analysis of the 16,024 RAD loci suggests very different stories for these two pairs of subspecies (Fig. 3A). We find strong support (ultrafast bootstrap = 100) for P. amoena lighthipei individuals forming a monophyletic clade nested within the broader diversity of P. amoena. However, we find that P. pilosa deamii individuals are in fact not closely related to P. pilosa pilosa individuals collected throughout the southeastern United States. Rather, southern P. pilosa pilosa individuals are more closely related to P. amoena and P. divaricata individuals than they are to P. pilosa deamii or P. pilosa pilosa individuals collected in the northern United States. We find that all P. pilosa deamii individuals form a clade sister to a clade composed of P. pilosa fulgida and P. pilosa pilosa individuals from the northern United States. Together, deamii, fulgida, and pilosa(N) form an outgroup to a clade containing P. divaricata, P. amoena, and the rest of P. pilosa. Thus, the species P. pilosa is paraphyletic as it is currently defined.
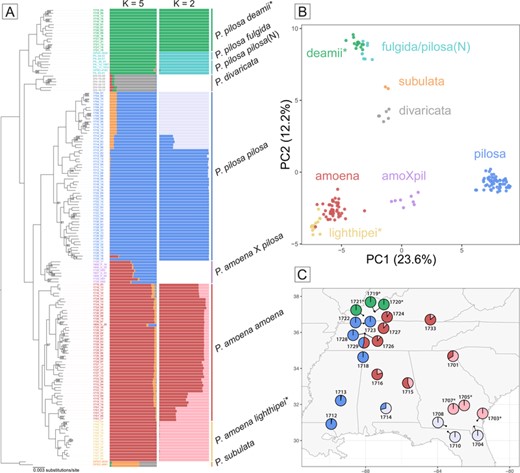
(A) Maximum likelihood phylogenetic inference for a subset of the eastern perennial Phlox based on 16,024 RAD loci. Ultrafast bootstrap support values from IQ-TREE are reported at nodes for which UFBoot < 100. Bar plot showing the inferred ancestry proportions for each individual included in the phylogeny from the program STRUCTURE. On the left, the best supported value of K = 5 for all individuals in the dataset. On the right, the results of three separate STRUCTURE analyses with K = 2 for each of the three primary groups indentified by phylogeny, PCA, and STRUCTURE (deamii + fulgida/pilosa(N), pilosa, and amoena + lighthipei). (B) Principal component analysis (PCA) based on 1,694 SNPs from the RAD dataset. (C) Location of wild populations of our four focal taxa that were sampled for RAD sequencing. Pies are colored according to nested STRUCTURE analyses and represent the average inferred ancestry proportions across individuals collected at that site. Asterisks indicate deamii and lighthipei populations.
Eight individuals collected at a contemporary amoena-pilosa hybrid zone that are putative early generation hybrids based on leaf morphology form a group sister to the rest of southeastern P. pilosa pilosa, consistent with a more complex genetic composition.
POPULATION STRUCTURE
We use a PCA of genome wide variation in SNPs to structure variation across all the lineages. The first two principal components explain 35.8% of variation (Fig. 3B). Across these two axes, our focal taxa separate into three distinct clusters composed of pilosa, amoena + lighthipei, and deamii + fulgida/pilosa(N). PC1 separates pilosa from amoena + lighthipei. The eight putative hybrid individuals (amoXpil) collected at the contemporary amoena-pilosa hybrid zone are intermediate between the pilosa and amoena + lighthipei clusters along PC1. PC2 separates deamii + fulgida/pilosa(N) from amoena + lighthipei and pilosa, as well as subulata and divaricata.
A STRUCTURE analysis including all individuals recapitulates the separation of our focal taxa into three distinct groups: pilosa, deamii + fulgida/pilosa(N), and amoena + lighthipei (Fig. 3A). Nested STRUCTURE analyses within these groups separate the pilosa and amoena + lighthipei clusters into groups that correspond to a north/south division (Fig. 3C). Within the deamii + fulgida/pilosa(N) cluster, a STRUCTURE analysis cleanly separates deamii individuals from fulgida/pilosa(N). The eight putative hybrid individuals collected at the contemporary amoena-pilosa hybrid zone show strong evidence of mixed ancestry between the pilosa cluster and the amoena cluster. This is in contrast with deamii and lighthipei individuals, which show no evidence of mixed pilosa and amoena ancestry.
We find a consistent and high FST (∼0.6) in comparisons between populations of the three distinct groups recovered by both PCA and STRUCTURE analyses (Fig. 4A, “inter” comparisons). Within the pilosa (Mantel test; r = 0.924; P < 0.001) and amoena + lighthipei (Mantel test; r = 0.667; P < 0.001) groups, we find a clear signature of isolation by distance (Fig. 4B). Within the deamii + fulgida/pilosa(N) cluster, population-level sampling was too shallow to perform enough FST calculations to assess isolation by distance. Notably, values of FST between lighthipei and amoena populations show a pattern of isolation by distance comparable to other intraspecific comparisons suggesting genetic divergence is better predicted by geographic distance than taxonomic grouping (Fig. 4A). In contrast, FST values between populations of deamii and pilosa are consistently high (∼0.6), do not scale with distance, and are indistinguishable from interspecific comparisons, suggesting that they do not freely exchange genetic variation.
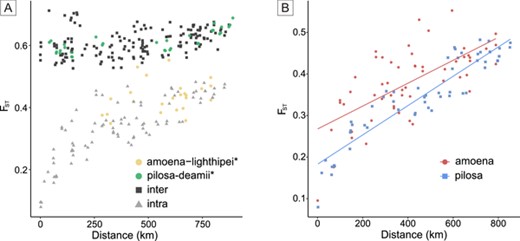
(A) Pairwise FST calculated between all populations with at least five individuals sampled (one lighthipei population had only four individuals sampled but is still included) versus the distance in kilometers between the populations being compared. Points are colored according to whether they are comparisons between populations of the same subspecies (intra) or different subspecies (inter). Intersubspecies comparisons between amoena and lighthipei or between pilosa and deamii are highlighted in yellow and green, respectively. (B) Intraspecies FST versus distance comparisons for pilosa (Mantel test; r = 0.924; P < 0.001) and amoena + lighthipei (Mantel test; r = 0.667; P < 0.001) showing a strong signature of isolation by distance. Populations of amoena and lighthipei were grouped together for this analysis in agreement with phylogenetic, PCA, and STRUCTURE results.
TESTS FOR GENE FLOW
A TreeMix analysis finds robust support for only a single migration edge, consistent with hybridization at the contemporary amoena-pilosa hybrid zone (Figs. 5 and S1). This is true whether samples are grouped by population or by taxon (Fig. S1). Notably, these analyses do not find support for gene flow involving deamii or lighthipei. Including additional migration edges in the model does not significantly improve the likelihood compared to the improvement gained by adding the first migration edge (Fig. S1). Furthermore, we find no indication of any gene flow event consistent with either hybrid origin hypothesis when the number of migration edges in the model is increased above m = 1 (Fig. S2). Rather, additional migration edges suggest the possibility of gene flow between amoena and fulgida/pilosa(N) (Fig. S2). We also calculated all possible f3 statistics as implemented in TreeMix with samples grouped by taxon and by population (Table 1; Fig. S3). The f3 statistics that explicitly test hybrid origin hypotheses for deamii and lighthipei fail to find support for historical gene flow. All significantly negative f3 statistics (consistent with a history of gene flow) (Z-score < −3; P < 0.001) infer that amoXpil individuals from the contemporary hybrid zone are the product of admixture between pilosa and either amoena or lighthipei. Likewise, f4 statistics only find support for admixture involving amoXpil (Table S4). These results suggest that the methods can detect a signature of gene flow from this dataset, yet they do not support the hypothesis of hybrid origin for deamii or lighthipei.
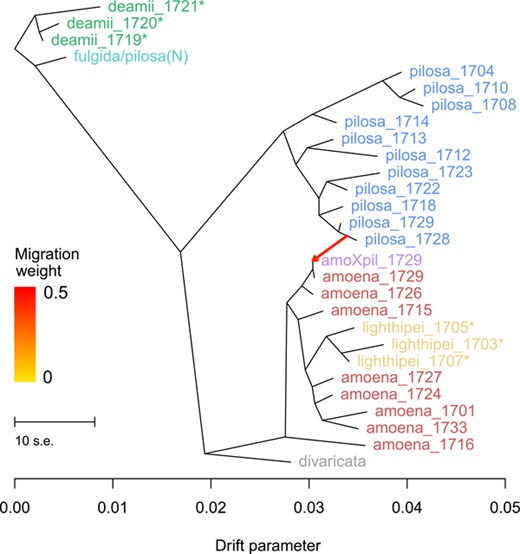
(A) Results from TreeMix analysis for all populations with at least five individuals sampled (with the exception of lighthipei_1707, which had four individuals). A single migration event is supported, involving pilosa individuals from the contemporary hybrid zone (pilosa_1728 and pilosa_1729) and putative amoena X pilosa hybrid individuals (amoXpil_1729) sampled from the same site. These putative hybrids group with amoena individuals from the same site (amoena_1729 and amoena_1726) in the TreeMix graph.
Summary of f3 statistics explicitly testing hybrid origin hypotheses for deamii, lighthipei, and amoXpil individuals from the contemporary hybrid zone. We calculated f3 statistics with individuals grouped by taxon or by population, and the only significant tests (Z-score < −3; P < 0.001) infer that amoXpil individuals are the product of admixture between pilosa and either amoena or lighthipei
| Grouped by taxon | Grouped by population | ||||
|---|---|---|---|---|---|
| Test | f3 statistic | Standard error | Z-score | Total tests | Significant (Z < −3) |
| deamii;amoena,pilosa | 0.0198 | 0.00167 | 11.85 | 264 | 0 |
| deamii;lighthipei,pilosa | 0.0199 | 0.00172 | 11.54 | 99 | 0 |
| lighthipei;amoena,pilosa | 0.0060 | 0.00096 | 6.22 | 264 | 0 |
| amoXpil;amoena,pilosa | −0.0045 | 0.00041 | −10.75 | 88 | 83 |
| amoXpil;lighthipei,pilosa | −0.0030 | 0.00061 | −4.88 | 33 | 28 |
Discussion
We fail to find support for the long-standing hypothesis of hybrid origin for P. pilosa deamii and P. amoena lighthipei. Although our morphological measurements of wild-collected plants are consistent with observations that inspired the hypothesis of hybrid origin in these lineages (Levin and Smith 1966; Zale 2014), patterns of DNA sequence variation are not consistent with hybrid origin. Our analyses demonstrate that lighthipei populations are nested within the diversity of P. amoena amoena and most closely related to geographically proximal populations of amoena from Georgia and Alabama. On the other hand, deamii is distantly related to P. pilosa pilosa from the southeastern United States. Rather, we find that deamii is most closely related to fulgida and pilosa(N) in such a way as to render the species P. pilosa as well as the subspecies P. pilosa pilosa paraphyletic as currently defined. Neither lighthipei nor deamii shows signatures of gene flow with other lineages in our sample. However, our genomic methods did identify a strong signature of hybridization in eight individuals collected at a contemporary amoena-pilosa hybrid zone.
Although putative parent lineage P. pilosa pilosa appears to be paraphyletic, the original hybrid speciation hypotheses for both deamii and lighthipei were based on “numerous populations collected in the southeastern United States” (Levin and Smith 1966). That is, the original hybrid origin hypotheses considered P. pilosa pilosa populations from the lineage we have abbreviated “pilosa” to be the putative parent, not the lineage we have abbreviated “pilosa(N).” However, subsequent research that found support for a hybrid origin of deamii treated P. pilosa pilosa as a single entity, sampling from both southern and northern populations (Levin and Schaal 1970; Fehlberg et al. 2014). Mixed sampling could help explain why previous studies concluded a hybrid origin of deamii, because pilosa(N) is more closely related to deamii than to pilosa. Regardless, our analyses find no support for deamii being derived from hybridization between amoena and either southern or northern P. pilosa pilosa.
Without a reference genome in the Phlox system, we are currently limited to reduced representation sequencing approaches, such as RADseq, to sample genetic markers at the genomic scale. The number of loci and SNPs recovered in our study is on the order of other studies that use similar methods to investigate evolutionary history (Martin et al. 2015; Lavretsky et al. 2019; Reyes-Velasco et al. 2020) and considered appropriate to evaluate phylogenetic relationships, population structure, and gene flow (Andrews et al. 2016).
One known limitation of RADseq data is that they are likely to undersample the most divergent haplotypes in a sample due to the possibility of polymorphism at restriction sites (Arnold et al. 2013). However, this bias should not compromise our ability to detect gene flow and test the hybrid origin hypotheses. If anything, this bias would favor the recovery of loci involved in gene flow among sampled lineages, because portions of the genome that are admixed will share more recent common ancestry than those that are not. In spite of this potential bias, we still find no support for the hybrid origin of deamii or lighthipei but are able to detect admixture at the contemporary hybrid zone.
How should we make sense of the apparent conflict between previous evidence supporting the hybrid origin hypotheses and our RADseq data presented here that rejects these hypotheses? Although morphology has often been invoked to propose or support hypotheses of gene flow, particularly in cases of recent or ongoing hybridization, there are no clear expectations about how morphological traits evolve in a hybrid lineage (Rieseberg et al. 1993). Even in systems such as the Phlox studied here that have multiple signatures of morphological and molecular intermediacy, it is now imperative that we use genomic data as the benchmark for durable inference of hybridization and gene flow. Our results in Phlox highlight three general points. First, hybrid origin does not predict morphology. Second, morphology does not predict hybrid origin. Finally, we consider how genomic data have changed, and will continue to change, our understanding of the frequency and consequences of natural hybridization and gene flow.
Hybridization and gene flow produce predictable patterns in genetic variation (Gompert and Buerkle 2013; Payseur and Rieseberg 2016). In contrast, morphological evolution is an epiphenomenon of changes at the DNA sequence level. The number of genetic loci controlling a trait, the dominance relationships among alleles at those loci, the degree to which interactions among those loci are additive or epistatic, and the effect of the environment on trait expression all influence how genetic change translates to phenotypic change. Therefore, hybrid origin does not produce predictable patterns in morphological variation. It is intuitively satisfying to imagine that intermediate trait values arise because a hybrid lineage recombines alleles from both parents across multiple additive loci underlying a quantitative trait. However, traits subject to strong dominance interactions may closely resemble one or the other parent in a hybrid lineage (Thompson et al. 2021). Alternatively, quantitative traits that are controlled by many loci that interact epistatically may be transgressive (outside of the range of parental variation) in a hybrid lineage. In fact, even quantitative traits that are controlled by loci with strictly additive interactions can yield transgressive trait values beginning with the F2 generation of a hybrid lineage (Rieseberg et al. 2003). Therefore, the full range of morphological trait values—intermediate, parent-like, or transgressive—may be consistent with hybrid origin within two generations, depending on underlying genetic architecture, which is typically unknown.
Because of the difference between genetic and phenotypic predictability, patterns of genetic variation can be used to infer hybrid origin, but patterns of phenotypic variation cannot. For example, a lineage exhibiting intermediate morphology between two putative parent lineages may be consistent with hybrid origin, as we demonstrate for the hybrid Phlox individuals from a contemporary hybrid zone between amoena and pilosa. Alternatively, intermediate morphology is possible for a lineage that is nested within one of the putative parent lineages, as we demonstrate is the case for lighthipei. Finally, intermediate morphology may be exhibited by an outgroup to the clade containing both putative parent lineages, as we demonstrate is the case for deamii. Therefore, without detailed knowledge of the genetic architecture of the trait(s) in question, morphology does not predict hybrid origin.
We can more confidently model how genomic variation will evolve following hybridization than we can morphological or physiological variation. Therefore, genomic data offer more powerful tests for the presence of gene flow. Genomic data have been used to demonstrate that gene flow is widespread in natural systems, including in plants where gene flow was historically believed to be widespread, as well as in animals where gene flow was historically believed to be rarer (Payseur and Rieseberg 2016; Taylor and Larson 2019). The increasing availability of genomic data in new study systems will continue to improve our understanding of the frequency and consequences of natural hybridization and gene flow. Meanwhile, it is important that we revisit gene flow hypotheses in historically important systems for which genomic variation has not yet been analyzed. This is particularly true in plant biology, where many of our current ideas about hybridization and gene flow arose.
There is a long history in plant biology of identifying hybridization through the use of hybrid indices (emphasizing intermediate trait values) (Riley 1938; Anderson 1949). This led to an understanding that natural hybridization between species is relatively widespread in plants (Stebbins 1959; Grant 1981). Genomic tests for hybridization and gene flow have confirmed extensive natural hybridization in plants, and indeed in animals as well. However, this presents something of a paradox. The major evidence used to establish the idea of widespread hybridization, the phenotypic hybrid index, is no longer believed to be reliable for supporting such hypotheses. Yet, the profound insights inspired by that data, including the prevalence of natural hybridization and the implications of hybridization for future evolutionary trajectories, seem to be confirmed by independent and more rigorous DNA sequence-based analyses. This suggests that many cases of natural hybridization may leave phenotypic clues, at least in plants and to the eyes of a talented naturalist, even though individual examples may later be overturned. Indeed, phenotypic hybrid indices are still a crucial tool for generating hypotheses of natural hybridization. It is also worth noting that the plant biologists who first proposed many of our ideas about hybridization and evolution understood the limitations of the evidence they could access (Anderson 1948; Gottlieb 1972).
Thorough quantification of phenotypic variation across clades is still incredibly valuable data. A morphology-independent approach to inferring evolutionary history allows us more power to consider how trait variation evolves on phylogenies with or without reticulation. When gene flow is inferred in a system, phenotypic data are critical for evaluating its possible evolutionary consequences. Coupling genomic and phenotypic data will also improve our understanding of the relationship between historical gene flow and contemporary trait values. For instance, if we can gather enough corresponding datasets of genetic variation and trait variation across clades, we may be able to better predict scenarios under which phenotypic variation is more likely to reflect evolutionary histories involving gene flow. For example, hybrid indices may be more likely to accurately reflect a history of gene flow in systems that have undergone introgression (gene flow dominated by backcrossing to one of the parent lineages) than in systems of hybrid origin (gene flow dominated by intercrossing among hybrid individuals). This could be the case if the traits measured for a hybrid index are typically quantitative traits determined primarily by additive gene interactions and for which the hybridizing lineages do not possess antagonistic alleles that could lead to transgressive segregation (however, such variation appears to be common in nature; see Rieseberg et al. 1999, 2003).
The idea that natural hybridization in plants is relatively frequent has been validated by more rigorous DNA sequence-based analyses. Phenotypic hybrid indices are still an efficient way to generate hypotheses of gene flow in natural systems. Intermediate trait values and the context of overlapping geographical ranges produced two compelling hypotheses of hybrid origin in the Phlox pilosa complex. However, we must be aware of the assumptions this approach makes about the genetic architecture of the trait(s) being measured and recognize that gene flow does not necessarily produce a predictable signature in trait evolution. Our study is a cautionary tale in which patterns of genomic sequence variation overturn strong morphological evidence suggesting hybrid origin.
AUTHOR CONTRIBUTIONS
BEG-S conceived of the project. BEG-S and AGG collected and sequenced plant material. BEG-S analyzed the data and wrote this article with input and contributions from all authors.
ACKNOWLEDGMENTS
We are grateful to E. Spriggs and M. Farnitano for assistance with data analysis, and to B. Bickner, G. Burgin, S. Chaturvedi, C. Hale, and A. Serrato-Capuchina for helpful discussions. We would also like to thank A. Brown, A. Cone, A. Goulet, J. Campbell, J. Cotton, N. Crawford, C. Ferguson, E. Raikes, and R. Carter (Valdosta State University Herbarium) for assistance with collecting specimens, the Arnold Arboretum greenhouse staff for plant care, and Hancock Biological Station (Murray State University). Finally, we thank the US Forest Service, South Carolina Department of Natural Resources, and Tennessee Valley Authority for permission to collect specimens. This research was funded by a Graduate Research Excellence Grant – Rosemary Grant Advanced award to B. Goulet-Scott from the Society for the Study of Evolution. R. Hopkins was supported by NSF grant 1844906.
CONFLICT OF INTEREST
The authors declare no conflict of interest.
DATA ARCHIVING
Raw sequence data are stored on the NCBI sequence read archive: PRJNA701424.
LITERATURE CITED
Associate Editor: Dr. Rebecca Fuller
Handling Editor: Prof. Tracey Chapman
