


Abstract
The relationship between organismal function and form is a cornerstone of biology because functional diversity is key to generating and maintaining ecological diversity. Morphological changes often occur in unison with behavioral or ecological transitions, and this process may foster diversification, but alternately could trap a species on an adaptive peak. We estimated the most comprehensive phylogenetic hypothesis of Murinae, a young (∼15 million years) and diverse (∼700 species) clade of mammals. We then tested for correlated evolution among four morphological traits with potential links to locomotor modes (Arboreal, General, Terrestrial, and Amphibious), then investigated the effects of locomotion on morphological and lineage diversification. We found unique combinations of trait values for each locomotor mode, including strong covariance between the tail and hindfoot lengths of specialized Arboreal and ecologically flexible General species. Low diversification rates and long branch lengths suggest that specialized lineages represent stable evolutionary “cul-de-sacs.” General species, characterized by the classic “rat-like” body plan and broad locomotor abilities, have narrow optimal trait values and slow phenotypic evolution, but high lineage diversification rates. Our findings suggest that versatile, generalist forms act as seeds of species diversity and morphological specialization, which together build ecologically diverse radiations.
An organism is a complex assemblage of interconnected traits that frequently covary in predictable patterns. Morphological change and habitat transition often occur in unison over evolutionary time scales (Losos 2009; Collar et al. 2011) and these transitions may alter the tempo of diversification (Stroud and Losos 2016; Alencar et al. 2017). Historically, much of the research exploring links among phenotype, ecology, and diversification focused on a single trait or key innovation (Heard and Hauser 1995). However, investigating integrated functional systems with more direct connections to organismal ecology may better elucidate the relationship between morphological form and diversification (Heard and Hauser 1995; Piglucci 2003; Goswami et al. 2014).
Although some niche transitions promote diversification (Schluter 2000; Near et al. 2012), others have little effect on a clade's evolutionary success, or may even hinder its diversification (Collar et al. 2009; Alhajeri and Steppan 2018). The “dead-end” or “cul-de-sac” hypothesis suggests that adaptive phenotypic change may push an organism toward an isolated adaptive peak, thereby decreasing the likelihood of further phenotypic differentiation (Simpson 1944; Buckling et al. 2003; Colles et al. 2009; Gajdzik et al. 2019). A large clade containing numerous, independent transitions toward, but not away from, specialization, along with low or negative net diversification rates, would support this hypothesis (Futuyma and Moreno 1988). Confirming the presence of shared trait dimensions between species that occupy similar behavioral or ecological niches is the first step in understanding integrated morphological adaptations and their impacts on diversification.
In mobile animals, trait combinations can inform how a species moves through its surroundings to access resources (Hildebrand et al. 1985). If organismal body plans reflect locomotory habits, then morphological shifts should occur in tandem with locomotor mode transitions. Evidence of rapid changes in morphological dimensions temporally associated with an ecological or locomotory shift supports the hypothesis of an adaptive process (Ricklefs and Miles 1994), while shared directional shifts in two or more traits suggest trait integration and a form-function association (Pigot et al. 2020).
One oft-studied case of locomotor adaptation is climbing in vertebrates. Arboreality introduces unique ecological challenges, such as navigating narrow, hazardous substrates, and is thought to promote behavioral and morphological adaptations (Cartmill 1974, 1985; Lillywhite and Henderson 1993; Nations et al. 2019). Numerous tetrapod clades have transitioned to an arboreal lifestyle (Cartmill 1985) and arboreality is often associated with convergent phenotypic evolution, including changes in digit, foot, and tail lengths in squamates and mammals (Hayssen 2008; Losos 2009; Harrison et al. 2015; Alencar et al. 2017; Nations et al. 2019; Mincer and Russo 2020). However, exceptions exist. For example, a large clade of salamanders shows no apparent morphological differences between arboreal and terrestrial taxa (Baken and Adams 2019), and the correlation between tail length and climbing in marsupials is weaker than in other vertebrates (Weisbecker et al. 2019). Therefore, one-to-one links between morphological traits like foot and tail lengths and locomotion are not universal, and detailed investigations of potentially integrated traits may capture patterns not seen in model clades or in single elements (Fabre et al. 2017).
Here, we use the Old-World rats and mice (Rodentia: Muridae: Murinae), a relatively young (∼15 million years; Aghova et al. 2018) and species-rich clade (nearly 700 species; Burgin et al. 2018) to explore trait evolution and integration in the context of locomotion, and to determine how locomotion affects both phenotypic and lineage diversification. Although murines are best known for two laboratory animals and human commensal species (Mus musculus and Rattus norvegicus), its members represent a rich array of diets, morphologies, locomotory modes, and preferred habitats (Rowe et al. 2016; Martinez et al. 2018).
We leverage recent advances in taxonomic sampling along with four common, standard morphological measurements to test whether external morphological traits of murines covary, whether single or multiple traits are correlated with locomotion, and whether locomotor mode shifts affect the evolutionary success of lineages. More specialized locomotor modes, such as Arboreal and Amphibious, are thought to require distinct combinations of morphological traits. Longer tails may aid in climbing by enhancing counterbalance and tactility, while shortened, often wider hind feet aid in gripping narrow branches (Hickman 1979; Cartmill 1985). Long, thin bodies may improve the ability to bridge gaps in the canopy (Cartmill 1985; Gebo 2004; Youlatos et al. 2015). Long, often laterally compressed tails and long hind feet are used for propulsion in amphibious small mammals (Hickman 1979; Samuels and van Valkenburgh 2008), and a larger body improves thermal inertia in aquatic environments (Dunstone 1998). These hypothesized locomotor adaptations and their effects on lineage diversification remain comprehensively untested in Murinae, despite this clade's value as a potential model of adaptive radiation (Rowe et al. 2019). We predicted that species in specialized categories (Arboreal and Amphibious) will display narrower optimal trait values and lower rates of morphological evolution than the more general categories (General and Terrestrial), reflecting stabilizing selection associated with performance in each habitat (Alencar et al. 2017; Ord et al. 2020).
Methods
PHYLOGENETIC HYPOTHESIS OF MURINAE
To construct a phylogenetic hypothesis of Murinae, we downloaded sequence data of four nuclear loci (BRCA, IRBP, GHR, and RAG1) and one mitochondrial gene (CytB) from GenBank for all available Murinae (Appendix S1). To represent each species, we obtained sequences from the same individual when available. We included Gerbillus gerbillus as an outgroup. Sequences were concatenated by species and aligned using Muscle software in Geneious version 7.1. All sequences were visually inspected for alignment errors in Geneious. Our concatenated alignment included 434 murine species and one outgroup, with mitochondrial CytB for 93% of species (405 of 435), and at least 1 nuclear gene for 86% of species (376 of 435). We used ModelFinder (Kalyaanamoorthy et al. 2017) to search for best-fit gene and codon partitions and DNA substitution models, and IQtree version 1.6.9 (Nguyen et al. 2015) to estimate a maximum likelihood phylogeny. Preliminary ModelFinder results suggested we partition by both gene and codon position, but this led to poor parameter estimates in downstream phylogenetic estimates (see below), likely due to overparameterization of a sparse alignment. Therefore, we repeated the above process with a maximum of five partitions, or one for each gene. To estimate a time-calibrated phylogeny of Murinae, we used BEAST2 version 2.5.1 (Bouckaert et al. 2014), with the relaxed log-normal clock. We unlinked sequence evolution, linked clocks and trees, and set models based on ModelFinder results. We time-calibrated our phylogeny with seven vetted fossil calibrations and their recommended log-normal priors (Aghova et al. 2018). To decrease sampling time, we first smoothed the tree from our IQtree analysis with the chronos function in the R package ape version 5.3 (Paradis et al. 2004), setting the root to 15 million years ago (Aghova et al. 2018). We used this ultrametric phylogeny as a starting tree, allowing the MCMC sampling to search for topological and branch-length improvements. Four independent runs of 200 million generations each, with samples drawn every 1000 generations, were completed with the CIPRES portal (Miller et al. 2010). We discarded the first 20% of trees and parameter values as burnin and thinned by a factor of 10 using TreeAnnotator. Convergence was evaluated using Tracer (Rambaut et al. 2014) to confirm that effective sample sizes (ESS) exceeded 1000, that the trace of the log-likelihood (and other parameters) had plateaued, and that each chain reached the same plateau. We summarized the results as a maximum clade credibility tree using TreeAnnotator.
LOCOMOTOR MODES AND MORPHOLOGICAL MEASUREMENTS OF MURINE SPECIES
To determine the locomotor mode of murines, we scoured peer-reviewed literature and books for information on locomotor behavior and classified 423 species into one of four groups: “Arboreal,” “General,” “Terrestrial,” and “Amphibious.” (Appendix S2). Here “Arboreal” means that climbing is a requisite part of the species’ life history. “General” defines species that are known to navigate a variety of substrates and, although not dependent on arboreal or aquatic habitats, may opportunistically climb or swim (e.g. Russell et al. 2005). “Terrestrial” defines species that are not known to climb due to habitat use, behavior, or dietary niche, and “Amphibious” indicates a dependency on aquatic habitats for feeding. For example, if we read a report saying, “species A feeds on seeds on the ground but was once observed climbing to feed on fruit” then they would be labeled “General.” Our categories depart from a common “Arboreal-Scansorial-Terrestrial” classification. Arboreal means “inhabiting trees,” and Scansorial means “climbing,” so therefore all Arboreal species are Scansorial, but not all Scansorial species are Arboreal, which can lead to confusion. Our more discrete categories avoid this confusion and better describe both locomotion and microhabitat use.
We assembled four morphological measurements: head-body length (HBL), tail length (TL), hindfoot length (HFL), and mass for 373 of the 423 species with locomotor classification. These measurements are traditionally taken in the field from vouchered specimens, and have served as key traits for species identification and ecological inference, providing an opportunity to collect a large sample size. Data were obtained from both specimen labels and the primary literature (Appendix S2). Sexual size dimorphism is not common in Murinae (Carlton and Martinez 1991; Musser et al. 2008; Carlton et al. 2015), although it has been observed in some species (Balete et al. 2006). However, we used measurements from adult male specimens whenever available or identified as such. There was an average of 2.4 primary literature sources per species (range = 1–6), although each primary source reported averages taken from numerous specimens (Appendix S2). We combined measurements from each source, then took the average. As tail and hindfoot lengths scale with body length, we calculated ratios of these measurements (sensu Mosimann 1970) to mitigate the influence of size in some of our analyses. Relative tail length (RTL) is tail length divided by total length (HBL + TL), and relative hind foot length (RHF) is HFL divided by HBL. Measurement ratios can introduce correlations between the denominator and the relative variables, in this case, a correlation between HBL, TL, and RHF. To ensure that the influence of body size was minimized, and that extraneous correlation was not a concern, we calculated phylogenetic Pearson's ρ values () for HBL and RHF, HBL and RTL, and RHF and RTL. We first calculated the phylogenetic covariance for each measurement pair using the phyl.vcv function in the R library phytools version 0.6-99 (Revell 2012), and then converted the covariance to values with the cov2cor function in the R stats library. As murine body mass ranges from 10 to 2500 g, we log transformed masses. We scaled all measurements and ratios to unit variance with the scale function in R version 3.5 and version 4.0 (R Core Team 2020).
ANCESTRAL STATE ESTIMATION OF LOCOMOTOR MODE AND TRANSITIONS
We estimated the ancestral states of locomotor mode across the phylogeny of Murinae using stochastic character mapping (Bollback 2006) in phytools. We used a trimmed phylogeny of the 423 species with locomotor data in our stochastic character mapping. To incorporate phylogenetic uncertainty, we took a random sample of 100 trees, with the outgroup removed, from the posterior distribution of our BEAST2 analysis. To determine the best transition rate model, we used fitMK in phytools to fit three Markov models with different patterns of discrete trait evolution — “equal rates,” “symmetrical,” and “all rates differ” — and compared their predictive performance using Akaike Information Criterion (AIC) weights. We used the model of discrete trait evolution with the highest predictive performance to estimate a transition matrix in simmap. We estimated the transition rate for each tree using the Q = “empirical” setting. As all Amphibious taxa are phylogenetically nested and a clearly derived state within Murinae (Rowe et al. 2014; Martinez et al. 2020), we treated an Amphibious ancestor as unlikely and set the root state prior to pi = 0.333, 0.333, 0.333, 0.0001 for Arboreal, General, Terrestrial, and Amphibious, respectively. One hundred iterations on each of 100 trees resulted in 10,000 stochastic character maps. We summarized the character maps for each tree (100 summaries) to generate a posterior estimate of the locomotor mode at each node and the mean transition rate between each state.
MORPHOLOGICAL CORRELATES OF LOCOMOTION
To test the hypothesis that discrete locomotor modes have unique morphologies, we fit a series of phylogenetic Bayesian multilevel models with Stan (Carpenter et al. 2017) in the R library brms (Bürkner 2017). Using locomotor mode as the predictor, we fit four models, each with a different trait (HBL, RTL, RHF, and log mass) as the response variable. We used the phylogenetic correlation matrix from a trimmed murine phylogeny of 373 species (those with morphological measurements and locomotor data) as a group-level effect to account for the non-independence of species (de Villemereuil et al. 2012; Bürkner 2017). We ran one model for each of 100 trees from the posterior distribution (as above) to incorporate phylogenetic uncertainty (Nakagawa and De Villemereuil 2018). We fit regularizing normal priors on the population-level effects (0, 1.5) (Gelman 2006; McElreath 2016) and used the Student t-distribution family to describe the response variable, a method often termed “robust regression” (Kruschke 2013; Bürkner 2018). For each trait, each of the 100 models included four chains run for 5000 iterations, with 2500 warm-up and 2500 sampling iterations, which were thinned by a factor of 10, yielding 100,000 posterior samples. For regression with categorical predictors, brms assigns a random category (locomotor mode in this case) as the intercept (“dummy variable”), so we removed the intercept parameter from the model to generate a posterior distribution of phylogenetically corrected mean trait values for each locomotor group. We assessed convergence with ESS and a Gelman-Rubin diagnostic of 1.01. We used the posterior distributions of the mean trait values to determine if different locomotor modes have different morphologies by calculating the differences between each of the posterior distributions, that is, contrasts (Kruschke 2013; McElreath 2016, Roycroft et al. 2020) using the compare_levels function in the R library tidybayes (Kay 2020). If the 95% credible interval of the difference distributions does not overlap zero, then we can say that the traits differ between locomotor modes. This method is analogous to the Bayesian ANOVA or Bayesian robust t-test (Kruschke 2013).
TRAIT COVARIATION AND FUNCTIONAL EVOLUTION
Traits that are more functionally related have a higher size or shape correlation than traits that are less functionally related (Van Valen 1965). To quantify trait covariation, we estimated the size correlation between four morphological traits of 373 murine species using phylogenetic multiresponse models (i.e., models with multiple response variables, Nakagawa and Santos 2012, de Villemereuil and Nakagawa 2014, Bürkner 2017, Brommer et al. 2019). We estimated the correlation between the absolute size of phenotypic measurements (TL, HFL, HBL, and log mass) both within and across locomotor modes. A high correlation between the size of two measurements within a locomotor mode indicates an optimal ratio of traits, and therefore a functional relationship (Van Valen 1965; Randau and Goswami 2018). All measurements, (tail length, HFL, HBL, and log mass) were scaled to unity using the scale function in R. We removed the intercept from the model, included no population-level effects (i.e., response variables or “fixed effects”), and used the phylogenetic correlation matrix as a group-level effect. We used brms to build the model, using four morphological traits as response variables. With multiresponse models, brms produces a posterior distribution of estimated correlations comparable to Pearson's correlation coefficient (Bürkner 2017; Brommer et al. 2019). In addition to our model with all available murine taxa, we ran four identical multiresponse models for each locomotor mode using only the trait data and species in each locomotor regime.
LOCOMOTION AND THE MODE OF TRAIT EVOLUTION
To test for morphological diversification and constraint within locomotor modes, we fit a series of models of trait evolution using the R library OUwie version 1.57 (Beaulieu et al. 2012; Beaulieu and O'Meara 2019) with each locomotor mode representing a unique regime. For Brownian Motion (BM) models, traits evolve according to the rate parameter 2. Ornstein-Uhlenbeck (OU) models contain a nondirectional rate parameter 2, the optimal value of the trait , and the strength of selection . We fit five models in OUwie: BM1) a single 2 estimate for all locomotor regimes; BMS) independent 2 rates for each regime; OU1) OU model with a single , and 2 shared by all locomotor regimes; OUM) OU model with independent values for each locomotor regime, but a single 2 and shared by all states; and OUMV) OU model with different and 2 for each locomotor regime, but a single . In preliminary analyses two OUwie models that assumed a varying , OUMA and OUMVA, returned sub-optimal log-likelihood values and negative values in the eigenvalue decomposition of the Hessian matrix and therefore were not considered further per author recommendations (Beaulieu and O'Meara 2019). Using a trimmed phylogeny of 373 murines with morphological and locomotor data, we generated 100 stochastic character maps from a random set of 100 trees from our posterior distribution using phytools with the same Q matrix and root priors as in Ancestral State Estimation of Locomotor Mode and Transitions above. We used our four phenotypic traits (mean-centered and scaled HB, RTL, RHF, and log mass) as our input traits and locomotor mode as our input regimes. We set up one OUwie model per trait, used custom scripts to loop each OUwie model over our set of 100 stochastic character maps, compared the five OUwie trait evolution models using AICc, and calculated the mean and 95% probability ranges of each parameter. We report the results of the best-fit model. To verify the stability of our OUwie model results, we calculated 10 parametric bootstraps across five randomly selected stochastic character maps, for a total of 50 bootstraps for each trait, using the OUwie.bootstrap function, then estimated the 95% probability intervals of these bootstraps. To confirm that our parameter estimates (, , and 2) differed between locomotor regimes, we compared the differences between the posterior distributions of the mean estimates of each parameter across locomotor modes using the “Bayesian ANOVA” linear modeling approach for categorical predictor variables described above. Briefly, we ran Bayesian linear models in brms (Bürkner 2017) using the parameter estimate as the responses and the categorical locomotor mode as the predictors, and compared the posterior distributions of the mean estimates using compare_levels in tidybayes (Kay 2020).
Interpretation of the OU model parameters is aided by calculating two additional variables: phylogenetic half-life (ln(2) /), or the time it takes a trait to evolve halfway to the optimal , and stationary variance (2 / 2), or the expected variance of the trait when the evolutionary process is at equilibrium (Hansen 1997; Gearty et al. 2018). We calculated these two variables for each OU model selected by AICc.
LOCOMOTION'S INFLUENCE ON DIVERSIFICATION
We used character-state-dependent diversification models to test whether transitions to specialist states (i.e. Arboreal and Amphibious) limit evolvability. Character-state dependent diversification models, also known as SSE models, describe the joint evolution of a character and the phylogeny (Maddison et al. 2007; FitzJohn et al. 2009; Freyman and Höhna 2018; Freyman and Höhna 2019). However, they may be subject to false-positive results (Maddison and FitzJohn 2015; Rabosky and Goldberg 2015). One possibility is that the diversification parameters are caused by an unmodeled character, which we addressed by using hidden state models (Beaulieu and O'Meara 2016; Caetano et al. 2018). We used a hidden Markov model with two hidden states (Beaulieu and O'Meara 2016; Caetano et al. 2018), resulting in eight states: Arboreal, General, Terrestrial, and Amphibious associated with hidden state A, and the same four locomotor modes with hidden state B. We used the dnCDBDP command in RevBayes version 1.0.9 (Höhna et al. 2014; Höhna et al. 2016), which uses a full Bayesian approach to estimate speciation and extinction rates of each character, transition rates between locomotor modes, and transition rates between the two hidden states. We incorporated a random sample of 100 trimmed trees from our BEAST2 posterior distribution of trees to incorporate phylogenetic uncertainty. As we lack locomotor data for 11 taxa, we used only 423 of the 434 murine species in our phylogenetic reconstruction. Each model on each tree was run for 4500 generations, with the first 500 discarded as burn-in. We combined the results of all trees, providing posterior distributions of 400,000 estimates per parameter, then thinned these by a factor of 100 for ease in subsequent analyses and plotting.
Results
PHYLOGENETIC RELATIONSHIPS AND CHARACTER STATES
The phylogenetic estimate from IQtree incorporated an independent substitution model for each of our five potential partitions (Table S1). All parameters in the BEAST2 runs properly converged (ESS > 1000 in combined log). Our maximum clade credibility (MCC) estimate was generally well supported (Figure 1, higher resolution in Figure S1), and, despite increasing the taxon sampling over previous studies (e.g., from 268 species in the largest previous murine phylogeny, Rowe et al. (2019), to 423 in this study), topological and temporal estimates are congruent with recent phylogenetic hypotheses (Aghova et al. 2018; Rowe et al. 2019). We used the tribe and division names proposed in Rowe et al. (2019) with some exceptions. We did not recover a monophyletic Oenomys division (Oenomys, Thamnomys, Grammomys, Thallomys) (sensu Musser and Carleton 2005) and henceforth we refer to the Grammomys division as containing the genera Grammomys, Thamnomys, and Thallomys, and the Golunda division as containing Golunda and Oenomys (Fig. 1). The Colomys division (Colomys, Zelotomys) is nested within the Stenocephalemys division, a pattern also recovered in both in Aghova et al. (2018) and Rowe et al. (2019).
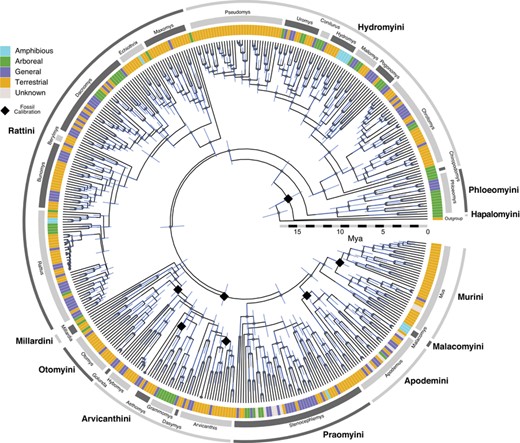
Time-calibrated maximum clade credibility tree of Murinae. Colored bars at the tips represent locomotor mode (see legend), while tribes (outer ring) and divisions (inner ring) are marked around the tree in alternating dark and light grey. Black diamonds signify fossil calibrations, grey dots indicate nodes with 95% credible support, and blue bars are 95% credible intervals of node ages. Not all taxa in the tree belong to divisions or tribes used in this manuscript. A higher resolution image with tip labels is available as Fig. S1.
We recorded a locomotor mode for 647 of the 700 murine species (15% Arboreal, 20% General, 63% Terrestrial, 2% Amphibious). Of these, 423 species were used in the Ancestral State estimates (15% Arb., 22% Gen., 61% Ter., 2% Amph.) and 373 in morphological analyses (15% Arb., 23% Gen., 60% Ter., 3% Amph.) (Appendix S2). The proportion of species amongst locomotor modes remained fairly constant within each reduced dataset. Thus, our taxon sampling is representative of locomotor mode distribution across Murinae.
ANCESTRAL CHARACTER STATES AND STATE TRANSITIONS
The “all rates differ” transition model received >99% of the AIC weight, therefore we ran stochastic character maps using the “ARD” model. We extracted the ancestral states of the murine tribes and divisions from Rowe et al. (2019) with the changes mentioned above. Several divisions from Rowe et al. 2019 (Hapalomys, Haeromys, Micromys, and Srilankamys) were represented by a single taxon in our phylogenetic estimate and therefore had no ancestral state estimate. We found that the root state of Murinae is either Arboreal (proportion of ancestral state estimates = 0.54) or General (0.44)(Fig. 2), though this ambiguity may be due to our minimal outgroup sampling. Perhaps not surprisingly, the old and relatively depauperate tribe Phloeomyini has a high probability (0.93) of an Arboreal most recent common ancestor (MRCA; Fig. 2). Hydromyini and Rattini both have high probabilities of a General MRCA (0.82 and 0.85 respectively), while Otomyini and Murini likely had a Terrestrial MRCA (0.84 and 0.93 respectively) (Fig. 2). The small clade of Malacomyini, comprised of only three Amphibious species, is estimated to have had an Amphibious MRCA (0.96). Divisions were split between Terrestrial, General, and ambiguous ancestral states, with two divisions having an estimated Arboreal ancestor and one division with an Amphibious ancestor.
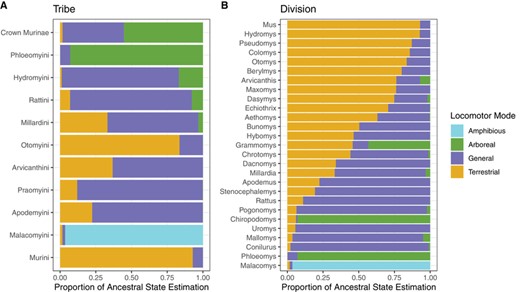
A) Estimated ancestral states of murine tribes. Crown Murinae is followed by tribes in descending order by crown age, and B) estimated ancestral states of murine divisions, sorted for easy visualization.
Summarizing the 10,000 stochastic character maps produced a mean of 175, median of 174, locomotor mode transitions per tree. Locomotor mode shifts only occurred in a “linear” pattern between Arboreal and General, General and Terrestrial, and Terrestrial and Amphibious, despite no constraints in the model requiring transitions to occur this way. The General-to-Arboreal transition rate is over four times that of the reverse. Transitions from General to Terrestrial were nearly twice that of the reverse (Table 1). Transition rates between General and Arboreal were lower than between General and Terrestrial. Transitions to the Amphibious state were rare, and Amphibious species have never left this specialized mode, according to our inferences.
Mean transition rates between locomotor modes from stochastic character maps. Matrix is read from row to column, so that first value in row Arboreal is the rate from Arboreal (row) to General (column)
| State | Arboreal | General | Terrestrial | Amphibious |
|---|---|---|---|---|
| Arboreal | – | 0.003 | 0.000 | 0.000 |
| General | 0.013 | – | 0.030 | 0.000 |
| Terrestrial | 0.000 | 0.017 | – | 0.002 |
| Amphibious | 0.000 | 0.000 | 0.000 | – |
| State | Arboreal | General | Terrestrial | Amphibious |
|---|---|---|---|---|
| Arboreal | – | 0.003 | 0.000 | 0.000 |
| General | 0.013 | – | 0.030 | 0.000 |
| Terrestrial | 0.000 | 0.017 | – | 0.002 |
| Amphibious | 0.000 | 0.000 | 0.000 | – |
MORPHOLOGICAL PATTERNS OF LOCOMOTION
Our phylogenetic Pearson's values of trait ratios and body size were low — (HBL, RHF) = −0.02, (HBL, RTL) = −0.01, and (RTL, RHF) = 0.07 — demonstrating that our appendage-length ratios did not introduce unwanted correlation into subsequent analyses. Bayesian linear models of mean trait values for each locomotor mode converged for all four models (ESS > 10,000 for merged models, = 1). Amphibious murines have the highest mean HBL and General species are longer than Terrestrial or Arboreal species, whereas the latter two have very similar mean HBLs (Table 2, Figure 3). However, at the 95% credible level, the difference in HBL between any of the locomotor modes overlaps zero (Fig. 4A). Body mass was similar for all locomotor modes (Table 2). Amphibious species have a higher than average mass, and Arboreal species a slightly lower than average mass, however, none of the pairwise comparisons differ from zero at the 95% credible level (Fig. 4B). For RTL we observed greater differences among locomotor modes (Table 2). Arboreal species have longer tails than both Terrestrial and General species at the 95% credible level, and longer tails than Amphibious species at a 90% credible level (Figure 3, Figure 4C). The Amphibious RTL estimate has a large credible interval and differences between them and General or Terrestrial species are less decisive (Fig. 4C). Amphibious species have the longest RHF, Arboreal and General species have the shortest RHF, and Terrestrial species are centered around zero, or the mean of all murines (Table 2, Figure 3). Contrast plots highlight these differences, revealing that General and Arboreal RHFs are smaller at the 95% credible level than Terrestrial or Amphibious RHFs, and Terrestrial are smaller than Amphibious at the 90% credible level (Fig. 4D).
Mean estimates and 95% credible intervals for each locomotor mode and measurement from phylogenetic multilevel models. The column provides the estimated error and 95% credible interval for each model
| Measurement | Arboreal | General | Terrestrial | Amphibious | Sigma |
|---|---|---|---|---|---|
| Log(Mass) | −0.17 (−0.91, 0.57) | 0.05 (−0.69, 0.79) | 0.02 (−0.72, 0.75) | 0.38 (−0.48, 1.25) | 0.15 (0.08, 0.22) |
| Head Body | −0.25 (−0.82, 0.32) | −0.14 (−0.71, 0.42) | −0.26 (−0.82, 0.30) | 0.10 (−0.59, 0.80) | 0.11 (0.06, 0.16) |
| Hind Foot | −0.34 (−1.06, 0.39) | −0.29 (−1.01, 0.44) | −0.05 (−0.77, 0.67) | 0.66 (−0.34, 1.65) | 0.32 (0.21, 0.43) |
| Tail | 0.49 (−0.24, 1.22) | 0.00 (−0.73, 0.73) | −0.32 (−1.04, 0.41) | −0.04 (−0.91, 0.83) | 0.32 (0.23, 0.40) |
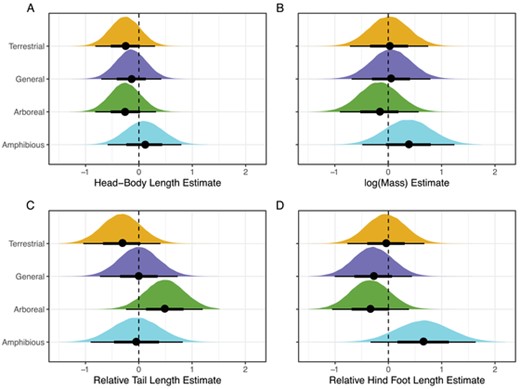
Density plots of phylogenetic mean trait values for the four locomotor modes. Black circles represent the median values and horizontal black bars are the 65% (thick) and 95% credible intervals (thin). All measurements are mean centered and scaled to 1 standard deviation.

Density plots of differences (contrasts) between phylogenetic mean trait values for the four locomotor modes (see Fig. 3). Points are medians, wide bars the 65% credible intervals, and narrow bars are 95% credible intervals. If the distributions of the differences do not overlap zero (vertical dashed line) at the 95% credible level, then we can say there is a reliable difference between the two values. (A) HBL differences, (B) log(Mass) differences, (C) RTL differences, and (D) RHF differences.
TRAIT COVARIANCE AND FUNCTIONAL EVOLUTION
All models of trait covariation converged (ESS > 800, = 1 for all parameters). We found high correlation among traits for all of Murinae (Table 3) with a mean correlation of 0.87. However, the strength of covariance among traits varied with locomotor modes. Due to small sample size, Amphibious taxa correlation estimates had wide credible intervals that prevented interpretation of possible trait correlation. Apart from Amphibious taxa, traits were least correlated in Terrestrial taxa and most correlated in Arboreal and General taxa (Table 3). As expected, HBL and mass were highly correlated in all locomotor modes. Arboreal and General taxa had a greater correlation between tail length and body length than did Terrestrial taxa (Table 3). The correlation between HBL and HFL shows a similar pattern of high covariance in Arboreal and General taxa, but lower correlation in Terrestrial taxa.
Phylogenetic covariance correlation coefficients (mean and 95% credible intervals) for traits by locomotor mode (columns 1–4) and for all murines (column 5)
| Correlations | Arboreal | General | Terrestrial | Amphibious | All |
|---|---|---|---|---|---|
| Head Body & Tail | 0.93 (0.86, 0.97) | 0.93 (0.85, 0.98) | 0.74 (0.63, 0.84) | 0.62 (−0.09, 0.95) | 0.92 (0.88, 0.95) |
| Head Body & Hind Foot | 0.95 (0.92, 0.98) | 0.96 (0.93, 0.98) | 0.89 (0.85, 0.93) | 0.62 (−0.13, 0.96) | 0.96 (0.95, 0.98) |
| Tail & Hind Foot | 0.93 (0.85, 0.97) | 0.92 (0.83, 0.97) | 0.88 (0.80, 0.95) | 0.69 (−0.21, 0.97) | 0.96 (0.93, 0.98) |
| Head Body & Mass | 0.94 (0.90, 0.97) | 0.97 (0.94, 0.99) | 0.93 (0.91, 0.95) | 0.55 (−0.26, 0.92) | 0.95 (0.93, 0.97) |
| Tail & Mass | 0.90 (0.79, 0.95) | 0.90 (0.79, 0.96) | 0.71 (0.60, 0.81) | 0.34 (−0.46, 0.84) | 0.87 (0.82, 0.92) |
| Hind Foot & Mass | 0.86 (0.77, 0.93) | 0.95 (0.90, 0.98) | 0.88 (0.83, 0.92) | 0.39 (−0.40, 0.87) | 0.94 (0.91, 0.96) |
RATES OF TRAIT EVOLUTION ASSOCIATED WITH LOCOMOTOR MODES
The OUMV model, with locomotor-mode specific evolutionary rates 2 and optima , but a universal strength of pull parameter , had by far the best AICc scores across all four traits (scaled RTL, scaled RHF, scaled HBL, and log(Mass), Table 4). Therefore, we only present the results of this model (Fig. 5). Our OUwie model and parametric bootstrap values are largely congruent and all alpha values are reliably above zero (Table S2).
Corrected Akaike Information Criteria (AICc) scores for each of the five models of trait evolution from OUwie analyses. The OUMV model has the lowest AICc value for all four traits (in bold)
| Trait | BM1 AICc | BMS AICc | OU1 AICc | OUM AICc | OUMV AICc |
|---|---|---|---|---|---|
| Head Body Length | 31.80 | 16.40 | 25.44 | 15.57 | 0.01 |
| Log(Mass) | 25.99 | 9.51 | −2.23 | −2.65 | −8.69 |
| Relative Tail Length | 78.93 | 11.10 | 34.20 | −8.38 | −31.45 |
| Relative Hind Foot Length | 54.95 | 24.46 | −41.44 | −44.25 | −52.65 |
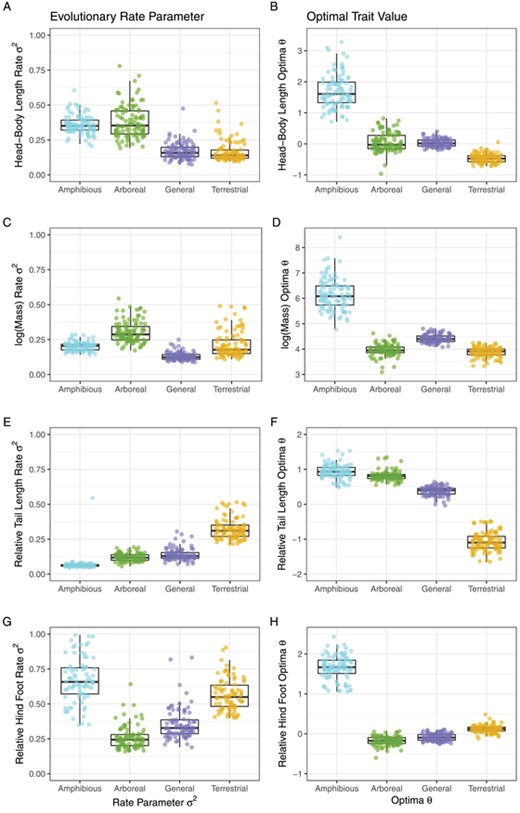
Results from 100 independent OUwie OUMV analyses. Colored dots represent the outcomes of each analysis, and box plots provide the median (dark line in the box), 25th and 75th percentiles (top and bottom of boxes), and the largest or smallest values no further than 1.5. *Inter-quartile range from the center (whiskers). Head-Body Length, Relative Tail Length, and Relative Hind Foot Length are scaled to a mean of zero and an SD of 1.
Head Body Length- Our HBL OUMV model estimated a universal mean = 0.09 (95% probability = 0.05, 0.19) and universal phylogenetic half-life mean of 7.44 million years (3.64 million years, 14.25 million years) that represents roughly half of the age of Murinae, suggesting a weak pull towards the HBL optimum. Arboreal species have an HBL stochastic evolution rate of 0.35 (0.21, 0.64)), an HBL mean of −0.03 (−0.31, 0.68), and the highest stationary variance at 1.93 (1.37, 3.16). General species have a 2 mean of 0.16 (0.09, 0.29), a mean of 0.01 (−0.17, 0.30), and a stationary variance mean of 0.86 (0.53, 1.23). Terrestrial species have the lowest rate of HBL stochastic evolution at 0.14 (0.10, 0.37), an HBL mean of −0.47 (−0.71, −0.20), and the lowest stationary variance at 0.81 (0.59, 1.21). Amphibious species have an optimal HBL mean of 1.62 (0.86, 3.06), a stochastic evolution rate mean of 0.35 (0.24, 0.50), and a stationary variance mean of 1.92 (1.02, 3.59). All of the pairwise differences in HBL and 2 values were robust except for a non-credible difference between Amphibious and Arboreal HBL2 and General and Arboreal HBL (Figure S2).
log(Mass) – Mass has the lowest at 0.08 (0.05, 0.16), and the highest phylogenetic half-life at 9.17 my (4.45 my, 15.38 my) of any trait, suggesting a weak pull towards the optimal mass of each locomotor mode. Arboreal species have a mass mean of 3.95 (3.29, 4.37), the highest stochastic evolution rate at 0.29 (0.20, 0.47), and the highest stationary variance at 1.86 (1.37, 2.6). General species have a mass mean of 4.39 (4.16, 4.75), the lowest 2 at 0.12 (0.09, 0.21), and the lowest stationary variance at 0.82 (0.49, 1.17). Terrestrial species have a mean of 3.91 (3.45, 4.23), a 2 mean of 0.18 (0.12, 0.28), and a stationary variance mean of 1.24 (1.00, 1.58). Amphibious species have the highest optimal mass at 6.08 (5.19, 7.49), a 2 mean of 0.21 (0.15, 0.28), and a stationary variance mean of 1.26 (0.07, 2.46). All pairwise differences in log (Mass) values were robust. All 2 differences were robust except for non-credible 2 difference between Terrestrial and Amphibious species (Fig. S2).
Relative Tail Length – RTL has an mean of 0.13 (0.09, 0.20) and a phylogenetic half-life mean of 5.41 my (3.46, 8.13). Arboreal species have the second highest tail optimum at 0.81 (0.59, 1.29), a2 mean of 0.12 (0.08, 0.18), and a stationary variance mean of 0.45 (0.32, 0.59), less than ¼ the of the HBL or log(Mass) variances. General species have a RTL mean of 0.39 (0.07, 0.58), a 2 mean of 0.13 (0.09, 0.21), and a stationary variance mean of 0.51 (0.37, 0.86). Terrestrial species have the lowest RTL optimum at −1.12 (−1.63, −0.72), the highest RTL 2 at 0.31 (0.05, 0.51), and the highest RTL stationary variance at 1.23 (0.97, 1.51). Amphibious species have the highest RTL at 0.94 (0.70, 1.43), the lowest RTL 2 at 0.06 (0.05, 0.08), and the lowest RTL stationary variance at 0.23 (0.18, 0.36). All of the pairwise differences in RTL and 2 values were far from zero (Fig. S2).
Relative Hind Foot Length - RHF models have the highest at 0.22 (0.15, 0.34) and the shortest phylogenetic half-life at 3.22 million years (2.04 million years, 4.50 million years) of any of the four traits, demonstrating a stronger pull toward the optimal foot size for each locomotor mode. Arboreal species have the lowest hind-foot length optimum of any locomotor mode at −0.16 (−0.42, 0.04), the lowest 2 at 0.24 (0.17, 0.48), and the lowest stationary variance at 0.57 (0.45, 0.71). General species have a mean RHF of −0.08 (−0.23, 0.10), a mean 2 of 0.33 (0.21, 0.63), and a mean stationary variance of 0.76 (0.58, 1.01). Terrestrial species have an RHF optimum mean of 0.12 (−0.06, 0.30), an RHF 2 mean of 0.55 (0.41, 0.88), and a stationary variance mean of 1.29 (1.14, 1.41). Amphibious species have the highest RHF at 1.71 (1.40, 2.23), the highest RHF 2 at 0.66 (0.36, 0.99), and a mean RHF stationary variance at 1.59 (0.94, 2.04). All of the pairwise differences in RHF and 2 values were robust (Fig. S2).
LOCOMOTION AND DIVERSIFICATION
All parameter estimates in our hidden character-state-dependent diversification analysis appeared to converge. After thinning by a factor of 100, character-dependent birth-death models still demonstrate acceptable levels of convergence (ESS > 300 for 4000 samples), demonstrating consistent parameter estimates regardless of tree topology. Due to the long tails in the posterior distributions of diversification analysis parameter estimates (Fig. S3), we present the more stable 90% credible intervals (Kruschke 2014). The mean transition rate of hidden state A to state B is 0.014 (90% CI = 0.0001 to 0.028) while the mean of the reverse is 0.531 (90% CI = 0.344 to 0.718) (Fig. S4). We estimated the transition waiting time, or the inverse of the transition rate describing time between transitions. The highest posterior density (HPD) of transition waiting time from state A to state B is 52.15 million years (90% CI = 12.16 to 307.12) (Fig. S4). As Crown Murinae is estimated to be < 20 my, this long waiting time clearly demonstrated the low probability of a state A to state B transition. The HPD transition waiting time from state B to state A is 1.78 million years (90% CI = 1.24 to 2.59; Fig. S4).
The estimated speciation rates of the eight character-state combinations (four locomotor categories by two hidden states) show the mean speciation rates in the rarely visited hidden state B are more than twice those of hidden state A (Fig. S3). In state A, Terrestrial species have the highest speciation rate (mean of 0.233, (0.147 to 0.311)) followed by General (mean = 0.186, (0.050 to 0.308)) and Arboreal (mean = 0.156, (0.038 to 0.250)). The Amphibious state A speciation rate mean is similar to the Arboreal and General states, but it has a large credible interval (mean = 0.175, (0.000 to 0.435); Fig. S3). In hidden state B, Terrestrial (mean = 0.989, (0.522 to 1.461)) and General (mean = 0.889, (0.615 to 1.128)) have the highest speciation rates, while Arboreal species have the lowest (mean = 0.516, (0.133 to 0.845)). Amphibious species in state B have an intermediate rate estimate with large variance (mean = 0.806, (0.176 to 1.398)).
The estimated extinction rates of all locomotor modes in both hidden states are centered near zero (Fig. S3). The net diversification rates show slow diversification for hidden state A (Arboreal = 0.073, (−0.061 to 0.241), General = 0.074, (−0.128 to 0.280), Terrestrial = 0.200, (0.010 to 0.296), Amphibious = −0.008, (−0.486 to 0.390)). All state A diversification estimates have positive means, but only Terrestrial species show a credibly nonzero rate at the 90% level (Fig. S3). All four locomotor modes show a generally positive diversification rate in state B with much higher mean values and credible intervals than in state A (Arboreal = 0.252, (−0.061 to 0.667), General = 0.744, (0.548 to 0.950), Terrestrial = 0.621, (0.408 to 0.870), Amphibious = 0.464, (−0.243 to 1.091)). Despite the high mean values, only Terrestrial and General species show a nonzero diversification rate at the 90% credible level (Fig. S3).
Discussion
DO SINGLE OR MULTIPLE TRAITS COVARY WITH LOCOMOTION?
Among murine rodents, an ecologically diverse and species-rich group of mammals, we found that species in each locomotor category have different combinations of trait values. Some traits, such as tail and foot lengths, are highly correlated and have low evolutionary rates in some locomotor regimes. This suggests that these traits evolve in an integrated manner and that certain ecologies and habitats can lead to morphological specialization and reduced phenotypic evolution (Collar et al. 2009; Alencar et al. 2017). Arboreal species, for example, have long tails and short hind feet (Figs. 4 and 5); these traits are tightly correlated (Table 3) with low rates of evolution (Fig. 5) and low stationary variance (Table S2). Although tail length alone may be an inadequate predictor of locomotion in murines (Nations et al. 2019), long tails and short, broad hindfeet fit morphological expectations for arboreal species (Hickman 1979; Cartmill 1985; Karantanis 2017). In addition, Arboreal taxa have more gracile body forms than General and Terrestrial species — optimal or mean HBL is similar for the three regimes, but Arboreal species have a lower optimal mass (Fig. 5) — supporting the role of lighter, slimmer bodies in arboreal vertebrates (Dublin 1903; Lillywhite and Henderson 1993; Alencar et al. 2017).
Arboreal species have the highest rate of HBL evolution, the broadest optimal HBL range, and the largest HBL stationary variance of any locomotor mode, suggesting no directional tendencies in the body length evolution (HBL rate; Fig. 5; Fig. S2 and Table S2). Nevertheless, the Arboreal regime contains the largest (Phloeomys pallidus, 2100 g) and one of the smallest (Haeromys minahassae, 10 g) taxa in our data set. Body size is a labile trait that can evolve rapidly (Slater and Friscia 2019), and in murines, body size (HBL and mass) evolves around twice as fast in Arboreal species compared to General species (Fig. 4; Table S2). Transitions to Arboreal only occurred from General species (Table 1), and General species have a narrow optimum body size with low stationary variance (Fig. 5; Table S2). Therefore, while some traits in Arboreal species such as RHF and RTL are highly correlated, selection may be relaxed on other traits such as body size.
General species have intermediate tail lengths, short hind feet, and, as in Arboreal species, these two traits are tightly correlated (Table 3). Models of trait evolution show that General species have very narrow optimal trait values and low rates of phenotypic evolution for all four measurements (Fig. 5), though the relatively low values for HBL and mass may influence these interpretations. These results, along with the high trait correlation values (Table 3), demonstrate that the General body plan is highly conserved. As all General species are known to climb at least occasionally, these results provide additional support for the role of long tails and short, broad hind feet in navigating narrow or vertical surfaces (Hickman 1979; Cartmill 1985). In other words, a modest tendency to climb may require some similar adaptations as frequent climbing. The similarities between arboreal and “scansorial” species has been noted in other vertebrate clades, including carnivores (Samuels et al. 2013), frogs (Blackburn et al. 2013), and snakes (Lillywhite et al. 2012).
Terrestrial species have short tails, long hind feet, and larger, more rotund bodies (large mass relative to HBL). Tail length is comparatively decoupled from body size (both mass and HBL) in Terrestrial species, suggesting that terrestriality does not constrain tail length evolution (Table 3, Figure 5). For instance, Terrestrial groups such as the Maxomys division have tail lengths that are similar to HBL, while many Otomys and Mus division species have tails less than half of HBL.
Though the paucity of Amphibious species resulted in wide parameter variance, these species have the largest values in every morphological measurement except tail length (Fig. 4). In general, Amphibious rodents are larger than their Terrestrial relatives (Dunstone 1998; Pihlström 2008). Increased body size of amphibious species is seen across all rodents and in other vertebrate groups such as squamates and has been attributed to the need for improved heat conservation in water (Dunstone 1998; Meiri 2008; Pihlström 2008; Martinez et al. 2020). Most amphibious mammals, and amphibious vertebrates in general, swim using hind-foot and tail propulsion (Hickman 1979; Samuels and van Valkenburgh 2008), which is thought to select for elongate hind feet and powerful, long tails that are often laterally compressed or augmented with stiff vertically oriented hairs (Voss 1988; Rowe et al. 2014). Our observations of increased HBL, mass, RHF, and RTL support these existing hypotheses of convergent evolution in Amphibious species (Kerbis Peterhans and Patterson 1995; Meiri 2008; Rowe et al. 2014; Martinez et al. 2020).
Although our chosen measurements provide only a rough sketch of body form, they still show strong evidence of trait covariance associated with locomotor mode. More detailed investigations into small mammal morphology, such as limb proportions, finite element analysis of muscle force, or biomechanical modeling of skeletal-element interactions, may reveal nuanced adaptations that are left unobserved with simple linear measurements. Nonetheless, our large sample size reveals clear differences in and covariances between body size, foot length, and tail length, in four distinct small mammal locomotor modes.
LOCOMOTION AND EVOLUTIONARY SUCCESS
Character-dependent diversification analyses show heterogeneity in diversification rates among locomotor modes and an association with unmodeled character states (Fig. 6; Fig. S3). Although interpreting hidden Markov models is challenging (Caetano et al. 2018), we see that the hidden states with high diversification rates (state B) are uncommon and short-lived, a pattern demonstrated by the rare transition to and frequent transition from state B (Fig. S4). We interpret this to mean that some unmodeled character state, or trait, occasionally appears throughout murine history. Although there is no way to know the nature of the unmodeled state, possibilities include increased access to novel areas via colonization, favorable environmental conditions, or dietary adaptations. Second, we do see that in state A, Terrestrial species have the highest and only credibly non-zero net-diversification rate (Fig. S3), while in state B General and Terrestrial species have similarly high diversification rates (Fig. 6; Fig. S3). This parallels our stochastic character mapping results, where many diverse clades in the murine phylogeny have either General or Terrestrial ancestors, rather than Arboreal or Amphibious ancestors. Lastly, Arboreal diversification rates are much lower than Terrestrial in state A and reliably lower than General and Terrestrial species at the 90% level in state B (Fig. 6).
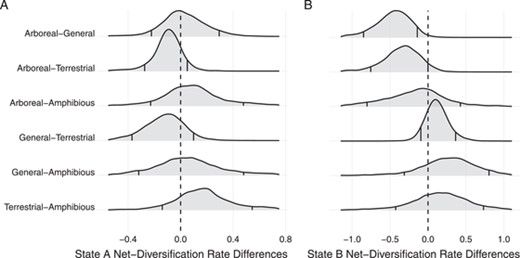
Density plots of the differences between net-diversification rate estimates for each locomotor mode. (A) Although median values for Terrestrial are higher and median values for Arboreal are lower than other modes, the 90% Credible intervals all overlap zero, indicating undecided differences between all net-diversification rates. (B) In state B, the Arboreal mode shows strong evidence of a slower diversification rate than General and Terrestrial.
Credible intervals on Amphibious diversification rate estimates are wide but, like Arboreal species, are lower than Terrestrial state A and lower than General and Terrestrial in state B (Fig. 6). In fact, amphibiosity appears to be an evolutionary dead-end in murines, as the diversification rates in both hidden states are low (Fig. S3), and discrete character mapping reported no transitions away from this specialized state (Table 1). The finding of low diversification rates in the more specialized Arboreal and Amphibious modes differs from previous studies. For example, in the larger rodent clade Muroidea (in which Murinae is nested) and the squamate clade Viperidae, locomotor specialization was not found to affect diversification (Alencar et al. 2017; Alhajeri and Steppan 2018). In other animals such as cichlids, butterflies, and neotropical furnariid birds (Claramunt et al. 2012; Ebel et al. 2015; Burress 2016) specialization appears to facilitate cladogenesis. Our findings add to the growing consensus that specialization leads to a variety of outcomes, including rapid speciation, increased extinction risk, and, in the case of murines, static persistence (Futuyuma and Moreno 1988; Smits 2015).
THE EVOLUTION OF ARBOREALITY IN MURINAE
Arboreality is a widespread locomotor strategy among vertebrates that has garnered broad general attention because of its relevance to human origins and general concepts such as Dollo's law and ecological innovation (Haines 1958; Cartmill 1974; Zani 2000; DeSilva 2009; Moen et al. 2013; Urbani and Youlatos 2013; Venkataraman et al. 2013; Alencar et al. 2017; Scheffers and Williams 2018; Baken and Adams 2019). Within Murinae, Arboreal taxa are often on long phylogenetic branches with few species (Fig. 1), a pattern that differs from other arboreal vertebrates (Samuels et al. 2013; Alencar et al. 2017; Moen and Wiens 2017; Ord et al. 2020). This is most apparent in the genus Hapalomys, which contains three species of Arboreal mice (one in our phylogeny) and is sister to nearly 700 species. Other examples of this pattern include the tribe Phloeomyini and genera Chiropodomys, Haeromys, Micromys, and Vandeleuria (Fig. 1). The paraphyly of arboreality and the long branches of depauperate Arboreal clades has led to speculation that many Arboreal lineages are relicts of previously diverse clades (Musser and Newcomb 1983; Emmons 1993; Pagès et al. 2015). Our results provide some support to this hypothesis. Stochastic character maps highlight more transitions to (mean = 34/tree) than away from (mean = 9/tree) arboreality. Our character-dependent-diversification analyses demonstrate a low diversification rate for Arboreal species, suggesting that this specialized locomotor mode has evolutionary cul-de-sac tendencies, but has remained a viable specialization over long periods of time. Ancestral state estimation shows that none of the young or rapidly diversifying divisions, such as Rattus, Mus, Bunomys, Chrotomys, or Pseudomys have a >0.01 probability of an Arboreal ancestor (Fig. 2). The few young Arboreal clades, such as Chiromyscus and Margaretamys, are deeply nested within larger groups containing few if any Arboreal taxa. This suggests that young, rapidly diversifying clades evolve from General or Terrestrial ancestors, with Arboreal species appearing after the clade's establishment. If this same pattern existed in the past, then Arboreal species on long branches probably do represent rare transitions in largely extinct clades. In Murinae, arboreality appears to be an adaptive peak that is difficult to descend (Figs. 3 and 5; Table 1), but, as was documented in mammals at large (Smits 2015), is not a speciation sink (Fig. S3). Unfortunately, without a rich fossil record, the hypothesis that Arboreal lineages are relicts of historically more diverse clades may remain quantitatively untestable (Pagès et al. 2015).
GENERALIZED MORPHOLOGIES AS RESERVOIRS OF DIVERSIFICATION
In Murinae, we see that the most specialized locomotor modes, Arboreal and Amphibious, are less common that the General and Terrestrial modes. Murine locomotor mode transitions occur largely from generalist to specialist but are not irreversible (Table 1), a pattern that has been observed in a wide variety of organisms (Nosil and Mooers 2005; Day et al. 2016). Models of trait evolution demonstrate that the General body plan is highly conserved (Figs. 4 and 5; Table 3). As many murine tribes and divisions are estimated to have a General ancestor (Fig. 2), the morphological stasis of General forms is relevant to the history of murines. For example, tribes Hydromyini and Rattini, two large clades (Fig. 1; Rowe et al. 2019), both originated from what were likely average-sized rats with TL proportional to HBL and average to short HFL — a body plan similar to many modern day Rattus species. Transitions away from the General regime happen at over twice the rate of transitions to General (Table 1). Combined with the knowledge that murine clades have colonized novel habitats and land masses numerous times throughout their history (Rowe et al. 2019), this suggests that lineages often transitioned to Terrestrial or Arboreal following the successful colonization of a new region. Character-dependent diversification analyses showed that General species in the rare hidden state B have the highest diversification rates (Fig. 6; Fig. S3). The most rapidly diversifying murine clade is the Rattus genus of Southeast Asia and Australia (Upham et al. 2019), a clade that does contain a diversity of locomotor modes but is phenotypically conserved (Rowe et al. 2011). Our results suggest that the success of this highly conserved, yet functionally flexible body plan helped foster the breadth of taxonomic and phenotypic diversity seen in murines today.
Conclusion
We estimated the most comprehensive phylogenetic hypothesis of Murinae and compiled an extensive trait database to investigate the relationship among function, form, and diversification in this exceptional radiation. We found evidence of functional trait integration with, for example, Arboreal murines evolving short feet, long tails, and slender bodies. Similar morphological patterns have been shown in other arboreal vertebrates (Collar et al. 2011; Lapiedra et al. 2013; Alencar et al. 2017; Verde Arregoitia et al. 2017), highlighting a case of parallel evolution in phylogenetically distant taxa with comparable microhabitat use. In specialist murines, correlated evolution of functional traits within locomotor modes appears to have reduced diversification rates by trapping species on an adaptive peak. In contrast, among generalists, correlated morphological evolution led to slow phenotypic evolution but still promoted lineage diversification. The flexibility of this body plan is demonstrated through the recent and rapid global expansion, via human commensalism, of several General murine species, whereas commensalism among Arboreal, Amphibious, or Terrestrial murines is nearly unheard of. We suggest that the body plan of General species, classically referred to as “rat-like,” facilitated the expansion of Murinae across the Eastern Hemisphere over the past several million years. The evolutionary success afforded to the most ecologically labile body forms reveals a role for generalists as seeds of morphological and ecological diversity.
AUTHOR CONTRIBUTIONS
J.A.N. conceived the study through discussions with J.A.E. and K.C.R. J.A.N., K.C.R., J.A.E., A.S.A., and S.M.M. collected data. J.A.N. and G.G.M. analyzed data. J.A.N. wrote the manuscript with extensive input from J.A.E. All authors reviewed early drafts and approved the final version of the manuscript.
ACKNOWLEDGMENTS
We thank members of the Esselstyn lab for helpful comments and suggestions. Portions of this research were conducted with high-performance computing resources provided by Louisiana State University (http://www.hpc.lsu.edu). J.A.N. was supported by a U.S. National Science Foundation (NSF) Graduate Research Fellowship. This work was supported by NSF DEB-1754393, NSF DEB-1441634, and the Alfred L. Gardner and Mark S. Hafner Mammalogy Fund. Dr. Paul Schmidt and three anonymous reviewers provided comments that greatly improved this manuscript.
CONFLICT OF INTEREST
The authors declare no conflict of interest.
DATA ARCHIVING
All data and scripts are archived at http://github.com/jonnations/murine_trait_integration_and_diversification and on Dryad at https://doi.org/10.5061/dryad.zgmsbcc9c
LITERATURE CITED
Associate Editor: C. T. Stayton
Handling Editor: T. Chapman
