


Abstract
Some cardiovascular risk factors (CVRFs) that occur differently in men and women can be addressed to reduce the risk of suffering a major adverse cardiovascular event (MACE). Furthermore, the development of MACE is highly influenced by social determinants of health. Counterfactual decomposition analysis is a new methodology that has the potential to be used to disentangle the role of different factors in health inequalities. This study aimed to assess sex differences in the incidence of MACE and to estimate how much of the difference could be attributed to the prevalence of diabetes, hypertension, hypercholesterolaemia and socioeconomic status (SES).
Descriptive and counterfactual analyses were conducted in a population of 278 515 people with CVRFs. The contribution of the causal factors was estimated by comparing the observed risk ratio with the causal factor distribution that would have been observed if men had been set to have the same factor distribution as women. The study period was between 2018 and 2021.
The most prevalent CVRF was hypercholesterolaemia, which was similar in both sexes, while diabetes was more prevalent in men. The incidence of MACE was higher in men than in women. The main causal mediating factors that contributed to the sex differences were diabetes and SES, the latter with an offsetting effect.
This result suggests that to reduce the MACE gap between sexes, diabetes prevention programmes targeting men and more gender-equal salary policies should be implemented.
Introduction
Cardiovascular diseases (CVDs) are one of the leading causes of death and disability worldwide.1 CVDs are influenced by several cardiovascular risk factors (CVRFs), some of which are modifiable. Most of those CVRFs are related to behavioural lifestyles that can lead to high blood pressure, high levels of glucose and lipids in the blood, overweight and obesity, all key leading factors of CVDs.1
The development of CVRFs and CVDs is highly influenced by social determinants of health (SDoH)2,3 and the relationship between SDoH such as individual-level socioeconomic factors (e.g. education, income and occupation) and CVD is well established.2–4 The effect of these SDoH on CVD persists throughout the life course, as having low socioeconomic status (SES) during childhood is related to a higher risk of CVD in adulthood.2,5,6
In this regard, people with low SES are more likely to present modifiable and behavioural CVRFs and therefore it is a crucial determinant in which to intervene7,8—for example, by incorporating SDoH screening and interventions into chronic disease clinical care.2
Apart from the SDoH mentioned above, sex/gender9,10 also plays a role in the risk of developing CVD. In terms of biological sex, differences between men and women could include the fact that the prevalence of CVRF is different between sexes, that the interaction of CVRFs on the development of CVD is different between them or that women have specific conditions, such as pre-eclampsia, gestational diabetes and premature menopause, which have been associated with an increase in the risk of CVD.11,12 Gender is also an SDoH that has not been traditionally considered in this field despite disparities having been reported in cardiovascular care, especially in acute cardiovascular care.13–15 Furthermore, there are other gender-based factors interrelated with the differences in CVD in women compared with men, such as lower SES, lower levels of physical activity and higher stress due to family responsibilities.14,15 Although biological sex is static, gender is socially constructed, making it possible to intervene and change its effect on CVD.10
For some time now, public health policy has broadened its scope to address inequalities in the distribution of health and to reduce health differences between population groups. With this purpose, the concept of SDoH has been expanded to SDoH inequalities requiring specific methods to capture them.16
To disentangle the relationship between the SDoH and health inequalities, decomposition methods, such as the Blinder–Oaxaca method, are broadly applied.17,18 These methods try to quantify the degree of social inequality in health and the contribution of different factors to that inequality.17 These methods include some limitations—for example, they are based on the decomposition of mean differences between groups and cannot be applied to summary measures of population such as risk ratios (RRs) or disability-adjusted life-years or they do not attempt to estimate causal effect on the group variable so they have ambiguous causal interpretations.19,20 New perspectives on decomposition analysis have been developed in epidemiology, situating them in the causal inference and counterfactual theory.19
These new approaches use parametric models and Monte-Carlo estimation to expand existing decomposition methods used to solve some of the previous limitations20 so that they can be applied to decompose any contrast of any summary population measure. However, these new methods also come with some challenges: they need high computational power and they are not based on aggregate data, so they need large-scale individual-level data and require parametric modelling assumptions.
Studies focused on CVDs have been conducted in men, with a lack of studies among women.21 Furthermore, there is extensive literature on the SDoH related to CVD and on the differences in CVD by sex,2–4,11,13,15,22–24 but to the best of our knowledge, there is a lack of studies disentangling the contributing factors to the sex differences in CVD inequalities. In this regard, counterfactual analysis is a new approach that can be applied to study the impact of the differences in the distribution of CVRFs and SES between men and women with regard to the development of CVD. By identifying these sources of inequality, it is possible to act on them and thus reduce health differences between social groups.
This study aimed to assess sex differences in the incidence of major adverse cardiovascular adverse events (MACEs) and to estimate how much the observed disparity could be attributed to the differences in the prevalence of diabetes, hypertension, hypercholesterolaemia and SES in the region of Aragón, Spain.
Methods
The present study was conducted within the CARhES cohort, a Spanish dynamic cohort comprising people with hypertension, hypercholesterolaemia or diabetes in the region of Aragón, Spain. Aragón is one of the 17 autonomous regions of the country and has a population of about 1.3 million inhabitants that is overwhelmingly attended to by the public health system (98% of the population). The follow-up of this cohort started in 2017 and includes information from all levels of care (hospitalizations, primary care and pharmacy) for the entire population aged 16 or above that has at least one of the three CVRFs mentioned and that is registered in the public health system of the region.
Data sources
All data for this study were obtained from BIGAN, a health data hub that gathers data from all levels of care of the Aragón public health service through the linkage of several databases. For the present study, the following were used: the Users database, which provides information on age and affiliation to the health system; the Hospital Discharge Records (CMBD), which gathers data on hospital discharge; the Adjusted Morbidity Groups, which records information on all medical diagnoses available in primary health care and in the CMBD; the Emergency Care database, which stores information on patients who attended hospital emergencies; and the Electronic Prescribing System database, which records pharmacological treatments prescribed to patients. In these databases, all information is pseudonymized with a unique code that allows patient information to be linked across the different data sources but prevents personal identification.
Study population, inclusion and exclusion criteria
The selection of the study population for the present study is depicted in figure 1. All subjects who were part of the cohort in 2017 and were aged 50 years or older were included. This decision was based on the lower incidence of a MACE at earlier ages and the potential differences in factors influencing the occurrence of the event.25 From them, those with a previous MACE and those who died during the study period, from January 2018 to December 2021, from a cause other than a MACE were excluded.
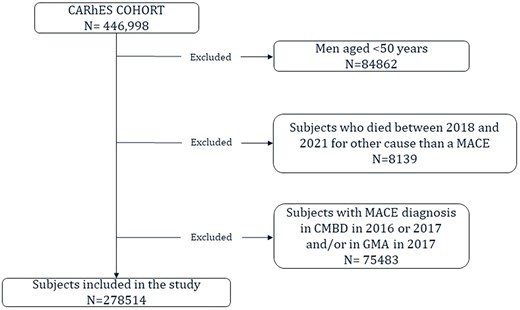
Flowchart depicting the study population.
To identify subjects who had suffered a previous MACE, the Morbidity and/or the CMBD database during 2016 and 2017 were consulted. In both databases, a check was made as to whether they had had a diagnosis of stroke or heart attack.
Study variables
Diabetes, hypertension, hypercholesterolaemia, age and SES were the mediating variables included in the study. They were selected based on their well-known relationship with MACE.11 Sex was included as the exposure variable and MACE as the outcome.
Sex, age and SES were obtained from the Health System Users database in 2017. SES was calculated from two variables: income band and economic activity. These two variables were combined to obtain five different categories of SES: employees earning >18 000€/year, employees earning <18 000€/year, individuals with a contributory pension earning >18 000€/year, individuals with a contributory pension earning <18 000€/year and people with free medicines and others, including mainly those with a special pharmacy regime and with low income. SES was dichotomized into people earning >18 000€/year and the rest when considered as a causal mediating factor, whereas the five categories were used when included as a potential confounder.
The identification of the CVRFs at baseline was performed according to the medical diagnosis recorded in the Morbidity database [hypertension, diabetes mellitus (DM) and hypercholesterolaemia] and/or the pharmacological prescriptions recorded in the Electronic Prescribing System database (DM and hypercholesterolaemia). Antidiabetic and lipid-lowering drugs were identified through the ATC codes: A10 for antidiabetics and C10 for lipid-lowering drugs.
Events considered to be a MACE were identified from the main diagnosis of hospital admissions in the CMBD database and from episodes in the emergency database that caused death. Diagnosis considered MACE in those databases included myocardial infarction (International Classification of Diseases, 10th revision (ICD-10) code I21; International Classification of Diseases, 9th revision (ICD-9) code 410), subarachnoid, intracerebral and other non-traumatic haemorrhage (ICD-10 code I60-I62; ICD-9 code 430-432) and acute ischaemic stroke (ICD-10 code I63; ICD-9 code 433).
Study analysis
Two descriptive analyses by sex were performed; in one, the variables included in the study for the total population and stratified by sex were described and in the other, the incidence of MACE in men and women in each mediating factor was calculated.
Then, to estimate the causal contribution of each mediating factor to the sex difference in MACE incidence, a decomposition of the age-adjusted RR for men relative to women (non-exposed group) was performed.19
Four different models were performed considering one different causal mediating factor in each (diabetes, hypertension, hypercholesterolaemia and SES), adjusted for the rest remaining mediating factors (used as confounders) and age (i.e. in the model that diabetes was considered the mediating factor, hypertension, hypercholesterolemia, SES and age were considered confounders)
The main summary measure of occurrence was the risk of incidence of MACE and the association was the RR for men relative to women, the latter being estimated by applying Poisson regressions.
All these analyses were conducted considering women as the reference category, as the total incidence of MACE was higher in men.
The estimation of the contribution of the causal factors was done by comparing the observed RR with the counterfactual RR. To do this, a counterfactual risk of MACE incidence in men is needed, which was obtained by applying the g-formula and Monte-Carlo integration (Supplementary appendix S1). Thus, two pseudo-populations were created: a so-called ‘natural course’ population by using the coefficients obtained from analyzing the observed data; and a counterfactual pseudo-population created with the coefficients from the analysis using the simulated mediating factor values. The difference between the two populations corresponds to the causal contribution to the inequality.
All analyses were performed with R version 4.2.2 using cfdecomp package.26
All collected data were pseudonymized. The present study was approved by the Clinical Research Ethics Committee of Aragon (project identification code PI21/148).
Results
Table 1 shows the characteristics of the total population at baseline and stratified by sex. In total, 278 515 individuals were included in the study, 44.7% were men and on average women were older. The most prevalent CVRF in both sexes was hypercholesterolaemia, followed by hypertension and diabetes. The first two CVRFs had similar prevalence in men and women, but diabetes was more prevalent in men.
Baseline characteristics in the total population and by sex.
| Total | Men N = 124 602 | Women N = 153 912 | P-value | |
|---|---|---|---|---|
| Age | 67.6 (10.5) | 65.9 (10.0) | 69.1 (10.8) | 0.000 |
| Diabetes | 57 612 (20.7%) | 30 509 (24.5%) | 27 103 (17.6%) | 0.000 |
| Hypercholesterolemia | 205 700 (73.9%) | 90 640 (72.7%) | 115 060 (74.8%) | <0.001 |
| Hypertension | 171 339 (61.5%) | 76 544 (61.4%) | 94 795 (61.6%) | 0.392 |
| Socioeconomic status | 0.000 | |||
| Employees earning >18 000 | 33 812 (12.1%) | 21 969 (17.6%) | 11 843 (7.7%) | |
| Employees earning <18 000 | 39 769 (14.3%) | 18 838 (15.1%) | 20 931 (13.6%) | |
| Retired earning >18 000 | 56 398 (20.2%) | 30 284 (24.3%) | 26 114 (17.0%) | |
| Retired earning <18 000 and free pharmacy | 125 692 (45.1%) | 44 738 (35.9%) | 80 954 (52.6%) | |
| Others | 22 843 (8.20%) | 8773 (7.0%) | 14 070 (9.1%) | |
| MACE in 4-year follow-up period | 5732 (2.06%) | 3169 (2.5%) | 2563 (1.7%) | <0.001 |
Notes: Information showed as number (%) for categorical variables and mean in years (standard deviation) for age. Percentages shown are calculated by columns.
In terms of SES, sex differences were identified, particularly among active individuals earning >18 000€/year and retired individuals earning <18 000€/year or receiving free pharmacy benefits. The largest group was the retired, earning <18 000€/year or with free medicines in both men and women, but in women, this group represented 52.6% of their population while in men it was 35.9%. Additionally, among retired individuals earning <18 000€/year or receiving free pharmacy benefits, women surpassed men in representation. Finally, the incidence of MACE during the follow-up period was 2.5% in men vs 1.7% in women.
Women who suffered a MACE were older than men (77.2 years on average and 70.5, respectively). Table 2 shows the incidence of MACE in men and women in each mediating factor. In both sexes, the incidence of MACE was higher among those with diabetes and hypertension. However, the incidence of MACE was higher in those without hypercholesterolaemia than in those with it. Finally, also in both sexes, the SES group with the highest incidence of MACE was the retired earning <18 000€/year or with free pharmacy.
Incidence of MACE per explanatory factors by sex.
| MACE men | MACE women | |
|---|---|---|
| 3169 (2.5%) | 2563 (1.7%) | |
| Age | 77.2 (10.3) | 70.5 (10.8) |
| Diabetes | ||
| No | 2048 (2.18%) | 1795 (1.42%) |
| Yes | 1121 (3.67%) | 768 (2.83%) |
| Hypertension | ||
| No | 985 (2.05%) | 560 (0.95%) |
| Yes | 2184 (2.85%) | 2003 (2.11%) |
| Hypercholesterolemia | ||
| No | 958 (2.82%) | 773 (1.99%) |
| Yes | 2211 (2.44%) | 1790 (1.56%) |
| Socioeconomic status | ||
| Employees earning >18 000 | 306 (1.39%) | 55 (0.46%) |
| Employees earning <18 000 | 318 (1.69%) | 117 (0.56%) |
| Retired earning >18 000 | 764 (2.52%) | 351 (1.34%) |
| Retired earning <18 000 and free pharmacy | 1599 (3.57%) | 1922 (2.37%) |
| Others | 182 (2.07%) | 118 (0.84%) |
Notes: Information showed as number (%) for categorical. Percentages shown are calculated by row.
Counterfactual analysis
The results of the four counterfactual analyses are shown in figure 2 and in Supplementary appendix S2.

Risk ratio and confidence intervals for natural course and counterfactual populations and percentage of contribution for each explanatory factor.
When diabetes was the mediating factor, the RR in the natural course analysis of having a MACE for men relative to women was 1.83 [95% confidence interval (CI): 1.74–1.92], that is, men had 83% more likelihood of having a MACE than women after adjusting for age, hypertension, hypercholesterolaemia and SES. The counterfactual RR (after setting men to have the same diabetes distribution as women) was 1.74 (95% CI: 1.65–1.83), corresponding to a causal contribution of diabetes to the relationship between sex and the incidence of MACE of 10.5% (95% CI: 7.99–13.08); that is to say, if the prevalence of diabetes in men was the same as in women, the incidence of MACE in men would be reduced from 2.5% to 2.2% in the 4 years of follow-up.
In the case of hypertension, very similar RRs were found in the natural course and counterfactual populations (RR = 1.81; 95% CI: 1.72–1.9 and RR = 1.82; 95% CI: 1.73–1.91, respectively). Therefore, the percentage contribution of hypertension to sex differences was very low (1%, 95% CI: −1.4 to 3.4). Something similar happened in the case of hypercholesterolaemia, with a percentage of contribution near 0.
Finally, when considering the SES as a mediating factor, the RR of MACE in the natural course analysis was smaller (RR = 1.8) than in the counterfactual one (RR = 1.9). This would mean that if we equalized the SES to women’s level, the risk of suffering a MACE among men would increase, with the contribution being negative (−6%). This offsetting effect was observed because MACE was higher among those of low SES (table 2) and more women than men were in the low SES (table 1).
Discussion
This study focused on determining the sex disparity in MACE and disentangling how much of those differences could be attributed to diabetes, hypertension, hypercholesterolaemia and SES. The counterfactual analysis showed that the contributing factors explaining the sex differences in the incidence of MACE were diabetes (10%) and SES (−6%).
The literature shows14,27 that men have a higher incidence of MACE, so the finding of a sex difference in MACE favouring women was expected. Furthermore, women with MACE tend to be older than men. In this regard, a study conducted in the same region found more women with heart failure than men (though women were older) but men were more likely to have ischaemic heart disease and acute myocardial infarction.24 Regarding how MACE was identified in the present study, all cases of MACE who were diagnosed by a doctor were registered in CMBD database, irrespective of their severity. Nonetheless, some minor events that were not diagnosed by a doctor could be lost.
While the literature regarding the relationship of diabetes, hypertension, hypercholesterolaemia and SES with MACE is extensive,11,12,14,28–31 to the best of our knowledge, no previous studies capturing the social determinants of MACE inequalities have been conducted applying the counterfactual decomposition analysis.
In this study, diabetes and SES were the two factors that had an impact on the differences between sexes with regard to the incidence of MACE. Similar to findings in other studies,23,32 diabetes had a higher prevalence in men. In this case, diabetes emerged as the CVRF with the most pronounced difference between sexes. Hence, it is a plausible explanation for diabetes being the predominant factor in accounting for the differences in the incidence of MACE between men and women. The high impact of diabetes on the risk of suffering a MACE has been reported elsewhere,11,12,33 thus, by decreasing the incidence of diabetes in men, the incidence of MACE would be reduced and the sex inequalities diminished.
Similarly, the association of SES with CVD incidence has been found in numerous studies18,34 where lower SES tends to be related to worse results in CVD, in part because of the association between low SES and unhealthier lifestyles.6 A systematic review35 found that women with low SES had a higher risk of suffering a CVD than men with low SES. In the present study, an offsetting effect was identified, indicating that if we equalized the SES in men to that of women, the risk of experiencing a MACE among men would increase. This effect can be explained by the lower SES and incidence of MACE among women. High SES among men is probably acting as a marker of a series of factors in the path towards CVDs.6,8 For example, although men had better SES, commonly, they have had worst lifestyles and higher levels of metabolic risk factors. This fact leads to lower rates of MACE in women than in men and to women being older when they suffer MACE than men. The claim that men had worse lifestyles regardless of their SES is further supported by the fact that women with any CVRFs are older than men with any CVRFs. This may be attributed to the fact that men tend to have poorer lifestyle habits, leading to the earlier development of CVRFs. In light of the results, while gender-based policies to improve the SES among women should be implemented, they should also be accompanied by CVD prevention gender-specific interventions.
Interestingly, despite previous studies focused on CVRFs have shown that severe hypertension and incidence of stroke are twice as high in women compared with men22 and that hypercholesterolaemia has a stronger association with the incidence of infarction in men than in women,13,15 none of these factors contributed to explaining the sex difference in MACE in this study. This apparent discrepancy illustrates the fact that often determinants of health might not be relevant as determinants of health inequalities.
There are studies looking at contributory factors to the sex differences in other health outcomes, such as self-reported health or disability36,37 applying classical decomposition methods. Furthermore, counterfactual decomposition analysis has been applied to other health outcomes.38–40 Nonetheless, to the best of our knowledge, this is the first study using a counterfactual approach to analyze the difference between sexes in the incidence of CVD.
Limitations and strengths
This study has several strengths. First, it was conducted with real-world data, data which come from daily clinical practice and that include a great number of registers. It is remarkable that this information came from different levels of care and comprised all subjects from Aragón older than 16 years with any CVRF. Moreover, we applied a new methodology that allows the causal decomposition of the age-adjusted RR for men relative to women in the incidence of MACE, going further than previous decomposition methods. Finally, to the best of our knowledge, this is the first time that this method has been applied to empirical data and using several mediating variables in the counterfactual decomposition analysis.
This study also has some limitations to be considered. First, the follow-up period was short as we only had data from 2017 to 2021, and studies with longer follow-up periods with longer exposures to CVRFs and more MACEs are necessary. However, the size of the population of this study allowed us to conduct the present study as we had information on the whole Aragonese population with any CVRF. Moreover, since the study used data from administrative databases and because some information was not available or was partly registered (i.e. smoking and physical activity), not all desirable variables were possible to be included in the study. Given the methodology applied, it was not possible to include all the different mediating variables together, so separated models considering only one mediator at a time were run. While it was considered analyzing each diagnosis separately, the low number of cases of each diagnosis made us reconsider that option. Finally, all the people included in our cohort had at least one CVRF, so the population of this study had a high risk of suffering a CVD. However, it is important to take into account that our cohort included more than 70% of the Aragonese population aged above 50 years, increasing the external validity of the results.
Conclusion
We found differences between men and women in the incidence of MACE and in the prevalence of diabetes, while the prevalence of hypercholesterolaemia and hypertension were similar in both sexes.
The CVRFs that most influenced the difference between sexes in the risk of MACE were diabetes and SES. These findings suggest that to reduce the MACE gap between men and women in this Spanish population, diabetes prevention programmes targeting men, and more gender-equal policies should be implemented.
Supplementary data
Supplementary data are available at EURPUB online.
Funding
This work was supported by the Proyecto del Fondo de Investigación Sanitaria, Instituto de Salud Carlos III (Ministerio de Ciencia e Innovación), and the European Fund for Regional Development (FEDER) (PI22/01193). It was also partly funded by the Government of Aragón with a grant for postgraduate research contracts (IIU/796/2019).
Conflicts of interest: There is no conflict of interest in this work.
Data availability
The data underlying this article cannot be shared publicly due to their sensitive nature. The data will be shared on reasonable request to the corresponding author.
Incidence of major adverse cardiovascular events (MACEs) and prevalence of cardiovascular risk factors (CVRFs) are different in men and women.
By analyzing factors that contribute to sex differences in the occurrence of MACE, we can act on them and thus reduce health differences between groups.
The incidence of MACE was 0.8 percentage points higher in men than in women.
The most influential factors in sex differences in the incidence of MACE were diabetes and socioeconomic status.
Diabetes contributed 10% to the sex differences in the incidence of MACE while socioeconomic status had an offsetting effect.
References
Author notes
María José Rabanaque and Miguel San Sebastián contributed equally to this work.

Comments