


Abstract
The number of falls and fall-related injuries will likely increase as the number of older adults expands. Increases in total deaths due to falls have been observed over Europe. Less is known about other injuries leading to death.
To examine the incidence trends of fall-related and other fatal injuries among adults aged 65 or older in Finland.
We analyzed open data from Statistics Finland’s register on the causes of death of those aged ≥65 collected between 1998 and 2020 yielding a total of 32 150 deaths due to injury using Poisson regression and distributional comparisons chi-squared tests.
The most common injuries leading to death among people aged ≥65 in Finland were fall related. There has been an increase in the absolute number of fall-related and other injuries, but when adjusting for person-years in population, a significant decrease can be observed. The crude rates of deaths from fall-related injuries among males annually increased 1.1–4.4% from 1998 to 2020, while the changes in rates among females ranged between −2% and 1.6%. The crude rates of other injuries ranged between −0.5% to +3.8%. Recently (2018–20), nearly 40% of the cases in males and 25% of cases in females were not fall related but comprised other types of injury mechanisms such as traffic, poisoning and drowning.
Strengthening the implementation of preventive strategies is essential to prevent injuries. To reduce injury-related mortality and disability, improvement of acute and post-acute care for injured older patients is warranted.
Introduction
Falls and fall-related injuries in older adults are a major public health issue with societal and economic consequences.1 A systematic review and meta-analysis of 104 studies found that the estimated global prevalence of falls in older adults was 26.5%.2 Total deaths and disability-adjusted life years have varied widely in the Western European region between 1990 and 2017.3The age-standardized incidence of falls varies significantly by country and region of the world.4 For example, the death rates due to falls of older people (over 70 years of age) were highest in the Netherlands, Switzerland, Norway, France and in Finland, and lowest in Portugal and Greece.3 Differences across locations and diverse settings have been identified, which could be due to for example diverse preventative strategies.1 Additionally, mortality in older adults is significantly higher if they are injured at home compared with outdoors. Although these injuries are often associated with person-related intrinsic risk factors, any injuries that happen at home are in part preventable with simple strategies, such as increasing awareness about in-home injuries and environmental modifications at home.5 The earlier guidelines for fall prevention were seen inconsistent by The Task Force on Global Guidelines for Falls in Older Adults, hence evidence and expert consensus-based guidelines for fall prevention were created.1
Finland is a European, Nordic, high-income country with a population of 5.5 million, with a dramatic increase in the number of older adults aged 65 or older. There has been an increase of 97% in males and 51% in females during 1998–2020. Unintentional injuries are the fourth most common cause of death in Finland, causing ∼2600 deaths every year, with falls as a leading cause. More than 1200 persons died from fall- and stumbling-induced injuries in 2017, of which 9 out of 10 happened to persons aged over 65.6 The majority (90%) of fatal unintentional injuries happen at home and during leisure time.7 In the EU countries, the death rate from injuries for those aged ≥65 years was eight times higher than for persons aged ≤65 years.8
Falls are not the only potential cause of injury that leads to fatalities in older adults. A significant fraction of deaths is attributed to various types of other injuries. For example, a Swedish study of 50- to 100-year-old individuals between 2005 and 2016 reveals there has been a significant decrease in intentional poisoning leading to death among older adults, but not unintentional ones.9 A large study on unintentional drowning mortality from 60 countries showed a great variation in age-standardized mortality rate, e.g. countries such as Finland, Japan and Greece had a high rank in mortality rate among older adults. The percentage involving natural water was high in Finland.10 Another previous study conducted in Australia on outcomes of major trauma in patients aged 65 years and older found low falls to be the most frequent type of mechanism leading to injury (62.5%), followed by transport-related events (22.2%) and high falls (9.5%).11 In the USA, a study examining annual death rates from a variety of injuries among older adults between 2007 and 2016 found an increase in deaths related to falls, drug and non-drug, poisonings and drownings and a decline in deaths related to motor vehicle crashes, fires/burns and suffocations.12
There is an immense amount of literature on falls and fall-related injuries in older adults.2–4,11 However, older adults’ other potentially fatal injuries warrant further investigation since they have been studied sparsely in previous research as addressed elsewhere.13 The purpose of our study was to examine the incidence of fall-related and other fatal injuries among older adults (aged 65 and older) in Finland between 1998 and 2020.
Methods
Design and study population
We analyzed open data from the causes of death register from Statistics Finland6 between 1998 and 2020. This study focuses on all injury deaths (ICD-10: V01–X59, Y85–Y86) among older adults, i.e. those aged 65 or older. Trends were assessed between 1998 and 2020. Distributions of injury mechanisms were compared at two time points (1998–2000 and 2018–20). The ICD-based code groups used were: W00–W19 (falls), V01–V89, V91, V93–V9 (traffic), X40–X49 (poisoning), W65–W74, V90, V92 (drowning), W75–W84 (asphyxiation), X31 (cold), X00–X09 (fire, smoke) and W92 (man-made heat).14
Data analysis
The data covered all deaths due to injury in Finland. The variables available were sex, age group, year of death, indicator of intoxication or influence of drugs, alcohol or other substances and the cause of death code according to the ICD-10 classification of external causes.15 In this study, drowning in water transportation was excluded from traffic deaths and included in drownings in general. Basic data tabulations, percentage fractions and trends and incidence rates were reported. Statistical assessment for trends was conducted by Poisson regression, and frequency distributions were compared by chi-squared test.16 When comparing situation between the beginning of study period and the end of it, 3-year averages were reported in order to mitigate statistical variation. The population sizes to adjust the rates were obtained from Statistics Finland’s Population structure open data tables.17 The data are attributed to the official statistics of Finland, therefore yielding high quality, representative coverage. Informed consent was not required due to the nature of the data. R program version 4.1.1. (R Core Team 2014) was used for the analyses and graphs.18
Results
The main type of injury resulting in death among older adults in Finland between 2018 and 2020 was fall related. Among injury-related deaths, on average in 2018–20, 61% (n = 560) males and 77% (n = 521) females died as a result of falls. The corresponding figures were 57% of males and 77% of females in 1998–2000. During the period of 2018–20, nearly 40% of the cases in males and some 23% of cases in females consisted of other miscellaneous types of injury mechanisms. At the beginning of the study period, 1998–2000, these figures were 43% for males and 23% for females. Among all injury-related deaths in 2018–20, around 57% of the deceased were males and 43% were females (table 1).
Distributions of injury mechanisms by sex at two time points (1998–2000 vs. 2018–20)
| Injury | ICD code | Year, males, % | Year, females, % | ||
|---|---|---|---|---|---|
| 1998–2000 | 2018–20 | 1998–2000 | 2018–20 | ||
| Fall | W00–W19 | 57.0 | 61.1 | 76.5 | 76.6 |
| Traffic | V01–V89, V91, V93–V99 | 13.2 | 6.6 | 8.0 | 3.2 |
| Poisoning | X40–X49 | 7.5 | 6.4 | 3.5 | 4.6 |
| Drowning | W65–W74, V90, V92 | 6.4 | 7.3 | 1.5 | 2.6 |
| Asphyxiation | W75–W84 | 4.4 | 2.9 | 2.8 | 2.6 |
| Cold | X31 | 2.2 | 3.3 | 1.8 | 2.1 |
| Fire, smoke | X00–X09 | 2.0 | 1.6 | 1.1 | 1.1 |
| Manmade heata (e.g. sauna) | W92 | 1.5 | 2.4 | 0.3 | 2.3 |
| Other miscellaneous* | 5.8 | 8.3 | 4.5 | 5.0 | |
| Total | 100.0 | 100.0 | 100.0 | 100.0 | |
Exposure to excessive heat of man-made origin.
Other accidental injuries not listed above.
Incidence rates among falls and other injury events have decreased during the study period. Among falls, the incidence rate ratio (IRR) for 1 year increase in a year ranged between 0.981 and 0.991 in males in age groups of 65–74, 75–84 and 85 and older. Correspondingly, in females, it ranged between 0.970 and 0.984. Among other injuries, IRR ranged between 0.978 and 0.986 in the different male age groups, and in females, it was 0.985 in all age groups (table 2).
Time trends by age groups and sex, as well as annual average percentage changes in trends
| RR | %-change | P-value | IRR | %-change | P-value | ||
|---|---|---|---|---|---|---|---|
| Fall-related (male) | 65–74 | 1.011 | +1.1 | 0.0003 | 0.981 | −1.9 | <0.0001 |
| 75–84 | 1.017 | +1.7 | <0.0001 | 0.987 | −1.3 | <0.0001 | |
| 85+ | 1.044 | +4.4 | <0.0001 | 0.991 | −0.9 | 0.0002 | |
| Other injury (male) | 65–74 | 1.008 | +0.8 | 0.0007 | 0.978 | −2.2 | <0.0001 |
| 75–84 | 1.015 | +1.5 | <0.0001 | 0.985 | −1.5 | <0.0001 | |
| 85+ | 1.038 | +3.8 | <0.0001 | 0.986 | −1.4 | 0.0137 | |
| Fall related (female) | 65–74 | 0.994 | −0.6 | 0.233 | 0.973 | −2.7 | <0.0001 |
| 75–84 | 0.98 | −2 | <0.0001 | 0.97 | −3 | <0.0001 | |
| 85+ | 1.016 | +1.6 | <0.0001 | 0.984 | −1.6 | <0.0001 | |
| Other injury (female) | 65–74 | 1.006 | +0.6 | 0.0949 | 0.985 | −1.5 | <0.0001 |
| 75–84 | 0.995 | −0.5 | 0.2520 | 0.985 | −1.5 | 0.0004 | |
| 85+ | 1.017 | +1.7 | 0.0021 | 0.985 | −1.5 | 0.0049 |
IRR, incidence rate ratios; %-change, percentual change in incidence rate (or crude rate) when year increases by one; RR, crude rate ratios. Stratified by mechanism (fall related or other type of injury). Change in incidence rate (death counts in relation to relevant person–years) and crude rate (crude death counts, not adjusted by person–years) by 1 year increase in time.
Fall injuries among males
The annual number of fall-related injuries in males aged ≥65 has increased since the beginning of the study period (1998) when 370 males died due to falling. Injuries resulting from falling from stairs occurred more often in the age group of 65–84 than those aged 85 or older. The same was observed in injuries resulting from falling due to slippery ice and snow. However, these categories together constitute <10% of all falls (table 3). Most of the fall events were classified as ‘other fall’ or ‘other unspecified fall’. The majority of these falls were classified as “fall on the same level” suggesting a low-energy trauma.
Types of falls leading to death in older adults by age group and sex in 2018–20, average by year
| Type of falls | Male 65–84, % | Male 85+, % | Female 65–84, % | Female 85+, % |
|---|---|---|---|---|
| Fall involving ice and snow | 2.8 (0.54) | 1.1 (0.38) | 1.0 (0.45) | 0.5 (0.22) |
| Fall involving furniture | 3.6 (0.61) | 4.7 (0.78) | 4.0 (0.88) | 5.7 (0.71) |
| Fall on and from stairs and steps | 5.8 (0.76) | 4.4 (0.75) | 5.0 (0.98) | 2.3 (0.46) |
| Other fall from one level to anothera | 2.7 (0.53) | 0.8 (0.33) | 0.8 (0.40) | 0.3 (0.17) |
| Other fall on same levelb | 68.4 (1.52) | 82.0 (1.41) | 78.6 (1.84) | 85.1 (1.09) |
| Other and unspecified fallc | 16.7 (1.22) | 7.0 (0.93) | 10.5 (1.38) | 6.2 (0.74) |
Values are given as proportions and (standard deviations).
W17 Incl.: fall from or into: cavity, cherry picker, dock, haystack, hole, lifting device, mobile elevated work platform [MEWP], pit, quarry, shaft, sky lift, tank, well.
W18 Incl.: fall from bumping against object, from or off toilet, on same level, not otherwise specified (NOS).
W19 Incl.: accidental fall NOS.
Fall injuries among females
The annual number of fall-related injuries in females aged ≥65 has not changed significantly since 1998 (n = 539). Fall injuries that involved furniture were more common among females aged 85 and older than in the younger age group. The same observation was found regarding other fall events on the same level. These categories together constituted over 90% of all falls among females aged 85 and older (table 3). Injuries resulting from falls on and from stairs and steps were more frequent among females in the age group 65–84 than in the older age group.
Other injury mechanisms in males
The annual average (between 2018 and 2020) of other causes leading to deaths except falls in males were poisonings 17% (n = 59), traffic injuries 17% (n = 61), drownings 19% (n = 67), hypothermia 9% (n = 30), asphyxiation 7% (n = 26), manmade heat, e.g. sauna 6% (n = 22), exposure to fire, smoke or flames 4% (n = 15) and other miscellaneous mechanisms 21% (n = 76). We found a statistically significant change in the distribution of injury mechanisms in males between 1998–2000 and 2018–20 among all types of mechanisms (P = 0.0005) and in all mechanisms excluding falls as well (P = 0.0009). In 2018–20, fall-related injuries were slightly more prominent while the proportion of traffic injuries decreased from 13.2% to 6.6%. The proportion of asphyxiation declined as well (table 1).
Other injury mechanisms in females
Other causes leading to death in females were poisonings 20% (n = 31), traffic injuries 14% (n = 22), drownings 11% (n = 17), asphyxiation 11% (n = 18), manmade heat, e.g. sauna 10% (n = 15), hypothermia 9% (n = 14), exposure to fire, smoke or flames 5% (n = 8) and other miscellaneous mechanisms 21% (n = 34). There was a statistically significant change between 1998–2000 and 2018–20 among all types of mechanisms (P = 0.0014) and in all mechanisms excluding falls as well (P = 0.0007). There was a change in the distribution of injury mechanisms in females in 2018–20, with the most obvious decline being in the proportion of traffic injuries decreasing from 8% to 3%. The situation of fall-related injuries in females was virtually identical between the years of comparison. Drownings and saunas became more prominent (table 1).
Time trends
A population structure forecast by Statistics Finland17 predicts that the number of those aged 65 years and over (∼1.3 million in 2022) will increase by around 16% by 2040 and 36% by 207017 (Supplementary figure S1). Crude rates without controlling for changes in population size indicate several increasing trends, ranging from 0.6% to 4.4% (table 2). Nevertheless, there has been a significant decrease in the incidence rates of older adults’ injury deaths while taking into account the increasing size of the aging population (figure 1). The annual mean decline in the incidence among age groups has ranged from 0.9% to 3.0% between 1998 and 2020 (table 2).
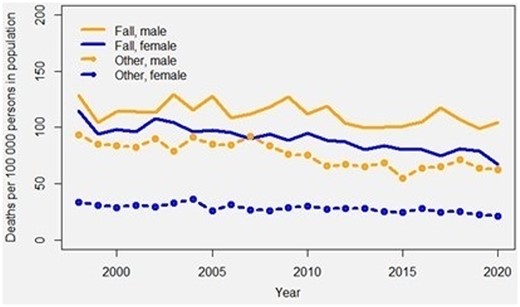
Temporal trends in incidence rates of fatal fall-related and other fatal injuries in females and males aged 65 and older, 1998–2020
Discussion
In this national study, we explored the incidence of fatal injuries among older adults in Finland. Our study showed the most common injury leading to death among people aged ≥65 to be related to falls at the two time points (1998–2000 vs. 2018–20). The three next common injury causes leading to deaths among older adults were traffic injuries, poisonings and drownings.
The crude rates of fall-related fatal injuries increased in males between 1998 and 2020, while remaining almost the same among females. These findings are in accordance with a previous study on fall-induced deaths among older adults in Finland between 1971 and 2009 implying a continuous trend.19 Falling is often related to age and disease-associated changes in nutritional status, balance, gait and muscle strength.1,20 In addition, an increase in the number of older people with cognitive disorders and increased alcohol consumption are risk factors for fall injury events.21 A Norwegian study found a 10-fold increased risk of fall injuries among older adults with alcohol intoxication.22 We observed that alcohol involvement was recorded in a significant fraction of injury deaths among older people. Alcohol poisoning itself is a significant cause of death among middle-aged and older adults in Finland until around the age of 70, as at the age of 75 and older only a few people succumb to alcohol poisoning. In all deaths among those aged 65–69, at least 40% of the cases involved alcohol intoxication.6
Hip fracture is one of the most frequent serious fall-related trauma in older populations worldwide carrying an increased risk of short- and long-term mortality, disability and decreased quality of life.23 Furthermore, hip fractures have been estimated to account for up to 50% of fall-induced deaths.19 A hip fracture is typically a consequence of a low-energy trauma caused by a fall from the same or low level in a frail older person with osteoporosis. The majority of the patients are females but the higher mortality rate in male hip fracture patients compared with females is well established.24 Half of the patients have either a previously known or undiagnosed cognitive disorder25 and the mortality burden in these patients is particularly high.26 The number of hip fractures is predicted to increase. Finland is not an exception in the estimated increasing number of hip fractures during the next decades in spite of the subtle observed decrease in age-adjusted incidence.27 According to a recent review of studies on mortality trends and geographical variations between countries following hip fracture over the last 60 years, the mean age of hip fracture patients had increased steadily (73 years in the 1960s to 82 years in the 2010s) and the proportion of males has increased, while females are still the majority (70%).28 Moreover, the 1-year mortality of hip fracture patients has reduced from an overall mean of 27–20%. The authors argue that the decrease in mortality could be explained by progressive development in preventative planning, medical management, specialized orthogeriatric units and prompt surgery.28
In Finland, more than 6000 hip fractures are operated on annually. There are differences in mortality figures between different regions of the country but a 1-year mortality of up to 27% has been reported.29 The treatment costs of hip fractures are high. In the Finnish setting, the total costs for the first year was EUR 30 900 of which 60% (2013) was attributed to the first treatment cost with an estimate of EUR 18 450.30 Orthogeriatric collaboration, where comprehensive geriatric assessment is integrated into the acute perioperative care of older hip fracture patients in the trauma ward, has been implemented in some hospitals and shown to reduce short-term mortality and improve the quality of care of this vulnerable patient population.31 It is worth noting that patients with cognitive disorders were shown to benefit both from orthogeriatric care31 and multidisciplinary geriatric rehabilitation.32 However, in spite of the evidence, the optimal care and rehabilitation practices for hip fracture and other fragility fracture patients still need to be more widely implemented in the Finnish healthcare system.
Besides hip fractures, other fall-related serious and potentially fatal injuries may occur. In Finland, an increasing incidence of fatal cervical spine injuries has been reported. The persons affected by these injuries tend to be older than in the past and a substantial number of the patients are males who have sustained a low-energy fall.31,33 Another recent study from Finland reported that the incidence rate of geriatric traumatic brain injury (TBI)-related hospitalizations has increased, especially in women.34 The overall TBI-related mortality remained stable in men but increased in women while the overall incidence rates of TBI-related hospitalizations and deaths were still higher in men. It is worth noting that the higher incidence rates of deaths related to both cervical spine and traumatic brain injuries in older males compared with females are in accordance with the increasing incidence of fall-related fatalities in males observed in the present study.
There is an urgent need for more active implementation of effective fall and other injury prevention strategies. A systematic review conducted in 2016 found that the greatest efficacy of fall prevention interventions was observed in multifactorial interventions before combined education and exercise.35 In fall prevention, exercise has been found to additionally increase health-related quality of life among older adults.1,36 The World Guidelines for Falls recommend that all older adults should be offered an individualized and progressive exercise program aimed at improving mobility and muscle strength.1 Importantly, evidence-based secondary fall and fracture prevention, addressing both multifactorial fall assessment and evidence-based treatment of osteoporosis, such as fracture liaison services,37 need to become a priority in the development of our healthcare services.
Our study revealed that the second most common injury cause leading to death among older adults was poisoning. Almost every fifth mechanism leading to death was poisoning. Older adults aged >65 years are vulnerable to intentional and unintentional poisoning, due to for example polypharmacy. The increase in medication intake raises the risk of drug interaction and medication errors.38 Traffic injuries were the third most common injury cause leading to death among older adults in this study. This could be explained by several age-related chronic health conditions, or physical and cognitive changes that are likely to affect driving patterns.39 Our findings showed that drownings have increased over the decades in both sexes. The incident was more frequent in males. A systematic review conducted between 1980 and 2015 on drownings among older people found male sex, ethnicity, rurality and increasing age to be risk factors.40
Long-term work has been carried out in Finland to prevent injuries. Still, there are regional differences in the implementation of evidence-based practices of injury prevention, care and rehabilitation. The treatment pathways need to be uniform and consistent in quality. Therefore, a long-term target to reduce the number of injuries that lead to loss of health or death has been launched. To implement this target, a new 10-year program for the prevention of home and leisure injuries called ‘Safety at All Ages’ was introduced in 2020 by the Finnish Ministry of Social Affairs and Health. It has a total of 89 measures of which 29 are targeted at preventing injuries in older adults.7 The program emphasizes the interdisciplinary nature of injury prevention, and it takes into account the significant role of non-profit organizations and other associations in injury prevention in Finland. Several measures in the program aimed at strengthening professionals’ knowledge and skills to prevent injuries. In addition, the program acknowledges the important role of family and friends in promoting safety, especially among older people and in particular among those with cognitive disorders. In Finland, the responsibility for organizing healthcare, social welfare and rescue services has been integrated from the start of 2023. Collaboration between counties and municipalities focuses on promoting health and wellbeing and preventive work.
Strengths and limitations
This study has some limitations. Due to the nature of the data, only structures defined by the ICD-10 classification system could be analyzed and therefore some potentially interesting details could not be reported (i.e. the settings of injuries and functional ability of those affected) therefore deeming the study to be somewhat general or non-specific. Furthermore, the data present the results of Finland, which can therefore limit the generalization of the results. The strength of the study is in representative, full population data covering all injurious deaths in the entire country with the ICD-10 classification system implemented throughout the whole study period yielding excellent coherency in assessing trends. Our study revealed a comprehensive range of other miscellaneous types of injury mechanisms among older adults. The data are deemed as the official statistics of Finland, which provides reliable information and accurate data and is therefore highly trusted.
Conclusion
The number of fatal injuries in older adults can be expected to rise as life expectancy continues to increase. Many of the injuries are preventable and predictable. Reinforcing the implementation of preventive recommendations such as the Global World Guidelines for fall prevention and management for older adults1 and other proactive actions are needed to prepare for upcoming public health challenges and to reduce fatal injuries among older adults. Moreover, in order to reduce injury-related mortality, disability, impaired quality of life and costs, the improvement of evidence-based acute and post-acute care and rehabilitation of older patients with injuries also has to be prioritized in our healthcare system.
Ethical considerations
This study is based on open data from the causes of death register from Statistics Finland and ethical approval was not required.
Supplementary data
Supplementary data are available at EURPUB online.
Authors contributions
All authors contributed to the study design. T.Y. and K.H. drafted the manuscript. K.H. conducted the analysis. T.Y and K.H. wrote the first draft of the manuscript in collaboration with M.N., H.K. and R.K. All authors reviewed and approved the final version of the manuscript for submission.
Funding
This research received no specific grant from any funding agency in the public, commercial or not-for-profit sectors.
Conflicts of interest: M.N. has been part of an advisory board of Amgen. Other authors declare no conflicts of interest.
Data availability
The data that support the findings of this study are available from Statistics Finland, but restrictions apply on the availability of these data, which were used under license for this study, and so are not publicly available.
The most common injuries among both males and females were fall related, while other injury mechanisms such as traffic, poisoning and drowning were more common among males.
During the observation period, the incidence of fall-related deaths increased in males while the incidence in females remained stable.
The implementation of preventive strategies is needed to ensure older adults’ protection from fatal injuries.
In order to reduce injury-related mortality and other negative consequences, more attention has to be paid to improving the acute and post-acute care of the injured older adults.
References
Korpilahti U, Koivula R, Doupi P, et al. Safely at All Ages – Programme for the Prevention of Home and Leisure Injuries 2021–2030. [online], 2021. Available at: http://urn.fi/URN:ISBN:978-952-00-5398-7 (28 August 2023, date last accessed).

Comments