


Abstract
The aim was to compare alcohol drinking patterns in economically active people aged 50–64 years before the last economic crisis (2006) and during the crisis (2013).
Cross-sectional study with data from 25 479 economically active people aged 50–64 years resident in 11 European countries who participated in wave 2 or wave 5 of the SHARE project (2006 and 2013). The outcome variables were hazardous drinking, abstention in previous 3 months and the weekly average number of drinks per drinker. The prevalence ratios of hazardous drinking and abstention, comparing the prevalence in 2013 vs. 2006, were estimated with Poisson regression models with robust variance, and the changes in the number of drinks per week with Poisson regression models.
The prevalence of hazardous drinking decreased among both men (PR = 0.75; 95%CI = 0.63–0.92) and women (PR = 0.91; 95%CI = 0.72–1.15), although the latter decrease was smaller and not statistically significant. The proportion of abstainers increased among both men (PR = 1.11; 95%CI = 0.99–1.29) and women (PR = 1.18; 95%CI = 1.07–1.30), although the former increase was smaller and not statistically significant. The weekly average number of drinks per drinker decreased in men and women. The decreases in consumption were larger in Italy and Spain.
From 2006 to 2013, the amount of alcohol consumed by late working age drinkers decreased in Europe, with more pronounced declines in the countries hardest hit by the economic crisis.
Introduction
Alcohol consumption is associated with many adverse health and social consequences1 and represents one of the leading risk factors for disease and disability globally.2 Each year, ∼2.5 million deaths worldwide could be attributed to alcohol use (3.8% of all deaths).3
Relevant socioeconomic changes, such as increases in unemployment rates and decreases in gross domestic product, have occurred in recent years in most European countries as a result of the late 2000s economic crisis.4 Economic crises have been related with an increase in alcohol-related morbidity and mortality.5,6 Several mechanisms could be involved in the relationship between economic downturns and alcohol use. Recessions are periods of generalized economic insecurity, in which many people lose their jobs or reduce their income. Income reductions may result in tighter individual budget constraints, which can lead to less money being spent on alcoholic beverages and less alcohol consumption.7 However, job loss or income reductions may increase psychological distress in some people and place them at higher risk of adopting risky drinking patterns to cope with these feelings.7,8 Unemployment seems to be one of the most important economic stressors. As a consequence of the shrinking job markets, job loss becomes more usual and the difficulty of finding a new job after losing it is elevated. This fact is especially marked in people >50 years because of their lower probability of being reemployed than younger adults during an economic downturn.9,10
Given this, it may be expected that the late 2000s recession in Europe, and the changes it has brought in the working status of people, had influenced the patterns of alcohol consumption, in particular in the population aged 50–64 years. Knowing the extent of the changes on alcohol drinking patterns could be useful in better understanding how an economic crisis impacts on the population’s health, and especially taking into account that negative health behaviours established or re-established during economic difficulties can persist afterwards and become a life-long habit.11 Therefore, the aim of this study was to compare alcohol drinking patterns in economically active people aged 50–64 years before the last economic crisis (2006) and during the crisis (2013).
Methods
This study uses two cross-sectional waves (waves 2 and 5) of the SHARE project surveys (Survey of Health, Ageing and Retirement in Europe), which were conducted in 2006–07 (hereinafter referred to as 2006) and 2013, respectively.12,13 The study population consisted of 25 479 people aged 50–64 years (8016 from wave 2 and 17 463 from wave 5) resident in the 11 European countries that participated in both waves of the SHARE survey (Austria, Belgium, Czech Republic, Denmark, France, Germany, Italy, Netherlands, Spain, Sweden and Switzerland). Sampling was performed independently in each country; all countries obtained a probabilistic sample, although the exact sample design differed slightly between countries. Weights were established for each country in order to ensure that the resulting samples were representative of the population of each country, and were comparable with other countries. In order to see the effects of the economic crisis on the alcohol consumption of the late working aged active people (i.e. employed and unemployed who were seeking work), the exclusion criteria in both waves were being retired, a homemaker or work-disabled. The fraction of subjects excluded from the study due to lack of data for any of the individual variables was 2.6%.
The outcome variables were: hazardous drinking (i.e. an average daily consumption of >2 and >3 alcoholic drinks in the previous 3 months in women and men, respectively); and abstention (i.e. not drinking any alcoholic beverage during the 3 months prior to the interview). Besides, to analyse variations in the volume of alcohol consumed, the weekly average number of drinks per drinker was used as an outcome variable.
The individual-level independent variables were: sex, age, country of residence, educational level (high education; middle education; low education), migrant background (native; immigrant) and self-perceived health (excellent, very good or good; fair or poor). We classified the countries into tertiles with low, medium or high impact of the crisis, based on the extent to which the unemployment rate increased from 2006 to 2013.
Analysis
All analyses were conducted separating by sex. The prevalence of hazardous drinkers and abstainers, plus 95% confidence intervals (95%CI), were estimated for 2006 and 2013 by country. We also estimated the prevalence ratios of hazardous drinking and abstention, comparing the prevalence in 2013 with the one in 2006, using Poisson regression models with robust variance.14 We used Poisson regression models with robust variance instead of logistic regression models as they yield prevalence ratios (PR). The advantage of PR as compared with odds ratio is that they have a concrete interpretation even when prevalence rates are high. Besides, we estimated the weekly average number of drinks per drinker with their 95%CI. To analyse whether there were changes in the mean number of drinks consumed per drinker each week, we fit Poisson regression models, which yield relative risks. Finally, we conducted the same analyses but grouping the countries in tertiles based on the increase in national unemployment rate and adjusting for the unemployment rate in 2006. Statistical analyses were conducted using STATA 14.
Results
The distribution of the sample in 2006 and 2013 by sex is shown in Supplementary table S1. With regard to alcohol consumption, the prevalence of hazardous drinkers in men was twice the one in women (8.5 and 6.5% in men and 4.1 and 3.7% in women in 2006 and 2013, respectively). The prevalence of abstainers was higher in women than in men (e.g. in 2006 it was 19.0% in women and 13.1% in men). Overall, the mean number of drinks consumed per drinker per week decreased from 2006 to 2013: from 5.5 to 4.8 in women and from 10.7 to 9.2 in men.
As shown in table 1, once adjusting by the individual level variables, we found no statistically significant change in the prevalence of hazardous drinking in women from 2006 to 2013 (PR = 0.91; 95%CI = 0.72–1.15), whereas the proportion of abstainers increased (PR = 1.18; 95%CI = 1.07–1.30). Conversely, in men (table 2), we found a decrease in the prevalence of hazardous drinking during the study period (PR = 0.75; 95%CI = 0.63–0.92), while the prevalence of abstainers increased, but not with statistical significance (PR = 1.11; 95%CI = 0.99–1.29). In both genders, the decreases in the prevalence of hazardous drinking were more pronounced in France, Italy and Spain. Besides, the highest increases in the prevalence of abstainers in women were found in Italy, Spain and the Netherlands, whereas in men they were found in Austria, Italy and Spain.
Changes in the prevalence of hazardous drinking and abstention of alcohol consumption in economically active women aged 50–64 years from 2006 to 2013
| UR 2006 | Absolute change in UR | 2006–07 | 2013 | |||||||
|---|---|---|---|---|---|---|---|---|---|---|
| % | 95%CI | % | 95%CI | Diff | 95%CI | aPR | 95%CI | |||
| Hazardous drinkers | ||||||||||
| Tertile 1 | ||||||||||
| Germany | 10.4 | −5.1 | 2.8 | (1.5; 5.2) | 1.9 | (1.1; 3.0) | −1.0 | (−2.9; 0.9) | 0.66 | (0.29; 1.41) |
| Czech Republic | 7.2 | −0.1 | 1.8 | (0.8; 4.0) | 3.1 | (1.7; 5.6) | 1.3 | (−0.5; 3.2) | 1.90 | (0.65; 5.36) |
| Austria | 5.3 | 0.1 | 2.5 | (0.6; 9.6) | 2.8 | (1.6; 4.8) | 0.2 | (−3.3; 3.7) | 0.90 | (0.24; 4.82) |
| Belgium | 8.3 | 0.2 | 5.5 | (3.7; 8.3) | 7.2 | (5.1; 10.2) | 1.7 | (−1.2; 4.6) | 1.32 | (0.78; 2.28) |
| Tertile 2 | ||||||||||
| Switzerland | 4.1 | 0.4 | 2.1 | (0.9; 5.0) | 3.9 | (2.5; 6.0) | 1.8 | (−0.6; 4.2) | 1.68 | (0.60; 4.85) |
| France | 8.9 | 1.1 | 4.7 | (2.9; 7.6) | 1.8 | (0.9; 3.4) | −2.9 | (−5.2; −0.6) | 0.36 | (0.14; 0.83) |
| Sweden | 7.1 | 1.2 | 1.3 | (0.6; 2.7) | 0.7 | (0.3; 1.7) | −0.6 | (−1.7; 2.3) | 0.48 | (0.14; 1.66) |
| Netherlands | 4.3 | 2.4 | 8.1 | (5.6; 11.6) | 7.3 | (5.2; 10.1) | −0.8 | (−4.3; 2.7) | 0.87 | (0.53; 1.44) |
| Tertile 3 | ||||||||||
| Denmark | 4.0 | 3.2 | 6.0 | (4.2; 8.6) | 5.4 | (3.9; 7.4) | −0.6 | (−3.3; 2.1) | 0.87 | (0.54; 1.40) |
| Italy | 6.9 | 5.5 | 4.6 | (1.9; 11.0) | 3.2 | (1.6; 6.3) | −1.4 | (−4.7; 1.9) | 0.63 | (0.21; 1.70) |
| Spain | 8.5 | 17.7 | 5.8 | (3.0; 10.7) | 3.8 | (1.7; 8.5) | −1.9 | (−5.7; 1.8) | 0.67 | (0.24; 1.97) |
| Total | 4.1 | (3.5; 4.8) | 3.7 | (3.2; 4.4) | −0.4 | (−1.2; 0.4) | 0.91 | (0.72; 1.15) | ||
| Abstainers | ||||||||||
| Tertile 1 | ||||||||||
| Germany | 10.4 | −5.1 | 17.6 | (13.6; 22.4) | 17.7 | (15.4; 20.2) | 0.1 | (−4.6; 4.7) | 1.02 | (0.75; 1.32) |
| Czech Republic | 7.2 | −0.1 | 30.8 | (25.0; 37.3) | 29.6 | (25.0; 34.7) | −1.2 | (−6.9; 4.5) | 0.95 | (0.74; 1.24) |
| Austria | 5.3 | 0.1 | 25.6 | (17.3; 36.2) | 20.5 | (16.4; 25.4) | −5.1 | (−14.6; 4.4) | 0.90 | (0.56; 1.34) |
| Belgium | 8.3 | 0.2 | 13.2 | (10.1; 17.2) | 14.9 | (12.0; 18.3) | 1.6 | (−2.6; 5.9) | 1.27 | (0.87; 1.69) |
| Tertile 2 | ||||||||||
| Switzerland | 4.1 | 0.4 | 13.6 | (9.9; 18.4) | 14.0 | (11.0; 17.5) | 0.4 | (−4.8; 5.5) | 1.12 | (0.74; 1.70) |
| France | 8.9 | 1.1 | 20.0 | (16.0; 24.7) | 14.2 | (11.1; 18.0) | −5.8 | (−10.5; −1.1) | 0.75 | (0.53; 1.03) |
| Sweden | 7.1 | 1.2 | 9.5 | (7.2; 12.5) | 9.3 | (7.3; 11.8) | −0.2 | (−3.4; 3.0) | 1.09 | (0.77; 1.58) |
| Netherlands | 4.3 | 2.4 | 15.3 | (11.6; 19.9) | 18.8 | (15.4; 22.8) | 3.5 | (−1.3; 8.4) | 1.18 | (0.87; 1.68) |
| Tertile 3 | ||||||||||
| Denmark | 4.0 | 3.2 | 5.8 | (4.0; 8.4) | 5.7 | (4.3; 7.6) | −0.1 | (−2.8; 2.5) | 1.00 | (0.63; 1.59) |
| Italy | 6.9 | 5.5 | 52.9 | (44.9; 60.7) | 58.1 | (52.0; 64.1) | 5.2 | (−3.0; 13.4) | 1.10 | (0.91; 1.31) |
| Spain | 8.5 | 17.7 | 44.3 | (35.6; 53.4) | 47.8 | (40.9; 54.8) | 3.5 | (−4.7; 11.7) | 1.04 | (0.80; 1.33) |
| Total | 19.0 | (17.6; 20.5) | 21.9 | (20.7; 23.3) | 2.9 | (1.3; 4.5) | 1.18 | (1.07; 1.30) | ||
Notes: UR: unemployment rate; Diff: difference in prevalence from 2006 to 2013; aPR: adjusted prevalence ratios of 2013 with respect to 2006; 95%CI: 95% confidence interval. They were adjusted for age, employment situation, educational level, migrant background and self-perceived health. Countries were classified in tertiles depending on the variation in the unemployment rate from 2006 to 2013: (a) tertile 1: low variation; (b) tertile 2: medium variation; (c) tertile 3: high variation.
Changes in the prevalence of hazardous drinking and abstention of alcohol consumption in economically active men aged 50–64 years from 2006 to 2013
| UR 2006 | Absolute change in UR | 2006–07 | 2013 | |||||||
|---|---|---|---|---|---|---|---|---|---|---|
| % | 95%CI | % | 95%CI | Diff | 95%CI | aPR | 95%CI | |||
| Hazardous drinkers | ||||||||||
| Tertile 1 | ||||||||||
| Germany | 10.4 | −5.1 | 6.9 | (4.4; 10.7) | 5.3 | (3.9; 7.0) | −1.6 | (−4.4; 1.1) | 0.76 | (0.44; 1.24) |
| Czech Republic | 7.2 | −0.1 | 7.4 | (4.4; 12.3) | 14.2 | (10.6; 18.8) | 6.8 | (3.6; 10.0) | 1.87 | (1.00; 3.48) |
| Austria | 5.3 | 0.1 | 5.5 | (2.3; 12.6) | 6.7 | (4.4; 10.1) | 1.2 | (−3.0; 5.3) | 1.15 | (0.47; 3.05) |
| Belgium | 8.3 | 0.2 | 11.4 | (8.6; 15.0) | 6.6 | (4.7; 9.2) | −4.8 | (−8.1; −1.5) | 0.59 | (0.38; 0.91) |
| Tertile 2 | ||||||||||
| Switzerland | 4.1 | 0.4 | 4.5 | (2.6; 7.8) | 6.5 | (4.4; 9.5) | 2.0 | (−1.1; 5.0) | 1.35 | (0.65; 2.52) |
| France | 8.9 | 1.1 | 17.2 | (10.3; 27.3) | 8.6 | (5.4; 13.5) | −8.6 | (−12.7; −4.5) | 0.47 | (0.29; 0.79) |
| Sweden | 7.1 | 1.2 | 1.5 | (0.7; 3.4) | 1.1 | (0.5; 2.4) | −0.4 | (−1.6; 0.8) | 0.75 | (0.26; 2.17) |
| Netherlands | 4.3 | 2.4 | 11.2 | (8.1; 15.5) | 7.3 | (5.1; 10.4) | −3.9 | (−7.3; −0.6) | 0.63 | (0.41; 1.07) |
| Tertile 3 | ||||||||||
| Denmark | 4.0 | 3.2 | 6.7 | (4.8; 9.3) | 7.7 | (5.8; 10.1) | 1.0 | (−1.8; 3.7) | 1.19 | (0.76; 1.82) |
| Italy | 6.9 | 5.5 | 10.3 | (7.1; 14.9) | 4.7 | (3.1; 6.9) | −5.6 | (−9.1; −2.2) | 0.44 | (0.27; 0.79) |
| Spain | 8.5 | 17.7 | 9.4 | (6.2; 14.2) | 4.1 | (2.4; 6.7) | −5.4 | (−8.8; −2.0) | 0.42 | (0.23; 0.81) |
| Total | 8.5 | (7.3; 9.9) | 6.5 | (5.8; 7.3) | −2.0 | (−2.9; −1.0) | 0.75 | (0.63; 0.92) | ||
| Abstainers | ||||||||||
| Tertile 1 | ||||||||||
| Germany | 10.4 | −5.1 | 14.8 | (11.0; 19.6) | 13.6 | (11.5; 16.1) | −1.2 | (−5.1; 2.8) | 0.96 | (0.67; 1.28) |
| Czech Republic | 7.2 | −0.1 | 17.6 | (13.0; 23.3) | 12.4 | (9.3; 16.2) | −5.2 | (−9.1; −1.2) | 0.63 | (0.41; 0.95) |
| Austria | 5.3 | 0.1 | 9.9 | (5.2; 17.9) | 16.9 | (13.1; 21.5) | 7.0 | (1.3; 12.6) | 1.72 | (0.89; 3.48) |
| Belgium | 8.3 | 0.2 | 10.0 | (7.5; 13.2) | 13.7 | (10.7; 17.3) | 3.7 | (1.8; 7.2) | 1.27 | (0.88; 1.83) |
| Tertile 2 | ||||||||||
| Switzerland | 4.1 | 0.4 | 8.4 | (5.6; 12.3) | 8.7 | (6.3; 12.0) | 0.3 | (−3.5; 4.1) | 0.94 | (0.56; 1.52) |
| France | 8.9 | 1.1 | 13.7 | (9.2; 19.9) | 9.5 | (6.5; 13.8) | −4.2 | (−8.0; −0.3) | 0.98 | (0.59; 1.52) |
| Sweden | 7.1 | 1.2 | 6.3 | (4.3; 9.2) | 7.7 | (5.4; 10.8) | 1.4 | (−1.3; 4.0) | 1.35 | (0.77; 2.36) |
| Netherlands | 4.3 | 2.4 | 13.1 | (9.6; 17.7) | 10.6 | (7.7; 14.3) | −2.6 | (−6.3; 1.2) | 0.79 | (0.53; 1.23) |
| Tertile 3 | ||||||||||
| Denmark | 4.0 | 3.2 | 4.9 | (3.3; 7.3) | 5.2 | (3.7; 7.2) | 0.3 | (−2.1; 2.6) | 1.03 | (0.61; 1.75) |
| Italy | 6.9 | 5.5 | 27.2 | (21.5; 33.8) | 34.0 | (28.6; 39.9) | 6.8 | (1.1; 12.4) | 1.27 | (0.96; 1.67) |
| Spain | 8.5 | 17.7 | 22.0 | (16.6; 28.6) | 25.3 | (19.8; 31.6) | 3.3 | (−1.9; 8.4) | 1.11 | (0.80; 1.67) |
| Total | 13.1 | (11.8; 14.5) | 14.6 | (13.4; 15.8) | 1.5 | (0.3; 2.7) | 1.11 | (0.99; 1.29) | ||
Notes: UR: unemployment rate; Diff: difference in prevalence from 2006 to 2013; aPR: adjusted prevalence ratios of 2013 with respect to 2006. 95%CI: 95% Confidence Interval. They were adjusted for age, employment situation, educational level, migrant background and self-perceived health. Countries were classified in tertiles depending on the variation in the unemployment rate from 2006 to 2013: (a) tertile 1: low variation; (b) tertile 2: medium variation; (c) tertile 3: high variation
When accounting only for the people who had drunk at least one alcoholic beverage in the 3 months prior to the interview (table 3), we observed that the mean number of drinks consumed per week decreased from 5.4 (95%CI = 5.1–5.8) to 4.8 (95%CI = 4.4–5.2) in women in 2006 and 2013, and from 10.7 (95%CI = 10.0–11.4) to 9.2 (95%CI = 8.7–9.7) in men. Once we had adjusted for various individual variables, we found that the mean number of drinks consumed per week decreased from 2006 to 2013 in both women and men (RR = 0.88, 95%CI = 0.80–0.98; and RR = 0.86, 95%CI = 0.79–0.93, respectively). In both genders, the largest decreases in the weekly average number of drinks per drinker were found in Spain, Italy and France. Despite the overall decrease in alcohol consumption, a statistically significant increase in consumption per drinker was found in Czech men.
Changes in the mean number of drinks per drinker per week from 2006 to 2013, estimated using Poisson regression models, with 95%CI
| UR 2006 | Absolute change in UR | Women | Men | |||||||||||
|---|---|---|---|---|---|---|---|---|---|---|---|---|---|---|
| 2006–07 | 2013 | 2006–07 | 2013 | |||||||||||
| Mean | 95%CI | Mean | 95%CI | RR | 95%CI | Mean | 95%CI | Mean | 95%CI | RR | 95%CI | |||
| Tertile 1 | ||||||||||||||
| Germany | 10.4 | −5.1 | 6.5 | (5.3; 7.6) | 5.9 | (5.0; 6.7) | 0.79 | (0.57; 1.10) | 12.5 | (10.6; 14.3) | 10.1 | (9.0; 11.2) | 0.71 | (0.54; 0.94) |
| Czech Republic | 7.2 | −0.1 | 4.3 | (3.6; 5.0) | 5.2 | (4.3; 6.1) | 0.91 | (0.56; 1.47) | 8.1 | (5.9; 10.2) | 9.0 | (7.3; 10.6) | 1.41 | (1.06; 1.89) |
| Austria | 5.3 | 0.1 | 3.1 | (2.0; 4.2) | 3.8 | (2.9; 4.6) | 1.20 | (0.77; 1.88) | 7.3 | (5.1; 9.4) | 9.7 | (7.4; 12.1) | 1.31 | (0.88; 1.94) |
| Belgium | 8.3 | 0.2 | 3.7 | (3.1; 4.3) | 3.0 | (2.6; 3.4) | 0.88 | (0.70; 1.11) | 4.6 | (3.7; 5.5) | 4.5 | (4.0; 5.1) | 0.82 | (0.68; 0.99) |
| Tertile 2 | ||||||||||||||
| Switzerland | 4.1 | 0.4 | 10.0 | (5.5; 14.5) | 6.6 | (3.4; 9.7) | 1.24 | (0.92; 1.67) | 16.0 | (11.6; 20.5) | 9.3 | (8.0; 10.7) | 1.05 | (0.77; 1.45) |
| France | 8.9 | 1.1 | 8.1 | (4.7; 11.6) | 5.6 | (4.2; 7.0) | 0.50 | (0.37; 0.68) | 14.4 | (11.5; 17.3) | 9.3 | (8.3; 10.4) | 0.70 | (0.54; 0.93) |
| Sweden | 7.1 | 1.2 | 3.9 | (2.3; 5.5) | 3.6 | (2.8; 4.4) | 0.78 | (0.63; 0.95) | 10.0 | (7.7; 12.3) | 13.7 | (10.6; 16.8) | 0.99 | (0.79; 1.24) |
| Netherlands | 4.3 | 2.4 | 5.8 | (5.2; 6.4) | 5.1 | (4.6; 5.6) | 1.17 | (0.90; 1.53) | 9.8 | (8.6; 11.0) | 9.2 | (8.2; 10.1) | 0.76 | (0.65; 0.88) |
| Tertile 3 | ||||||||||||||
| Denmark | 4.0 | 3.2 | 7.9 | (7.0; 8.9) | 9.4 | (7.1; 11.7) | 0.87 | (0.76; 0.99) | 13.3 | (11.7; 14.9) | 10.1 | (9.0; 11.1) | 0.94 | (0.81; 1.10) |
| Italy | 6.9 | 5.5 | 4.1 | (3.0; 5.2) | 3.2 | (2.7; 3.6) | 0.60 | (0.38; 0.93) | 10.6 | (7.9; 13.4) | 7.5 | (6.8; 8.3) | 0.65 | (0.52; 0.81) |
| Spain | 8.5 | 17.7 | 5.9 | (4.3; 7.4) | 3.2 | (2.7; 3.6) | 0.63 | (0.35; 1.14) | 13.3 | (10.2; 16.4) | 9.2 | (7.6; 10.9) | 0.59 | (0.43; 0.82) |
| Total | 5.4 | (5.1; 5.8) | 4.8 | (4.4; 5.2) | 0.88 | (0.80 0.98) | 10.7 | (10.0; 11.4) | 9.2 | (8.7; 9.7) | 0.86 | (0.79; 0.93) | ||
Notes: Economically active individuals aged 50–64 years who had drunk at least an alcoholic beverage in the 3 months previous to the interview, by sex and year. UR: unemployment rate; RR: relative risks of 2013 with respect to 2006; 95%CI: 95% confidence interval. They were adjusted for age, employment situation, educational level, migrant background and self-perceived health. Countries were classified in tertiles depending on the variation in the unemployment rate from 2006 to 2013: (a) tertile 1: low variation; (b) tertile 2: medium variation; (c) tertile 3: high variation
Figure 1 shows the change in the prevalence of hazardous drinking and in the mean number of drinks per week from 2006 to 2013 stratified by the change in the national unemployment rate. In both men and women, a larger increase in the unemployment rate from 2006 to 2013 was associated with a generally greater decline in the prevalence of hazardous drinking and the mean number of drinks consumed per week during the period.
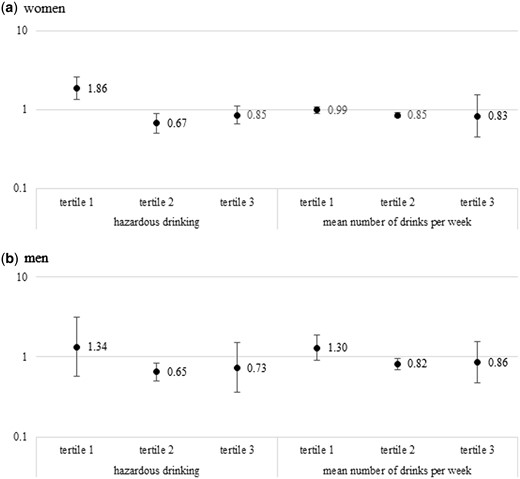
Changes in the prevalence of hazardous drinking and the mean number of drinks per drinker per week from 2006 to 2013 in relationship to the increase in national unemployment rate (tertile 1: low or no increase; tertile 2: medium increase; tertile 3: high increase). SHARE survey 2006–13
Discussion
Between 2006 and 2013, the number of drinks consumed per drinker decreased in active men and women aged 50–64 years. Besides, hazardous drinking decreased in late working age European men and women, but changes were not statistically significant in women. The prevalence of abstainers increased in both genders, but the increase was only statistically significant in women. The magnitude of the changes observed varied between countries. We found that countries with larger increases in the unemployment rate had generally greater declines in the prevalence of alcohol consumption from 2006 to 2013.
Strengths and limitations
One of the strengths of this study is that although data came from two surveys conducted in 2006 and 2013, the alcohol-related questions and other variables used in this study were fully comparable over time. Conversely, the study could suffer certain limitations. One limitation of the study is that the prevalence of hazardous drinking was estimated based on self-reported data. Given the fact that many drinkers tend to underreport their level of alcohol consumption,15 our data are likely to have underestimated the number of drinks and the prevalence of hazardous drinking. For our study, the degree of underestimating may have changed between the first and second survey years. Although clear evidence is lacking, underestimation may be larger in the second survey year if underreporting is related to the rising prevalence of poverty and unemployment. Despite the fact that hazardous drinking usually decreases during periods of economic crisis, it has been suggested that other alcohol-related risky patterns, such as binge drinking could increase.8,16–22 However, based on our data, we could not estimate changes in binge drinking between 2006 and 2013 due to changes in how the question was asked between the two surveys (in 2006, binge drinking was considered as drinking four or more drinks in one occasion, while in 2013 the binge drinkers were the ones who consumed six or more drinks on a single occasion).
Changes in alcohol consumption during the economic crisis
The decline in alcohol consumption in active people aged 50–64 years from 2006 to 2013 could have multiple explanations. One possible explanation is that the reduction in alcohol consumption and the increased prevalence of abstainers may be a consequence of the economic crisis that has affected Europe in recent years. Various studies found a decrease in per capita alcohol use and in the prevalence of hazardous or heavy drinking in different European countries in response to worsening economic conditions.19,23,24 For example, a study on employed people in Spain found a decrease in the prevalence of hazardous drinking during the last economic crisis.18
Although we found a decrease in the point estimate of hazardous drinking in both genders, changes between 2006 and 2013 were only statistically significant in men. In addition, the proportion of abstainers also rose during the period, being statistically significant in women. These variations in alcohol use may be related to the theory of the income effect, which suggests that alcohol use would decrease during economic downturns as less income is available and this will result in tighter individual budget constraints, so that less money would be spent on alcoholic beverages.7,16,24 The reduction in the weekly average number of drinks per drinker in both men and women during this period also reinforces the plausibility of this theory. Besides, it has been suggested that men are more affected by changes in the economic cycle,25 which may be related to gender roles, which is in line with our results in which decreases in consumption were generally stronger among men.
The hypothesis of the relationship between the decrease in alcohol consumption and the economic crisis is supported by the larger decreases in alcohol consumption found in the countries with the largest increase in national unemployment rates. This association is illustrated by Spain and Italy, which were the countries in which the economic conditions worsened most from 2006 to 2013, in terms of increases in the unemployment rate and the decreases in the GPD.26,27 Our findings would suggest that the worsening of the economic conditions in a country may be associated with a decrease in alcohol consumption, and probably also with less alcohol-related consequences globally. However, in a period of economic crisis, some vulnerable populations could be affected by the worsening of economic conditions and increase their alcohol consumption.28
Another explanation related to the effect of the last economic crisis on alcohol consumption is that some health problems (e.g. mental diseases and infectious diseases) may increase during periods of economic recession.4,29,30 It has been observed that people diagnosed with these diseases may reduce alcohol use to avoid a worse prognosis and the interaction of alcohol with their medication.31,32 However, in our study, we found that the reduction in the prevalence of hazardous drinking and the alcoholic drinks consumed per week on average remained stable after adjusting for self-perceived health (results not shown).
Moreover, the decline in alcohol consumption may be explained by long-term trends in alcohol consumption at the country level. A convergence in per capita alcohol consumption has been observed in Europe since the World War II:33 the Northern European countries have increased their overall consumption, the Southern European countries have decreased the amount consumed and the Eastern and Central European countries experienced no clear pattern. In the countries participating in the study, there was a slight downward trend in alcohol consumption per capita in last decades.
Another possible explanation for our findings is that drinking patterns in Europe may have changed in recent years. Thus, it could be that drinkers have reduced considerably the amount of alcohol they regularly consume, but occasional binge drinking has increased. Although we could not test this hypothesis in our study, it would be consistent with studies suggesting that when economic conditions worsen in a country, the prevalence of binge drinking increases.16,18 Given that binge drinking is a pattern of drinking that poses important risks to health, population-based studies assessing variations in binge drinking over time should be conducted.
Conclusions
Our findings add to previous evidence that from 2006 to 2013 alcohol consumption decreased in active people aged 50–64 years from 11 European countries. This reduction was higher in the countries that were most affected by the last economic crisis, suggesting that economic crises may have an impact on alcohol consumption and thus result in lower alcohol-related mortality. However, it could be possible that during a period of economic instability some changes in drinking patterns occur and some people switch to a riskier drinking pattern such as binge drinking. Further studies assessing possible changes in binge drinking during a period of economic downturn are needed.
Supplementary data
Supplementary data are available at EURPUB online.
Funding
This study was supported by the Spanish Network on Addictive Disorders [RD12/0028/0018 and RD16/0017/0013] and a Health Strategic Action grant [PI13/00183]. The stay of Marina Bosque-Prous at the University of Amsterdam was partially funded by an Exchange Award from the European Foundation for Alcohol Research. The funding sources had no involvement in the study design, the collection, analysis and interpretation of data the writing of the report and the decision to submit the article for publication. This article is part of the doctoral dissertation of Marina Bosque-Prous, at the Universitat Pompeu Fabra. This paper uses data from SHARE Waves 2 and 5 (DOIs: 10.6103/SHARE.w2.600, 10.6103/SHARE.w5.600). The SHARE data collection has been primarily funded by the European Commission through FP5 (QLK6-CT-2001-00360), FP6 (SHARE-I3: RII-CT-2006-062193, COMPARE: CIT5-CT-2005-028857, SHARELIFE: CIT4-CT-2006-028812) and FP7 (SHARE-PREP: N°211909, SHARE-LEAP: N°227822, SHARE M4: N°261982). Additional funding from the German Ministry of Education and Research, the Max Planck Society for the Advancement of Science, the U.S. National Institute on Aging (U01_AG09740-13S2, P01_AG005842, P01_AG08291, P30_AG12815, R21_AG025169, Y1-AG-4553-01, IAG_BSR06-11, OGHA_04-064, HHSN271201300071C) and from various national funding sources is gratefully acknowledged (see www.share-project.org)
Conflicts of interest: None declared.
Key points
Alcohol consumption decreased in active people aged 50–64 years from 2006 to 2013.
The prevalence of hazardous drinking also decreased and the proportion of abstainers increased over the period.
The more pronounced declines were found in the countries hardest hit by the economic crisis (Spain and Italy).
References

Comments