


Abstract
Background: Health inequalities have widened within and between many European countries over recent decades, but Europe-wide sub-national trends have been largely overlooked. For regions across the European Union (EU), we assess how geographical inequalities (i.e., between regions) and sociospatial inequalities (i.e., between regions grouped by an area-level measure of average household income) in male and female life expectancy have changed between 1991 and 2008. Methods: Household income, life expectancy at birth and population count data were obtained for 129 regions (level 2 Nomenclature of Statistical Territorial Units, ‘NUTS’) in 13 European countries with 1991–2008 data (2008 population = 272 million). We assessed temporal changes in the range of life expectancies, for all regions and for Western and Eastern European regions separately. Results: Between 1991 and 2008, the geographical range of life expectancies found among European regions remained relatively constant, with the exception of life expectancy among male Eastern Europeans, for whom the range widened by 2.8 years. Sociospatial inequalities in life expectancy (1999–2008 data only) remained constant for all regions combined and for Western Europe, but more than doubled in size for male Eastern Europeans. For female Eastern Europeans, life expectancy was unrelated to regional household income. Conclusions: Regional life-expectancy inequalities in the EU have not narrowed over 2 decades, despite efforts to reduce them. Household income differences across European regions may partly explain these inequalities. As inequalities transcend national borders, reduction efforts may require EU-wide coordination in addition to national efforts.
Introduction
Substantial geographical disparities in health are evident at multiple scales, including between neighbourhoods,1 cities,2 regions,3–5 countries6 and continents.7 Documenting these differences and their development over time is an important first step in ascertaining and addressing their underlying causes.
Within Europe, studies of geographical inequalities in health have mostly compared regions within single countries8–10 or have compared nations.11–13 Leon13 compared life expectancy trajectories from 1970 to 2009 between 22 European countries and found little closure of the health gap in the past 2 decades, as most countries experienced similar rates of improvement. Nonetheless, analysis at the country level can obscure finer-resolution differences in health, and may cause researchers to over-state the importance of national-level factors in determining health inequalities.13–15
Geographical health inequalities often reflect underlying spatial differences in socioeconomic conditions; areas with wealthier populations tend to be healthier. This relationship is usually assumed to be driven by individual-level associations—that is, a primarily compositional rather than contextual effect.16 However, area-level socioeconomic circumstances have also been independently related to health inequalities, using multilevel techniques that allow the simultaneous investigation of individual- and higher-level effects.17,18 In many European countries, socioeconomic health inequalities at the individual level have widened in recent decades,12,19–23 but whether this widening is also found at the area level has been little studied. Addressing the inequitable distribution of health will require an understanding of its determinants—the circumstances in which people grow, live, work and age—as well as recognition that these conditions are themselves generated and perpetuated by the wider socioeconomic, political and environmental context.24
In the 1990s, Shaw et al.14 pooled data from the then 15 Member States of the European Union (EU) and compared their 160 regions. The mortality rate difference between the most and least healthy regions grew by 11% between 1990 and 1994. In this study, we use a further 14 years of data, analyze males and females separately and add a socioeconomic dimension. Our study groups sub-national regions by measures of health (life expectancy) and socioeconomic status (household income) rather than by national boundaries, as in most international studies. Specifically we assess how inequalities in life expectancy, at the sub-national level, have changed in the EU between 1991 and 2008. Inclusion of Eastern as well as Western European regions offers the opportunity to assess whether the well–documented East-West health divide14,15, typically a nationally reported phenomenon, persists at the sub-national level.
Methods
Geographical units
The European ‘Nomenclature of Statistical Territorial Units’ (NUTS) classification was established to make cross-border comparisons feasible. The 2006 NUTS level 2 geography was obtained,25 as these were the smallest units for which comparable data were available over time (average population 2.1 million for the NUTS2 regions in our study).
Health and population data
Life expectancy at birth was chosen as the health outcome to minimize errors from international differences in diagnostic and coding practices. Life expectancy is typically higher for females than males; therefore, sex-specific life expectancy at birth and population data were downloaded for as many NUTS2 regions and years as available.26
Socioeconomic data
Income is closely related to mortality,20 hence we obtained regional average household income data as our area-level measure of socioeconomic status.26 Average primary income for private households is estimated using Purchasing Power Consumption Standard units per capita (an artificial currency unit obtained by the conversion of the income parameters of private households with specific purchasing power standards for final consumption expenditure) which allows for meaningful comparison between countries.
Data availability
To account for occasional missing values, we calculated 3-year moving averages, such that each year was given the average value of itself and the preceding and subsequent years. Some non-mainland regions were atypical of their countries or had very small populations, which gave rise to missing or unreliable data [Åland (Finland: FI20); Ceuta, Melilla and the Canary Islands (Spain: ES63, ES64, ES70); French overseas territories (FR91, FR92, FR93 and FR94); and Madeira and the Azores (Portugal: PT30, PT20)]. These regions were therefore excluded. The resulting data set contained continuous life-expectancy and population data from 1991 to 2008, and household income data from 1999 to 2008, for 129 NUTS2 regions within 13 countries. Eight of these countries (96 regions) were Western European (Austria, Belgium, Spain, Finland, France, Italy, Portugal and Sweden) and five (33 regions) were Eastern European (Czech Republic, Estonia, Hungary, Lithuania and Poland).
Analyses
We analyzed geographical and sociospatial inequalities in life expectancy between groups of European regions. Geographical inequalities refer to differences in life expectancy between regions grouped by their life expectancy. Sociospatial inequalities describe differences in life expectancy between regions grouped by their mean household income. Regions were aggregated into deciles based on either (a) life expectancy or (b) household income for each year, so that each decile contained approximately the same number of people. Population-weighted average life expectancy was calculated for each decile by multiplying each region’s life expectancy by its population, summing these across the decile and then dividing by the decile’s total population. We define inequalities as the difference between the most extreme groups in each year—i.e., the shortest and longest lived deciles of regions, or those with the smallest or largest mean household incomes. In doing so, we are assessing the change in the range of life expectancy over time, rather than tracking the life expectancy changes for set groups of regions. Differences were calculated in both absolute (years) and relative (%) terms. However, as the relative results closely mirrored the absolute ones, we present only absolute inequalities here.
Results
Geographical inequalities in life expectancy
Between 1991 and 2008, regional life expectancy increased by an average of 4.6 years for males (range 0.1–6.5) and 3.6 years for females (range 1.2–5.3; figure 1). Male life-expectancy gains were lowest in Lithuania (a single NUTS2 region, with an increase of only 0.1 years) and highest in parts of Italy and France. For females, the lowest life-expectancy gains also occurred in Lithuania, and the greatest improvements occurred in parts of Poland, France and Portugal.

Eastern European regions dominated the lowest deciles of male and female life expectancy throughout the period, and regions with the highest life expectancy were in France, Spain, Italy and Sweden (figure 2). Life expectancy rankings remained relatively stable over time: regions experiencing high or low life expectancies at the start tended to maintain their position.

Average life expectancies for regions in the shortest- and longest-lived deciles each year, and the absolute gap between them, are shown in figure 3. In most cases, life expectancy increased steadily over time, and the trajectories were roughly parallel. Consequently, there were no marked changes in absolute inequalities over the 18 years, except for the 2.8-year widening seen for males in Eastern European regions (figure 3c). Much of this widening occurred in the early 1990s and mid-2000s, with almost a decade of stability in between. This illustrates the inherent limitations of calculating change between relatively arbitrary start and end points without reference to the intervening period.
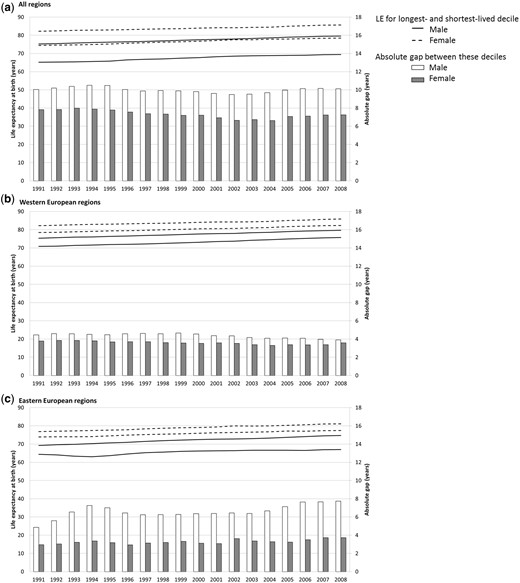
Average life expectancy at birth (‘LE’, population-weighted average, years) for regions in the shortest- and longest-lived deciles each year between 1991 and 2008, and the absolute gap between them. Male and female data shown separately for (a) all regions, (b) Western European regions and (c) Eastern European regions
Apart from male Eastern Europeans, the other sex and national groupings showed no clear trend over time (figure 3). The ranges of life expectancies observed for each of these groupings changed by less than a year between 1991 and 2008. Given the small size of these changes, and the influence of the start and end points that were imposed by data availability, these findings cannot be considered as indicative of long-term trends. Only for male life expectancies in Eastern European regions were the smallest and largest gaps found at the start and end of the study period, respectively, suggesting overall widening over time. Figure 3c indicates, however, that this trend was not linear.
To assess whether the patterns were contingent on the regions included, we compared trends observed over the latter half of the study period with those obtained from a separate set of regions for which 2001–2008 data were available. These comprised 91 regions from 6 countries: Germany, UK, Ireland, Latvia, The Netherlands and Slovakia. For these regions, the change in absolute inequalities in male and female life expectancy over the same period differed by no more than 0.2 years compared with the original results (both correlation coefficients = 0.9).
Sociospatial inequalities in life expectancy
The absolute gap in average household income between the highest- and lowest-income deciles increased between 1999 and 2008, for all regions combined and for the Eastern and Western European subsets. In Eastern Europe, the gap widened by 45% over the period, compared with 15% in Western Europe and 14% for all regions combined.
Life expectancies in the lowest- and highest-income deciles each year increased steadily over time in all regions (figure 4a) and Western Europe (figure 4b). Hence, there was little change in these absolute gaps between 1999 and 2008 (all less than 0.5 years).
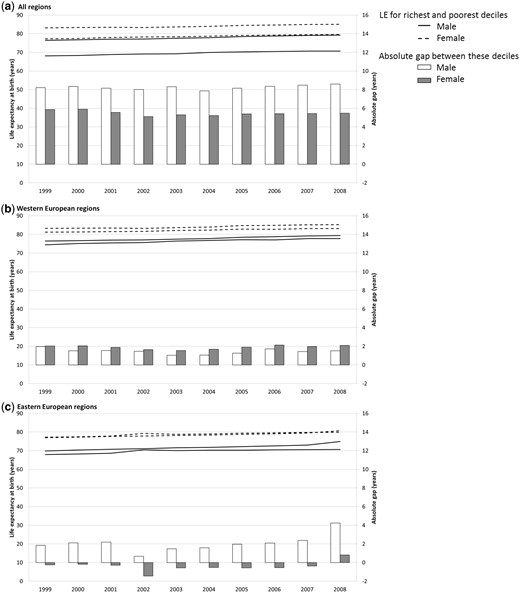
Average life expectancy at birth (‘LE’, population-weighted average, years) for regions in the lowest- and highest-income deciles each year between 1999 and 2008, and the absolute gap between them. Male and female data shown separately for (a) all regions, (b) Western European regions and (c) Eastern European regions
For Eastern European regions, however, sociospatial inequalities in life expectancy showed different patterns (figure 4c). Life expectancies for males in the lowest-income Eastern European regions each year almost stagnated after 2002, increasing by an average of only 15 days each year (compared with 135 days per year for males in the lowest-income Western European regions). As male life expectancies in the highest-income Eastern European regions increased at a faster rate over time, the gap in 2008 (4.2 years) was more than double that in 1999 (1.8 years).
Figure 4c reveals little difference in female life expectancies between Eastern European regions with the lowest and highest average incomes. Females in the lowest-income decile had marginally higher life expectancy (average 0.5 years) than those in the highest-income decile for 9 of the 10 years. The life expectancy trajectories of the other eight deciles (not shown) were similarly erratic, suggesting a degree of noise in these data. We explored the possibility that membership of the household income deciles was highly unstable, as this could be symptomatic of data quality issues, but this was not found to be the case. We were therefore reassured that the data were of similar quality across the groupings.
Sociospatial inequalities in life expectancy averaged 84 and 78% of the Europe-wide geographical life-expectancy gap for males and females, respectively (correlation coefficients between income and life expectancy each year all >0.73, P < 0.0001). In Western European regions, income and life expectancy were less correlated: coefficients ranged 0.21–0.36 for males (P < 0.05) and 0.16–0.23 for females (half significant at P < 0.05). In Eastern European regions, we found good correlations for male life expectancy (coefficients 0.47–0.54, P < 0.01), but no relationship for females (0.04–0.26, P > 0.10).
Discussion
In most regions of Europe, life expectancy increased steadily between 1991 and 2008. Geographical inequalities—the life expectancy gaps between the shortest- and longest-lived regions each year—have remained relatively constant for all sex and national groupings apart from males in Eastern Europe. Among this group, the range of male life expectancies widened by almost 3 years across the period. Since 1989, Eastern European countries have experienced radical social and economic reforms after the transition from communism to capitalism. It has been postulated that the transition had a disproportionate effect on the health of working-age males.15,27 Our findings suggest that this health legacy persisted into the 2000s. After the accession of Eastern European countries to the EU in 2004, and the resulting opportunities for economic migration to the West, it is possible that health-selective migration28 may act to maintain or widen the gap further.
The well-documented and persistent ‘East-West health divide’15,29,30 is apparent from our analyses, as the shortest- and longest-lived deciles comprised only Eastern and Western European regions, respectively. At the sub-national level, we found no indication that the East–West health divide widened between 1991 and 2008, in contrast to the work of Vågerö,15 who reported a continued widening since the 1960s (at the national level). However, our sample excluded non-EU Eastern European nations—some of whom experienced worsening life expectancy between 1990 and 2005.15 Life expectancies in Eastern European EU nations have recently been improving at the same rate as in Western Europe,13 suggesting it may be difficult to close this gap. Identifying the key drivers of the geographical inequalities—whether political, economic, environmental and so on—will be an important first step in this regard.
We investigated the contribution of between-region household income differences to the geographical inequalities in life expectancy observed. In the Europe-wide analysis, the sociospatial inequality accounted for most of the geographical difference: i.e., the lowest- and highest-income regions were often also the shortest- and longest-lived, respectively. At the finer resolution afforded by the Eastern and Western European analyses, however, we found some decoupling between life expectancy and regional socioeconomic status. In the most extreme case, regional household income was unrelated to female life expectancy in Eastern Europe. In Slovakia, Rosicova et al.31 also found socioeconomic differentials in regional mortality for males but not females, using education, employment and income indicators. Given the substantial economic upheaval experienced in Eastern Europe in recent decades, it is feasible that the key determinants of population health in these regions, and their relevance for male and female health, differ from those in Western Europe.
Widening individual-level social inequalities in mortality over time have previously been reported for most of the countries in our analysis.11,12,19–23,32–37 As found for geographic inequalities, we found widening sociospatial inequality in life expectancy only for male Eastern Europeans, whereas the gaps for the other groupings remained constant. The stability of these regional inequalities is surprising in the context of the widening income differences observed within each population group over time. The widening inequality in male life expectancy in Eastern Europe may relate to the steeper rate at which the income gap has widened over time in these regions.
Our work has methodological implications. The fluctuations in narrowing and widening we observed over time highlighted the need for a fine temporal resolution when studying how inequalities in life expectancy have changed over time. Indeed, if restricted to between 1991 and 1994, our analysis would reveal a slight widening of the geographical inequality in Western Europe, corresponding with the widening gap in all-cause mortality reported by Shaw et al.14 (for the regions of 15 Western European countries between 1990 and 1994). Thus, trends identified for short periods may have limited generalizability to longer periods.
Our study had limitations. First, the data were collected by 13 separate national administrations, and although Eurostat strives to ensure their reliability and comparability, some inconsistencies may persist. Second, the NUTS2 regions varied substantially in population size in some cases, which may have affected the original life-expectancy data and our calculations based on them. We omitted regions with the smallest populations and unstable life-expectancy estimates, and used population-weighted averaging techniques and deciles to ameliorate these issues. Third, countries with many regions may have dominated decile trends and downweighted the contribution of single-region countries. The single-region countries in this study consisted of the Baltic States of Lithuania and Estonia: nations that have experienced particularly poor health and turbulent changes in life expectancy in recent decades.13 Fourth, we were unable to test whether the findings were sensitive to the measure of socioeconomic status used, due to a lack of indicators with comparable spatial and temporal coverage. Finally, due to data availability, our analysis ended in 2008, at the start of the global economic crisis. As the crisis will undoubtedly have more severe socioeconomic and health effects in some regions and countries than in others,15 it is vital that these are investigated once data become available.
Although the imperative to reduce health inequalities is widely acknowledged, there has been uneven progress across Europe to address the problem.38,39 Reducing these inequalities is likely to require EU-wide coordination in addition to national efforts. The EU’s Joint Action on Health Inequalities project, initiated in 2011, could provide a good baseline, through encouraging knowledge transfer, improved access to structural funds and EU-wide policy-making. The EU’s response to the recent financial crisis illustrates the feasibility of coordinating EU-wide fiscal and policy action when political will exists.
Funding
This work was supported by the European Research Council [ERC-2010-StG Grant 263501].
Conflicts of interest: None declared.
A geographical focus has been largely absent from Europe-wide health inequalities work, although spatial determinants of health are likely to be important.
Regional life-expectancy inequalities in the EU have not narrowed over recent decades, despite efforts to reduce them. Inequalities have widened for males in Eastern Europe.
Household income differences may partly explain the inequalities, although not for females in Eastern Europe.
As inequalities in life expectancy in Europe transcend national borders, efforts to reduce them may require EU-wide coordination in addition to national efforts.
Acknowledgements
The authors thank three anonymous reviewers for giving helpful comments that have improved the article.

Comments