


Abstract
Background: In this paper, we investigate cross-sectional and prospective relationships between various socioeconomic indicators and different health behaviours among boys and girls at ages 13–21, and whether socioeconomic status (SES) is related to changes in health behaviour over time. Methods: The study is based on a 10-year, two-generation prospective cohort study of health and lifestyle factors among a sample of Norwegian adolescents and their parents. Data presented here were collected at the ages of 13 (baseline), 15, 18 and 21. Parental and adolescent reports of socioeconomic factors were assessed along with a number of health-enhancing and health-compromising behaviours, both as single behaviours and as part of health behaviour indices. Results: Relatively few significant relationships are observed between parental occupation and adolescents' reported health behaviour when the latter is analysed as single behaviours. A significant, but weak, social gradient in health-enhancing behaviour is observed when measuring health behaviour as composite indices rather than single forms of behaviour. This is apparent both when applying parental SES variables or adolescents' own educational aspirations as proxy measures of their socioeconomic status. Conclusion: Future investigations of the presence of a social gradient in adolescent health behaviour should focus on composite measures of health behaviour. Further research is needed on potential mediating mechanisms behind the SES–health behaviour relationships in youth.
A number of studies have confirmed the presence of stable social class differences in health in several European countries,1 also in welfare states traditionally marked by commitment to social equality, such as the Nordic countries.2 As research is moving from describing the nature of this relationship towards understanding the mechanisms explaining the observed variations,3 adolescence as a key period for lifestyle establishment is receiving renewed interest. Several studies have focused on documenting socioeconomic variations in health behaviour during adolescence.4–13 However, based on several studies attempting to demonstrate a relationship between socioeconomic status and health, West concluded that adolescence is a period marked more by social equality than by inequality.14
Social inequality in adolescent health may be difficult to discern for several reasons. For one, adolescence is one of the healthiest periods in life. There will inevitably be little variation in health status as an outcome measure in this age group, thus making explanation a difficult task. Consequently, health behaviour may be a more relevant outcome. Studies of the relationship between socioeconomic status and health behaviour should preferably extend beyond the peak adolescent period into young adulthood and entry into the labour market, as this represents a crucial life phase.15 Longitudinal studies covering the transition from adolescence through to adulthood have documented how risk factors for adult ill health accumulate in a socially biased way over the years.16
Another explanation for the lack of social gradients in adolescent health focuses on the dynamic and developmental nature of adolescence and the specific challenges posed by this for longitudinal research. Do measures obtained at one time reflect the same underlying processes as those obtained at other stages of life?17 Developing dynamic approaches to variable operationalisation and measurement during periods of change is an important challenge.
Finally, the lack of observed inequality in youth may be due to the application of an occupationally based measure of socioeconomic status.8 Thus, not only adolescents, but also other people outside paid employment are excluded from classification.18 Previous studies have indicated that educational aspirations as reported by the adolescents themselves may be a valid proxy of their socioeconomic status, as it is both stable (especially for those planning higher education with a focus on general subjects) from an early age, and strongly related to parents' educational status.19,20 Koivusilta and colleagues have further substantiated the close relationship between adolescents' choice of educational tracks and their health behaviour, by documenting how these two factors influence each other during adolescence to produce the link between adult health and social status.6,21 Thus, educational choice may be investigated both as a dependent and an independent variable in studies of adolescent health behaviour.
In this paper, our aim is to investigate health behaviours measured as single variables and as composite indices of health behaviour patterns, and their relationship to different proxies of socioeconomic status: parental education and occupation, and adolescents' educational aspirations. The relationships are investigated cross-sectionally at ages 13, 15, 18 and 21, as well as longitudinally in terms of changes in health behaviour patterns from age 13 to 21.
Methods
The data presented stem from the Norwegian Longitudinal Health Behaviour Study (NLHB). The NLHB-study is a 10-year prospective cohort study of health behaviour and lifestyle patterns among Norwegian adolescents from age 13 (at baseline in 1990) to 23, and their parents. Inclusion in the study was based on informed consent from the adolescents and their parents/guardians. Questionnaires were distributed at subjects' schools during regular hours during the first years of the study (age 13–15), and later distributed by mail to the respondents' home addresses. The baseline sample included a representative sample of 924 7th grade pupils (mean age = 13.3 years, S.D. = 0.3) (77% of 1195 eligible pupils) from 22 randomly selected schools in the county of Hordaland, Norway. A more detailed account of the sampling procedures and data collection methods in the NLHB-study is presented elsewhere.22 This paper presents adolescent data from 1990 (n = 924), 1992 (n = 968), 1995 (n = 778), and 1998 (n = 585) (that is, at ages 13, 15, 18 and 21). Parents were asked to complete brief postal questionnaires in 1990 (number of participants: 648 mothers and 735 fathers), 1993 (not included in this paper) and 1996 (number of participants: 605 mothers and 557 fathers). Parental data from 1990 (occupation) and 1996 (education, as this was only measured this year) are included in this paper.
Measures included are:
Educational aspirations (1990 and 1992) measured by the question ‘What do you think you will be doing after (lower) secondary school’? (the original five response categories were recoded into ‘don't know’ (1),‘vocational studies’ (2) and ‘general studies’ (3). At the time of the study, Norway had 9 years' mandatory (elementary) school, starting at age 7, ending at age 15. Thereafter students could choose to leave school, or go on to upper secondary school with either vocational areas of study (1–3 years) or general subjects (3 years, preparing for college/university).
Mother's/father's occupation was based on parental reports of their occupation, and collapsed into four categories: workers (skilled and unskilled), lower white-collar workers, upper white-collar workers and others (including farmers, fishers, retired persons, students, etc.).
Mother's/father's education was categorised into ‘basic’ (no formal education beyond mandatory schooling), ‘intermediate’ (1–3 years in upper secondary school) and ‘higher’ (college or university training).
Health-related behaviour was operationalised by variables related to: smoking, alcohol and drug use, sexual behaviour, tanning without sun protection, not using seat belts when driving, not using helmet when biking, drunk-driving, physical activity, consumption of fruit, vegetables, sweets and soft drinks. For each year, two sum scores were computed from the single health behaviour variables, one measuring health-enhancing or -maintaining behaviours, the other measuring health-compromising behaviours, for adolescents at that age. Some of the health behaviours are regarded as relevant indicators at all ages (e.g. smoking as health compromising, and fruit and vegetable consumption as health enhancing), while others are modified to grasp the normative progression taking place (having had sex may be a health compromising behaviour at age 13, but not at age 21). Due to this procedure, the health behaviour indices vary in content and/or categorisation over the years. Higher sumscores indicate more health-enhancing/compromising behaviour. As the indices are formative (i.e. not assumed to reflect an underlying theoretical construct, as are reflexive indices), measures of internal consistency are not computed as such claims should not be made.23
Statistical analyses
Behavioural differences between groups were investigated by chi-square or t-tests or one-way analyses of variance (ANOVA). Multivariate linear regression was used in order to investigate the socioeconomic variables' influence on change in health behaviour between age 13 and age 21. Due to differing content of the health behaviour indices at these two points in time, z-scores were calculated before the changescores were computed. All analyses are performed using SPSS 10.1.
Results
Analyses of attrition
Previous analyses have indicated that the baseline non-responders (n = 263) do not differ significantly from the baseline participants, supporting the conclusion that the participants at baseline may be considered representative of the 1977 birth cohort in the region.20
For the present paper, two separate cohorts were established for the attrition analyses: 1990–1992 and 1992–1995. The first analysis compared 1990–1992 cohort participants to those participating in 1990 only according to mother's/father's occupation and education and adolescent's own educational aspirations. No significant differences between cohort participants (n = 860) and dropouts (n = 64) were observed. However, those responding both in 1992 and in 1995 (n = 668) differed significantly from those dropping out in 1995 (n = 300) in terms of mother's education (mean = 2.3 versus 2.1, P = 0.006), father's education (mean = 2.4 versus 2.2, P = 0.007), father's occupation (mean = 2.5 versus 2.1, P = 0.002), and own educational aspirations in 1992 (mean = 2.6 versus 2.3, P < 0.001). This implies that our sample from age 15 becomes increasingly skewed in the direction of fewer respondents with a working class background. The results must be interpreted with this in mind.
Descriptive statistics for the sample by gender at baseline are presented in Appendix 1.
A considerable number of cross tabulations were computed in order to investigate the relationship between single forms of health behaviour and the different indicators of the adolescents' socioeconomic status. Fruit and vegetable consumption turned out as the single health behaviour variable most consistently related to parental status, as evidenced by significant relationships with both father's occupation and parental education. Adolescents' educational aspirations indicated relationships in the direction of more health-enhancing and less health-compromising behaviour among those planning higher education. Apart from these specific findings, however, few of the cross tabulations reached significance. Further analyses with health behaviour measured as single variables were thus abandoned.
Figure 1 presents differences in mean scores on the indices of health-compromising (HC) and health-enhancing (HE) behaviour, based on adolescents' educational aspirations at age 15. Differences between groups were statistically significant at all ages, with the exception of health-compromising behaviour at age 21.
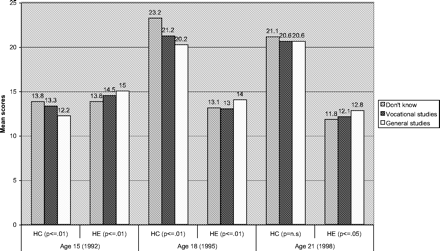
Health behaviour patterns at ages 15, 18, and 21 by educational aspirations at age 15
When investigating health behaviour by the composite measures of HE and HC, the results indicated more health-enhancing behaviour with increasing parental status, and a weaker tendency towards more health-compromising behaviour among adolescents' with low-socioeconomic status parents (not shown). These results seem to confirm the findings of the social gradient presented in figure 1.
Finally, the relationship between health-enhancing behaviour and socioeconomic status was further supported by the findings from the multivariate linear regression analyses.
As seen in table 1, 47% of the variance in changes in girls' health-enhancing behaviour from age 13 to age 21 is accounted for by their educational plans at age 13 and their father's occupation, in addition to their health-enhancing behaviour at age 13. Among boys, behaviour changes are only predicted by their previous behaviour, not by any of the socioeconomic variables.
Multiple regressions of changes in health compromising (HC) and health enhancing (HE) behaviour from age 13 to age 21, by gender
| Independent variables | Boys | Girls | ||||||||||||
|---|---|---|---|---|---|---|---|---|---|---|---|---|---|---|
| HC | HE | HC | HE | |||||||||||
| Beta | Adj. R2 | Beta | Adj. R2 | Beta | Adj. R2 | Beta | Adj. R2 | |||||||
| Previous behavioura | −0.64** | −0.50** | −0.38** | −0.70** | ||||||||||
| Educational plans age 13 | 0.08 | 0.05 | 0.03 | 0.20* | ||||||||||
| Father's occupation | 0.03 | 0.12 | −0.15 | 0.30** | ||||||||||
| Mother's occupation | −0.08 | −0.15 | 0.11 | −0.08 | ||||||||||
| Father's education | 0.04 | 0.10 | 0.03 | −0.13 | ||||||||||
| Mother's education | 0.02 | −0.07 | 0.03 | 0.06 | ||||||||||
| 0.36 | 0.25 | 0.12 | 0.47 | |||||||||||
a: Health compromising behaviour at age 13 in the model predicting change in HC, and health enhancing behaviour at age 13 in the model predicting HE
P < 0.001;
P < 0.05
Discussion
The results showed relatively few significant relationships between single forms of health behaviour and educational aspirations. Consumption of fruit/vegetables was the (single) health behaviour most consistently related to parental status. However, our results indicated a clear social gradient when using composite measures of health behaviour (as seen in figure 1), in terms of less health-compromising and more health-enhancing behaviour among those planning theoretical studies. Using composite measures of health behaviour also proved the best approach to investigating socioeconomic differences in health behaviour over time, as changes in health-enhancing behaviour from age 13 to age 21 was predicted by father's occupation and adolescents' own educational aspirations, but only among girls. Similar relationships were not observed for health-compromising behaviours. Based on these findings, we recommend the use of composite measures of health behaviour when investigating social inequality in youth health (behaviour), but anticipate future studies into the stability of this finding.
Comparing the three measures applied in the present study as potential proxies of socioeconomic status, our results support the use of both educational aspirations, parental education and occupation as applicable indicators to discover social gradients in adolescents' health behaviour. Further, measures of mother's education and occupation appear less strongly related to adolescents' health behaviour than are measures of fathers' occupation and education. Thus, investigating potential differential relationships between the single indicators and health outcomes (be it health status or composite measures of health behaviour) is recommended. This is further substantiated by the findings of Wohlfart and Van den Brink in their study of socioeconomic inequality in substance use disorders.24 Their thorough discussion of conceptual differences between socioeconomic status (as the traditional combination of education, occupation and income data) and social class may be relevant to studies focusing on social inequality in health behaviour as well.
Our findings indicated gender differences regarding which of the parents exerts influence on adolescents' health behaviour, and may thereby contribute to the understanding of the mechanisms at work in the relationship between socioeconomic status and health or health behaviour. The relationship between parental occupation and adolescents' health behaviour seemed to be a gendered relationship, though not based on traditional notions of role-modelling. This emphasises the importance of considering mother's and father's influence separately, as joint measures of parental status would conceal these relationships. Further investigations into these issues are one of the important areas for future studies in this field. This is also supported by the Vuille and Schenkel study,25 where inequality in adolescents' health seems to be more a question of gender and school-related differences than traditional social gradients based on socioeconomic status.
Although confirming a social gradient in adolescent health-related behaviour, the differences observed between educational groups were generally small. Future studies should emphasise efforts to refine the measures and methods applied, and focus on developing measures of socioeconomic status specifically designed for adolescent respondents. One promising approach is the application of self-report measures of subjective social status as an alternative to the traditional objective composite measure of education, occupation and income.26 The studies using this approach have demonstrated stronger relationships between subjective social status and both psychological functioning and physical health, than have traditional objective measures.26,27
Longitudinal studies provide unique opportunities to study development over time. However, the results presented in this paper should also be discussed in relation to some of the problems confronting longitudinal research. One such problem is represented by attrition from the study. As indicated, our sample was increasingly skewed towards fewer working class respondents over the years of the study. As several of the behaviours we examined are assumed to be more prevalent among working class respondents, this skewing may lead to underestimation of differences between socioeconomic groups. The results should therefore be interpreted with caution. As described by Roberts and Bengtson,17 another challenge in longitudinal research relates to whether measures obtained at one point in time represent the same as those obtained at other times, when the respondents find themselves in other stages of life. To alleviate this, we have chosen to apply dynamic measures of behaviour, which are changed according to the behavioural development taking place during the age-period studied. Thus, several of the behaviours included in this paper are not health compromising per se, but are considered so if engaged in at an early age. In addition to the (legal) age restrictions set up for smoking, drinking and sexual intercourse, some behaviours are also seen to follow a sequence of development considered normative. When we consider heavy/intimate petting as an indicator of unsafe sex at age 13 this is based on the fact that most adolescents move from dating to kissing to light and heavy/intimate petting, to having intercourse, through a typically slow, experimental and cumulative process.22 Those adolescents having engaged in heavy petting at age 13 have either moved very fast through these stages or are in discord with this development. We have chosen to use the terms ‘health compromising’ and ‘health enhancing’ behaviours, without considering the underlying motivation for engaging in the behaviour. This is done for pragmatic reasons, and should not be considered as refuting the complex causes underlying these behaviours.
According to Blum et al.28 investigating differences between socioeconomic groups tends to present negative descriptions of the less fortunate group, while not contributing much to the understanding of explanatory mechanisms behind the observed relationships. Instead of adding to such negative descriptions, our results may rather be interpreted as emphasising the need to intensify the effort to increase positive health behaviours in all social groups. The need to broaden interventions among adolescents to include efforts to strengthen health protective factors have also been advocated by Jessor et al. in their study of proximal and distal protective factors in adolescent health behaviour.29 Mechanisms in terms of which psychological factors in adolescents' lives are influenced by their parents' socioeconomic status, and whether these factors are more readily influenced during some phases of child and adolescent development than others, should be investigated. Such analyses might be greatly informed by the rich sociological research tradition on social reproduction30 and social mobility.31 One way of making this research applicable to health inequality research among adolescents might be through focusing on the health selection model,13,32 as the selection processes leading to differences in adult health status are likely to have a major impact during adolescence. Karvonen et al. concluded from their studies of adolescents' health behaviour that mobility is an important issue for the explanation of differences between social groups, and that achieved social position is a better indicator of socioeconomic status than social class of origin.15
In addition to the measurement and theoretical issues discussed above, several practical implications may follow from our results. One area which seems particularly well suited for interventions to improve health behaviour and also alleviate social inequality is fruit and vegetable consumption. Our results indicate a relationship between lower parental education and eating fruit and vegetables twice or less a week (which is very low compared to the national recommendations of at least five units of fruit/vegetables a day). Several studies have documented how fruit and vegetable consumption contributes to decreased risk of cardiovascular disease and certain kinds of cancer,33,34 thereby emphasising the potential health benefits of increasing consumption. Although closely related in terms of health effects, fruit and vegetable consumption are weakly correlated, and should thus preferably be addressed separately in interventions.7 Interventions aimed at young school-age populations may be especially useful, and may also contribute to alleviating the existing social inequality in this health-related behaviour.
The Norwegian Longitudinal Health Behaviour Study is administered by the Research Center for Health Promotion, University of Bergen, Norway. The preparation of the present paper has been made possible by a grant from The Norwegian Research Council to C.F.
Sample characteristics at baseline (1990)a (age 13) (%)
| Sample characteristics | Boys | Girls | (n) | P value | |||
|---|---|---|---|---|---|---|---|
| (n = 511) | (n = 416) | ||||||
| Father's occupation | 0.575 | ||||||
| Manual worker (skilled/unskilled) | 30.9 | 34.8 | (204) | ||||
| Lower white collar | 4.2 | 3.7 | (25) | ||||
| Upper white collar | 58.2 | 53.2 | (351) | ||||
| Others | 6.7 | 8.2 | (46) | ||||
| Mother's occupation | 0.929 | ||||||
| Manual worker (skilled/unskilled) | 7.5 | 8.3 | (54) | ||||
| Lower white collar | 18.7 | 17.6 | (125) | ||||
| Upper white collar | 54.7 | 53.5 | (372) | ||||
| Others | 19.2 | 20.6 | (136) | ||||
| Father's education | 0.731 | ||||||
| Basic | 10.6 | 13.0 | (62) | ||||
| Lower | 39.8 | 30.5 | (188) | ||||
| Higher | 49.6 | 56.5 | (280) | ||||
| Mother's education | 0.731 | ||||||
| Basic | 15.0 | 16.2 | (91) | ||||
| Lower | 38.6 | 40.6 | (231) | ||||
| Higher | 46.4 | 43.2 | (262) | ||||
| Adolescents' educational plans | <0.0001 | ||||||
| Don't know | 12.0 | 11.5 | (104) | ||||
| Vocational studies | 40.0 | 26.3 | (298) | ||||
| General studies | 47.9 | 62.2 | (479) | ||||
| Physical activity (hours per week) | <0.0001 | ||||||
| None | 3.6 | 7.2 | (47) | ||||
| 30 mins | 3.6 | 4.4 | (36) | ||||
| 1 hour | 8.7 | 12.8 | (95) | ||||
| 2–3 hours | 26.9 | 34.1 | (271) | ||||
| 4–6 hours | 32.3 | 33.8 | (297) | ||||
| >7 hours | 24.8 | 7.7 | (154) | ||||
| Drunk/intoxicated in last 6 months | 0.188 | ||||||
| Not at all | 91.9 | 89.9 | (755) | ||||
| Once | 4.2 | 6.1 | (42) | ||||
| 2–4 times | 1.8 | 3.2 | (20) | ||||
| 5–10 times | 1.8 | 0.5 | (10) | ||||
| 11 times or more | 0.4 | 0.3 | (3) | ||||
| Intimate petting | 0.013 | ||||||
| Yes | 7.1 | 3.3 | (828) | ||||
| No | 92.9 | 96.7 | (47) | ||||
| Ever had a boy/girlfriend | 0.172 | ||||||
| Yes | 62.7 | 67.1 | (317) | ||||
| No | 37.3 | 32.9 | (581) | ||||
| Smoking | 0.024 | ||||||
| Weekly | 1.4 | 1.7 | (14) | ||||
| Less than weekly | 8.5 | 5.5 | (63) | ||||
| Not at all | 88.2 | 87.2 | (781) | ||||
| Tried hashish/marihuana | 0.809 | ||||||
| Yes | 0.6 | 0.5 | (5) | ||||
| No | 99.4 | 99.5 | (879) | ||||
| Drunk driving (passenger) | 0.040 | ||||||
| Never | 83.0 | 86.9 | (745) | ||||
| Once | 10.6 | 10.4 | (92) | ||||
| Sometimes | 6.4 | 2.8 | (42) | ||||
| Using (front) seatbelts | 0.064 | ||||||
| Always | 76.6 | 83.3 | (536) | ||||
| Sometimes | 21.1 | 14.2 | (120) | ||||
| Seldom or never | 2.3 | 2.5 | (16) | ||||
| Using bicycle helmet | 0.855 | ||||||
| Always | 8.2 | 8.7 | (56) | ||||
| Sometimes | 15.6 | 17.0 | (108) | ||||
| Seldom or never | 76.2 | 74.4 | (501) | ||||
| Eating fresh fruit | 0.066 | ||||||
| More than once a day | 26.0 | 30.7 | (197) | ||||
| Once a day | 30.6 | 26.1 | (199) | ||||
| 3–6 times a week | 30.8 | 25.5 | (198) | ||||
| 1–2 times a week | 7.8 | 12.9 | (71) | ||||
| Not every week | 4.8 | 4.9 | (34) | ||||
| Eating chocolate/sweets | 0.014 | ||||||
| More than once a day | 4.6 | 5.3 | (34) | ||||
| Once a day | 9.7 | 15.9 | (87) | ||||
| 3–6 times a week | 35.3 | 24.7 | (210) | ||||
| 1–2 times a week | 39.9 | 41.6 | (281) | ||||
| Not every week | 10.5 | 12.5 | (79) | ||||
| Eating vegetables | 0.603 | ||||||
| More than once a day | 13.5 | 14.7 | (98) | ||||
| Once a day | 27.0 | 29.4 | (196) | ||||
| 3–6 times a week | 28.3 | 29.8 | (202) | ||||
| 1–2 times a week | 22.6 | 19.9 | (149) | ||||
| Not every week | 8.6 | 6.1 | (52) | ||||
| Drinking soft drinks | 0.022 | ||||||
| More than once a day | 3.2 | 1.9 | (18) | ||||
| Once a day | 6.2 | 3.7 | (35) | ||||
| 3–6 times a week | 19.4 | 14.8 | (120) | ||||
| 1–2 times a week | 58.5 | 59.6 | (410) | ||||
| Not every week | 12.7 | 20.1 | (112) | ||||
a: The measure of parental education is not part of baseline data, as this was measured in 1996 only.
References
Mackenbach JP, Kunst A, Cavelaars AEJM, Groenhof F, Geurts JJM and the EU working group on Socioeconomic Inequalities in Health. Socioeconomic inequalities in morbidity and mortality in western Europe.
Lahelma E, Lundberg O, Manderbacka K, Roos E. Changing health inequality in the Nordic countries?
Adler NE, Ostrove JM. Socioeconomic status and health: What we know and what we don't. In: Adler NE, Marmot M, McEwen BS, Stewart J, editors. Socioeconomic status and health in industrial nations. New York: New York Academy of Sciences,
Ford G, Ecob R, Hunt K, MacIntyre S, West P. Patterns of class-inequality in health through the life-course – class gradients at 15, 35 and 55 years in the west of Scotland.
Glendinning A, Hendry L, Shucksmith J. Lifestyle, health and social class in adolescence.
Koivusilta LK, Rimpelä AH, Rimpelä MK. Health-related lifestyle in adolescence – origin of social class differences in health?
Lien N, Jacobs DR, Klepp K-I. Exploring predictors of eating behaviours among adolescents and socioeconomic status.
MacIntyre S, West P. Lack of class variation in health in adolescence: An artefact of an occupational measure of social class?
Sweeting H, West P. Family life and health in adolescence: a role for culture in the health inequalities debate?
Tuinstra J, Groothoff JW, van den Heuvel WJ, Post D. Socioeconomic differences in health risk behaviour in adolescence: do they exist?
Tyas SL, Pederson LL. Psychosocial factors related to adolescent smoking: a critical review of the literature.
West P. Inequalities? Social class differentials in health in British youth.
West P. Rethinking the health selection explanation for health inequalities.
West P. Health inequalities in the early years: Is there equalisation in youth?
Karvonen S, Rimpelä AH, Rimpelä MK. Social mobility and health related behaviours in young people.
Power C, Matthews S. Origins of health inequalities in a national population sample.
Roberts REL, Bengtson VL. Assessing familial and nonfamilial sources of parent-child attitude resemblance over two measurement occasions. In: Collins LM, Horn JL, editors, Best methods for the analysis of change. Washington, DC: American Psychological Association,
Currie CE, Elton RA, Todd J, Platt S. Indicators of socioeconomic status for adolescents: the WHO Health Behaviour in School-aged Children Survey.
Friestad C, Lien N, Klepp K-I. Educational plans—when are they established? Implications for the measurement of socioeconomic status in youth.
Lien N, Friestad C, Klepp K-I. Adolescents' proxy reports of parents' socioeconomic status: How valid are they?
Koivusilta LK, Rimpelä AH, Rimpelä MK, Vikat A. Health behaviour-based selection into different educational tracks starts in early adolescence.
Jakobsen R. Stages of progression in noncoital sexual interactions among ypung adolescents: An application of the Mokken Scale Analysis.
Mastekaasa A. Modellbruk, indekser og konsistenskriterier (Models, indices and consistency criteria).
Wohlfart T, Van den Brink W. Social class and substance use disorders: the value of social class as distinct from socioeconomic status.
Vuille JC, Schenkel M. Social equalization in the health of youth. The role of the school.
Goodman E, Adler NE, Kawachi I, Frazier AL, Huang B, Colditz GA. Adolescents' perceptions of social status: Development and evaluation of a new indicator.
Ostrove JM, Adler NE, Kuppermann M, Washington AE. Objective and subjective assessments of socioeconomic status and their relationship to self-rated health in an ethnically diverse sample of pregnant women.
Blum RW, Beuhring T, Shew ML, Bearinger LH, Sieving RE, Resnick MD. The effects of race/ethnicity, income, and family structure on adolescent risk behaviors.
Jessor R, Turbin MS, Costa FM. Protective factors in adolescent health behaviour.
Bourdieu P. Cultural reproduction and social reproduction. In: Karabel J, Halsey AH, editors, Power and ideology in education. New York: Oxford University Press,
Mohr J, DiMaggio P. The intergenerational transmission of cultural capital.
Marmot M, Ryff CD, Bumpass LL, Shipley M, Marks NF. Social inequalities in health: next questions and converging evidence.
Ness AR, Powles JW. Fruit and vegetables, and cardiovascular disease: a review.

Comments