


Abstract
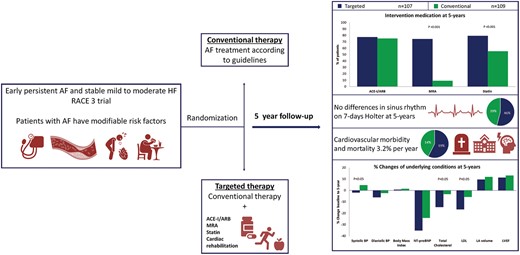
The Routine vs. Aggressive risk factor driven upstream rhythm Control for prevention of Early persistent atrial fibrillation (AF) in heart failure (HF) (RACE 3) trial demonstrated that targeted therapy of underlying conditions improved sinus rhythm maintenance at 1 year. We now explored the effects of targeted therapy on the additional co-primary endpoints; sinus rhythm maintenance and cardiovascular outcome at 5 years.
Patients with early persistent AF and mild-to-moderate stable HF were randomized to targeted or conventional therapy. Both groups received rhythm control therapy according to guidelines. The targeted group additionally received four therapies: angiotensin-converting enzyme inhibitors and/or angiotensin receptor blockers (ARBs), statins, mineralocorticoid receptor antagonists (MRAs), and cardiac rehabilitation. The presence of sinus rhythm and cardiovascular morbidity and mortality at 5-year follow-up were assessed. Two hundred and sixteen patients consented for long-term follow-up, 107 were randomized to targeted and 109 to conventional therapy. At 5 years, MRAs [76 (74%) vs. 10 (9%) patients, P < 0.001] and statins [81 (79%) vs. 59 (55%), P < 0.001] were used more in the targeted than conventional group. Angiotensin-converting enzyme inhibitors/ARBs and physical activity were not different between groups. Sinus rhythm was present in 49 (46%) targeted vs. 43 (39%) conventional group patients at 5 years (odds ratio 1.297, lower limit of 95% confidence interval 0.756, P = 0.346). Cardiovascular mortality and morbidity occurred in 20 (19%) in the targeted and 15 (14%) conventional group patients, P = 0.353.
In patients with early persistent AF and HF superiority of targeted therapy in sinus rhythm maintenance could not be preserved at 5-year follow-up. Cardiovascular outcome was not different between groups.
Clinicaltrials.gov NCT00877643.
In patients with early persistent atrial fibrillation (AF) and heart failure (HF) targeted therapy reduced blood pressure and cholesterol levels.
Superiority of targeted therapy in sinus rhythm maintenance could not be preserved at 5-year follow-up in patients with AF and HF, as was seen at 1 year.
Introduction
Atrial fibrillation (AF) is a progressive disease. Particularly in patients with heart failure (HF), it is associated with cardiovascular morbidity and mortality, especially early after start of AF.1,2 In addition, quality of life is impaired.3 Maintenance of sinus rhythm has been associated with improved prognosis.4,5 Long-term maintenance of sinus rhythm, however, is a challenge, despite the introduction of ablation, especially in persistent AF and HF patients.6,7 This may be one of the reasons why most trials so far could not demonstrate a beneficial effect of a rhythm control strategy on outcome.7 Treatment of risk factors is essential for AF management.8 It improves cardiovascular risk factors and outcome in AF patients and patients with other cardiovascular comorbidities.5,9–11 In addition, it contributes to sinus rhythm maintenance and prevents further deterioration of the atrial substrate that is caused by underlying conditions of AF and by AF itself.12
However, not all studies on risk factor management were superior to conventional treatment. Reduction of blood pressure alone in patients undergoing ablation did not reduce AF recurrence rate.13 Also important to consider, until now most studies were limited to populations with a combination of paroxysmal AF and persistent AF, were not focusing on early AF, and had short follow-up durations.
Therefore, the Routine vs. Aggressive risk factor driven upstream rhythm Control for prevention of Early AF in HF (RACE 3) trial aimed to improve underlying conditions of AF by long-term targeted therapy in order to enhance maintenance of sinus rhythm and reduce cardiovascular morbidity and mortality.14,15 We hypothesize that in patients with early persistent AF and stable mild to moderate HF continuous targeted therapy of underlying conditions over a 5-year period, will improve long-term maintenance of sinus rhythm and reduce cardiovascular morbidity and mortality, in comparison to conventional therapy.
Methods
Study design
The RACE 3 study design has been previously published.14,15 In brief, the RACE 3 is a randomized, prospective multicentre, open-label, blinded endpoint trial (Clinicaltrials.gov identifier NCT00877643). Patients with a short history of symptomatic persistent AF [total AF history <5 years, total persistent AF duration >7 days but <6months, ≤1 electrical cardioversion (ECV)] and mild to moderate stable HF were included. The study has been performed in compliance of the Declaration of Helsinki. The study was approved by The Institutional Review Board of all participating hospitals, and all patients gave written informed consent. Patients were randomized to targeted therapy of underlying conditions or conventional therapy. All patients received treatment according to the AF and HF guidelines and were treated with rhythm control therapy. Patients were scheduled for ECV 3 weeks after inclusion. If AF relapsed, repeat ECV, antiarrhythmic drugs, and atrial ablations were allowed. In addition, the targeted therapy group received four therapies: (i) angiotensin-converting enzyme inhibitors (ACE-Is) and/or angiotensin receptor blocker (ARBs), (ii) statins, (iii) mineralocorticoid receptor antagonists (MRAs), and (iv) cardiac rehabilitation. Angiotensin-converting enzyme inhibitors, ARBs, and MRAs were dosed aiming to achieve the highest tolerated doses. Blood pressure target was below 120/80 mmHg. Cardiac rehabilitation included supervised physical activity for 9–11 weeks, dietary restrictions, and counselling by a nurse on drug adherence and exercise maintenance, once every 6 weeks, starting 1 week after inclusion. Self-reported physical activity was only assessed for the targeted group during nurse visits during the first year of follow-up. During the first year, all patients had outpatient clinic visits at 1, 3, 6, 9, and 12 months after the first study ECV (Supplementary material online, Figure S1). After 1 year, patients were asked for consent for long-term follow-up. A total of 216 of 245 patients gave consent for long-term follow-up. The follow-up protocol was decided early on, but after start of the study. Follow-up visits, including counselling, were deliberately reduced (Supplementary material online, Figure S2). Patients participating in the long-term follow-up randomized to conventional therapy had outpatient clinic visits once a year. Patients in the targeted group had outpatient clinical visits every 6 months, alternating with telephonic counselling by a nurse every other 6 months (Figure 1, Supplementary material online, Figure S2). During every outpatient clinic visit, self-reported physical activity was assessed for both groups. For the targeted therapy group, self-reported physical activity was additionally assessed during telephonic counselling by a nurse. Total follow-up duration was 5 years.
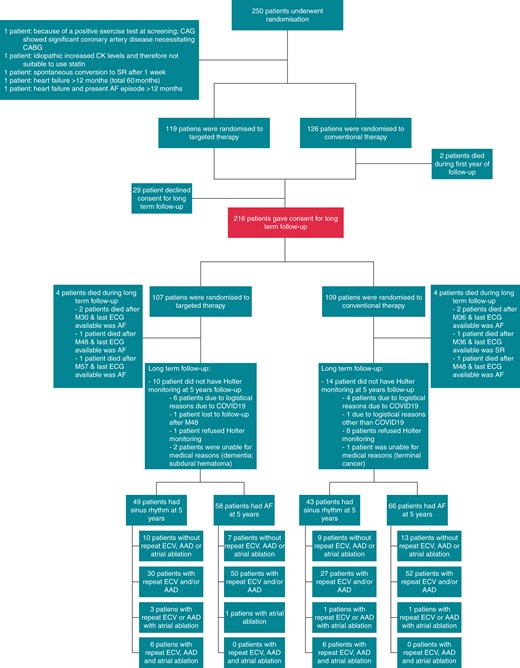
Trial profile. Two hundred and forty-five of the 250 randomized patients were included in the 1-year follow-up analysis. For the 5-year follow-up, 216 gave consent. AAD, antiarrhythmic drugs; AF, atrial fibrillation; CABG, coronary artery bypass grafting; CAD, coronary artery disease; CAG, coronary angiogram; COVID19, coronavirus disease 2019; ECG, electrocardiography; ECV, electrical cardioversion; SR, sinus rhythm.
Co-primary endpoints
The first co-primary endpoint of this analysis was the presence of sinus rhythm, defined as sinus rhythm during at least six-seventh of assessable time, at the 7-day Holter monitoring at 5 years. If the 5-year Holter was not available, we used the best available clinical information for rhythm status as a proxy for the determination of this co-primary endpoint status. If the patient had died, the clinical and AF status before death were assessed.
The second co-primary endpoint was the composite of death from cardiovascular causes and cardiovascular morbidity including hospitalization for HF, stroke, systemic embolism, myocardial infarction, percutaneous coronary intervention, coronary artery bypass graft, bleeding, life-threatening arrhythmic events, pacemaker, implantable cardioverter-defibrillator, or cardiac resynchronization therapy defibrillator.
Additionally, analyses were done for changes in blood pressure, body mass index (BMI), N-terminal pro-brain natriuretic peptide (NT-proBNP), cholesterol levels, sodium levels in 24-h urine collection, left atrial volume, and left ventricular function at 5-year follow-up. Atrial fibrillation burden on 7-day Holter monitoring at 5 years was also assessed. Atrial fibrillation burden was defined as time in AF on 7-day Holter monitoring divided by actual duration of Holter monitoring, calculated in percentage.
An endpoint review committee, unaware of the treatment-group assignments, adjudicated safety and cardiovascular morbidity and mortality. All 7-day Holters were analysed for the presence of sinus rhythm (primary endpoint) at a central core lab blinded for therapy.
Statistical analysis
The trial was designed to determine whether targeted therapy is of added value to conventional therapy for sinus rhythm maintenance in patients with early persistent AF and HF. Analyses were predefined. Baseline characteristics are presented as mean ± standard deviation for normally distributed data, as median and interquartile range for non-normally distributed continuous data, and as number of patients and percentage for categorical data. The primary analysis for efficacy consisted of a comparison of the occurrence of the primary endpoint between the targeted and the conventional group by calculating the odds ratio (OR), with corresponding confidence limits according to the Miettinen–Nurminen method. The null-hypothesis of no treatment benefit was rejected if the lower limit of the 95% confidence interval (95% CI) exceeded one, which is equivalent to two-sided testing at an alpha level of 0.05. Analyses were conducted with R [version 3.3.3 (www.r-project.org)] and SPSS version 23 or higher.
Results
Two hundred and sixteen of 245 patients consented to long-term follow-up (Figure 1), 107 randomized to targeted and 109 to conventional therapy. Baseline characteristics between the targeted vs. convention group were comparable, with exception of verapamil use [2 (2%) vs. 10 (9%), P = 0.034] and left ventricular end-diastolic diameter indexed [24.5 (21.9–26.3) vs. 25.3 (22.0–27.2), P = 0.047], respectively (Table 1). Hypertension was present in 130 (60%) patients, mean CHA2DS2-VASc was 2 (1–3).
Baseline characteristics—targeted therapy vs. conventional therapy
| Characteristic | Total population (n = 216) | Targeted therapy (n = 107) | Conventional therapy (n = 109) |
|---|---|---|---|
| Age (years) | 64.8 ± 8.3 | 64.4 ± 8.4 | 65.2 ± 8.2 |
| Male sex, no. (%) | 171 (79%) | 85 (79%) | 86 (79%) |
| Total duration AF (months) | 3.2 (1.9–5.5) | 3.6 (1.9–6.9) | 3.0 (1.9–4.8) |
| Total persistent AF (months) | 2.3 (1.4–4.0) | 2.2 (1.4–3.7) | 2.5 (1.4–4.0) |
| Previous ECV, no. (%) | 195 (91%) | 95 (90%) | 100 (92%) |
| Duration of HF (months) | 2.0 (1.0–4.0) | 2.0 (1.0–4.0) | 2.0 (1.0–3.5) |
| Hospital admission for HF, no. (%) | 25 (12%) | 12 (11%) | 13 (12%) |
| LVEF <45%, no. (%) | 61 (28%) | 32 (30%) | 29 (27%) |
| LVEF ≥45%, no. (%) | 155 (72%) | 75 (70%) | 80 (73%) |
| Hypertension, no. (%) | 130 (60%) | 59 (55%) | 71 (65%) |
| Diabetes, no. (%) | 19 (9%) | 8 (7%) | 11 (10%) |
| Coronary artery disease, no. (%) | 27 (12%) | 15 (14%) | 12 (11%) |
| Valvular disease, no. (%) | 19 (9%) | 9 (8%) | 10 (9%) |
| Cardiomyopathy, no. (%) | 12 (6%) | 7 (7%) | 5 (5%) |
| Ischaemic thromboembolic complication, no. (%) | 9 (4%) | 5 (5%) | 4 (4%) |
| Chronic obstructive pulmonary disease, no. (%) | 17 (8%) | 8 (7%) | 9 (8%) |
| CHA2DS2-VASc scorea | 2.0 (1.0–3.0) | 2.0 (1.0–3.0) | 2.0 (1.0–3.0) |
| Symptoms, no. (%) | |||
| Palpitations | 93 (43%) | 43 (40%) | 50 (46%) |
| Dyspnoea | 171 (79%) | 85 (79%) | 86 (79%) |
| Fatigue | 132 (61%) | 68 (64%) | 64 (59%) |
| EHRA class | 2.0 (2.0–2.0) | 2.0 (2.0–2.0) | 2.0 (2.0–2.0) |
| Length (cm) | 179 ± 8 | 180 ± 8 | 178 ± 8 |
| Weight (kg) | 91 ± 14 | 93 ± 13 | 90 ± 14 |
| Body mass index (kg/m2) | 28 (26–31) | 28.6 (26–31) | 27.9 (25–31) |
| Blood pressure (mmHg) | |||
| Systolic | 129 ± 15 | 131 ± 16 | 128 ± 14 |
| Diastolic | 83 (77.–90) | 85.0 (76–90) | 82.0 (78–90) |
| Heart rate at rest (beats/min) | 87 (77–96) | 85.0 (76–93) | 89.0 (78–99) |
| New York Heart Association functional class, no. (%) | |||
| I | 45 (21%) | 22 (21%) | 23 (21%) |
| II | 148 (69%) | 74 (69%) | 74 (68%) |
| III | 23 (11%) | 11 (10%) | 12 (11%) |
| Potassium (mmol/L) | 4.3 ± 0.4 | 4.3 ± 0.4 | 4.3 ± 0.4 |
| NT-proBNP (ng/L) | 1045 (695–1556) | 1057 (695–1542) | 1005 (703–1611) |
| Total cholesterol (mmol/L) | 5.0 ± 1.2 | 5.0 ± 1.1 | 5.0 ± 1.2 |
| LDL cholesterol (mmol/L) | 3.1 ± 1.0 | 3.0 ± 1.0 | 3.1 ± 1.0 |
| HDL cholesterol (mmol/L) | 1.2 (1.0–1.4) | 1.2 (1.1–1.4) | 1.2 (1.0–1.4) |
| Triglycerides (mmol/L) | 1.7 (1.1–2.2) | 1.8 (1.2–2.3) | 1.5 (1.1–2.1) |
| Glucose (mmol/L) | 5.8 (5.3–6.5) | 5.8 (5.3–6.5) | 5.8 (5.2–6.5) |
| HbA1c (%) | 5.9 (5.6–6.2) | 5.9 (5.6–6.1) | 5.8 (5.6–6.3) |
| Medication in use, no. (%) | |||
| Beta-blocker | 189 (88%) | 92 (86%) | 97 (89%) |
| Verapamil/diltiazem | 12 (6%) | 2 (2%) | 10 (9%) |
| Digoxin | 51 (24%) | 27 (25%) | 24 (22%) |
| ACE-inhibitor | 75 (35%) | 33 (31%) | 42 (39%) |
| Angiotensin receptor blocker | 48 (22%) | 23 (21%) | 25 (23%) |
| Mineralocorticoid receptor antagonist | 3 (1%) | 1 (1%) | 2 (2%) |
| Statin | 72 (33%) | 34 (32%) | 38 (35%) |
| Diuretic | 86 (40%) | 44 (41%) | 42 (39%) |
| Anticoagulant | 213 (99%) | 105 (98%) | 108 (99%) |
| Antiplatelet | 14 (6%) | 9 (8%) | 5 (5%) |
| Echocardiographic variables | |||
| Left atrial size, long axis (mm) | 43 (40–47) | 43 (40–48) | 44 (40–47) |
| Left atrial volume (mL) | 81 (65–98) | 82 (65–99) | 79 (65–96) |
| Left atrial volume indexed (mL/m2) | 38 (31–48) | 38 (31–48) | 38 (32–48) |
| Left ventricular end-diastolic diameter (mm) | 52 ± 6 | 51 ± 6 | 52 ± 6. |
| Left ventricular end-diastolic diameter index (mm/m2) | 25 (22–27) | 25 (22–26) | 25 (23–27) |
| Left ventricular end-systolic diameter (mm) | 37 ± 8 | 37 ± 8 | 38 ± 8 |
| Left ventricular end-systolic diameter index (mm/m2) | 18 (15–20) | 17 (15–20) | 18 (15–20) |
| Left ventricular ejection fraction (%) | 53 (43–60) | 53 (43–58) | 52 (43–60) |
| Exercise test | |||
| Maximum load (W) | 132 (105–160) | 134 (106–163) | 131 (100–160) |
| Maximum heart rate (beats/min) | 163 ± 28 | 162 ± 30 | 164 ± 27 |
| 24 h urine excretion | |||
| Sodium (mmol/24 h) | 161.0 (121.0–209.0) | 160.0 (120.0–203.0) | 163.0 (122.5–214.5) |
| Potassium (mmol/24 h) | 75.0 (57.0–90.1) | 74.8 (55.8–90.2) | 75.0 (59.5–88.6) |
| Creatinine (mmol/24 h) | 13.4 (10.5–15.8) | 13.0 (10.9–15.6) | 13.4 (10.0–15.8) |
Data are presented as mean (SD), number of patients (%), or median (IQR).
ACE, angiotensin-converting enzyme; AF, atrial fibrillation; ECV, electrical cardioversion; EHRA, European Heart Rhythm Association class for symptoms; HbA1c, haemoglobin A1c; HDL, high-density lipoprotein; HF, heart failure; LDL, low-density lipoprotein; LVEF, left ventricular ejection fraction; NT-proBNP, N-terminal pro-brain natriuretic peptide.
The CHA2DS2-VASc score assesses thromboembolic risk. C = congestive heart failure/LV dysfunction, H = hypertension; A2 = age ≥75 years; D = diabetes mellitus; S2 = stroke/transient ischaemic attack/systemic embolism; V = vascular disease; A = age 65–74 years; Sc = sex category (female sex).
Targeted therapies applied during 5-year follow-up show a difference in MRA use [76 (74%) vs. 10 (9%) patients; P < 0.001] and statin use [81 (79%) vs. 59 (55%) patients; P < 0.001] (Table 2, Figure 2). Supervised cardiac rehabilitation in first year of follow-up was completed by 110 (92%) targeted therapy patients. Self-reported physical activity at 5-year follow-up was comparable between the groups (Table 2). The number of patients receiving any antiarrhythmic drug [25 (23%) vs. 17 (16%), P = 0.169], sotalol [7 (7%) vs. 3 (3%), P = 0.212], flecainide [8 (8%) vs. 4 (4%), P = 0.249], amiodarone [10 (10%) vs. 10 (10%), P = 1.000], number of repeat ECV [180 vs. 151, P = 0.106], and number of pulmonary vein isolation [12 vs. 13, P = 0.531] were comparable between the targeted and conventional therapy group, respectively (Figure 1, Supplementary material online, Table S1).
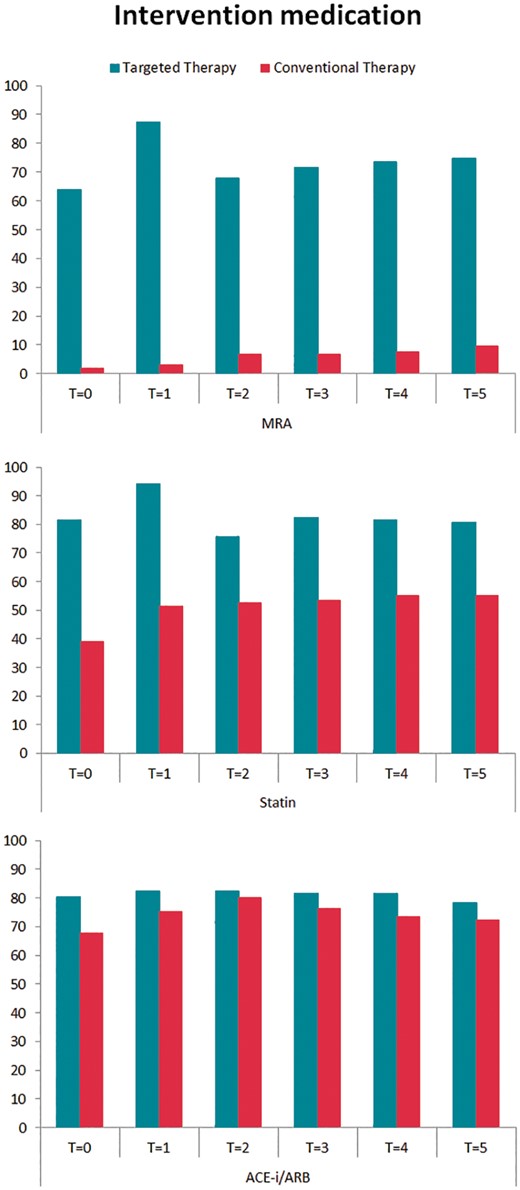
Intervention medication during 5-year follow-up. Targeted therapy medication use presented in percentages for both randomized groups during 5-year follow-up. ACE-I, angiotensin-converting enzyme inhibitors; ARB, angiotensin receptor blockers; MRA, mineralocorticoid receptor antagonists; T = 0, after randomization; T = 1, 1-year follow-up; T = 2, 2-year follow-up; T = 3, 3-year follow-up; T = 4, 4-year follow-up; T = 5, 5-year follow-up.
Treatment at 5-year follow-up
| Total population (N = 207)a | Targeted therapy (N = 102) | Conventional therapy (N = 105) | P-value | |
|---|---|---|---|---|
| MRA | 86 (42%) | 76 (75%) | 10 (9%) | <0.001 |
| Spironolactone (mg) | 25 (12–50) | 38 (25–50) | 12 (12–25) | 0.130 |
| Eplerenon (mg) | 50 (25–50) | 50 (25–50) | 25 (25–25) | 0.062 |
| Statin | 140 (68%) | 82 (80%) | 58 (55%) | <0.001 |
| Simvastatin (mg) | 40 (20–40) | 40 (20–40) | 40 (40–40) | 0.724 |
| Rosuvastatin (mg) | 10 (8–10) | 10 (5–10) | 10 (10–10) | 0.095 |
| ACE-inhibitor and/or ARB | 159 (76%) | 80 (78%) | 79 (75%) | 0.624 |
| Enalapril (mg) | 20 (9–20) | 12 (5–20) | 20 (18–20) | 0.405 |
| Perindopril (mg) | 4 (2–8) | 3 (2–6) | 4 (4–8) | 0.062 |
| Losartan (mg) | 75 (50–100) | 50 (50–100) | 100 (50–100) | 0.384 |
| Telmisartan (mg) | 40 (40–80) | 40 (30–80) | 80 (40–80) | 0.408 |
| Physical activity during follow-up | 146 (71%) | 73 (72%) | 73 (70%) | 0.763 |
| Duration >150 min/weekb | 118 (57%) | 58 (57%) | 60 (57%) | 1.000 |
Data are presented as number of patients (%) or median (IQR).
ACE, angiotensin-converting enzyme; ARB, angiotensin receptor blocker; MRA, mineralocorticoid receptor antagonist.
Data are excluding eight patients that died during LTF and one patient lost to follow-up.
International physical activity norm.
At 5-year follow-up, sinus rhythm was present in 49 of 107 patients (46%) in the targeted vs. 43 of 109 patients (39%) in the conventional therapy group (OR 1.297, with lower limit of 95% CI 0.756, two-sided P = 0.346) (Graphical Abstract). In a secondary analysis, we limited the analysis to patients with available 5-year Holter monitoring and found sinus rhythm in 41 of 85 patients (48%) in the targeted vs. 35 of 74 patients (47%) in the conventional group (OR 1.038, with lower limit of 95% CI 0.557, two-sided P = 0.906) (Supplementary material online, Table S2). Of the patients that completed the 5-year follow-up, 82 (80%) patients of the targeted and 69 (66%) patients of the conventional group had sinus rhythm at 1-year follow-up (Supplementary material online, Table S3). Maintenance of sinus rhythm decreased after 1 year and was comparable between the groups throughout the rest of follow-up (Supplementary material online, Table S3). No difference was seen in AF burden between the groups at 5 years (Supplementary material online, Table S4).
The composite of cardiovascular mortality and morbidity occurred in a total of 35 patients (16%, 3.2% per year) and was not different between the groups [20 (19%) patients in the targeted and 15 (14%) in the conventional group, P = 0.353] (Figure 3, Table 3). Total follow-up of 5 years was completed by 207 patients. Death from any cause occurred in eight patients, four patients in each group, and one was lost to follow-up after 4 years (Supplementary material online, Table S5).
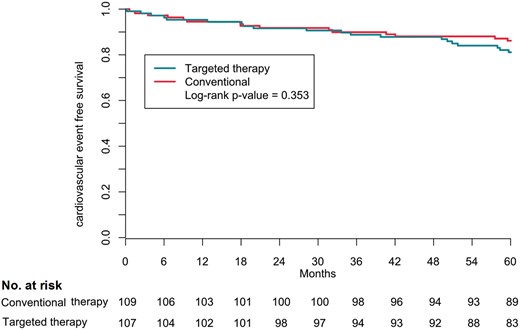
Kaplan–Meier composite outcome according to randomization group. The secondary outcome was the composite of cardiovascular morbidity and mortality.
Composite primary outcome and its components during the 5-year follow-up
| Targeted therapy (N = 107) | Conventional therapy (N = 109) | P-value | |
|---|---|---|---|
| Composite outcomea | 20 (19%) | 15 (14%) | 0.353 |
| Individual componentsb | |||
| Cardiovascular death | 3 | 1 | |
| Arrhythmic | 1 | 0 | |
| Non-arrhythmic | 1 | 0 | |
| Stroke | 1 | 1 | |
| Hospital admission for heart failure | 3c | 3 | |
| Stroke | 3 | 2 | |
| Ischaemic stroke (1 fatal) | 3 | 0 | |
| Haemorrhagic (1 fatal) | 0 | 2 | |
| Systemic embolism | 1 | 1 | |
| Myocardial infarction | 5d | 3 | |
| Percutaneous coronary intervention | 3 | 3 | |
| Coronary artery bypass graft | 2 | 2 | |
| Bleeding | 7e | 3 | |
| Life-threatening arrhythmic events | 1 | 0 | |
| Pacemaker | 3 | 2 | |
| Implantable cardioverter-defibrillator | 1 | 0 | |
| Cardiac resynchronization therapy defibrillator | 0 | 0 |
Data are presented as number of patients (%).
Time to first cardiovascular event according to the RACE 3 protocol definition: Composite of death from cardiovascular causes and cardiovascular morbidity including hospitalization for heart failure, stroke, systemic embolism, myocardial infarction, percutaneous coronary intervention, coronary artery bypass graft, bleeding, life-threatening arrhythmic events, pacemaker, implantable cardioverter defibrillator or cardiac resynchronization therapy defibrillator.
Individual components can contain multiple cardiovascular events per patient. However, if 1 patient has a certain cardiovascular event multiple times (for example multiple hospitalizations for heart failure) only 1 event is presented in this table.
Total amount of heart failure hospitalization was 12 in 3 patients; 1 patient had 7 hospitalizations, 1 had 3, and 1 had 2.
Total amount of myocardial infarctions was 9 in 8 patients; 1 patient had 2 myocardial infarctions.
Total amount of bleedings was 13 in 10 patients; 1 patient had 3 bleedings, 1 patient had 2.
Both groups had significant improvements of blood pressure, NT-proBNP, cholesterol levels, and left ventricular ejection fraction at 5 years (Table 4). The targeted group improved significantly more in systolic blood pressure, total cholesterol, and LDL cholesterol compared to the conventional group (Table 4).
Changes at 5-year follow-up
| Characteristic | Targeted therapy (N = 102) | Conventional therapy (N = 105) | Δ Targeted therapy (baseline vs. 5 years) % | Δ Conventional therapy (baseline vs. 5 years) % | P-value targeted therapy baseline vs. 5 years | P-value conventional treatment baseline vs. 5 years | P-value Δ targeted vs. conventional |
|---|---|---|---|---|---|---|---|
| Systolic blood pressure (mmHg) | |||||||
| Baseline | 130.9 ± 15.3 | 128.3 ± 14.4 | −1.80% | 4.68% | 0.062 | 0.008 | 0.003 |
| 5 years | 126.4 ± 14.9 | 133.3 ± 16.3 | |||||
| Diastolic blood pressure (mmHg) | |||||||
| Baseline | 83.4 ± 10.5 | 82.1 ± 9.5 | −5.98% | −2.30% | <0.001 | 0.026 | 0.138 |
| 5 years | 77.0 ± 9.7 | 79.5 ± 11.1 | |||||
| Body mass index (kg/m2) | |||||||
| Baseline | 28.5 (25.8–30.9) | 28.1 (25.6–30.7) | 0.62% | 1.37% | 0.395 | 0.023 | 0.292 |
| 5 years | 28.4 (25.6–31.4) | 28.4 (25.8–31.4) | |||||
| NT-ProBNP (ng/L) | |||||||
| Baseline | 1071 (687–1537) | 987 (683–1548) | −34.94% | −23.99% | <0.001 | <0.001 | 0.428 |
| 5 years | 475 (118–828) | 512 (135–1038) | |||||
| Total cholesterol (mmol/L) | |||||||
| Baseline | 5.0 (4.2–5.7) | 4.0 (4.1–5.8) | −14.56% | −3.13% | <0.001 | 0.015 | 0.003 |
| 5 years | 4.0 (3.5–4.8) | 4.7 (3.9–5.4) | |||||
| LDL cholesterol (mmol/L) | |||||||
| Baseline | 3.0 (2.4–3.8) | 2.9 (2.5–3.8) | −16.50% | −5.59% | <0.001 | 0.002 | 0.017 |
| 5 years | 2.1 (1.7–2.7) | 2.7 (2.1–3.6) | |||||
| Left atrial volume indexed (mL/m2) | |||||||
| Baseline | 39 (31–48) | 38 (31–48) | 9.50% | 11.91% | 0.925 | 0.218 | 0.542 |
| 5 years | 39 (32–48) | 40 (30–49) | |||||
| LVEF | |||||||
| Baseline | 54 (43–59) | 52 (43–60) | 11.25% | 13.12% | 0.001 | <0.001 | 0.831 |
| 5 years | 55 (50–60) | 55 (51–60) | |||||
| Urine sodium (mmol/24 h) | |||||||
| Baseline | 161 (118–210) | 166 (122–217) | −10.80% | −11.64% | 0.118 | 0.125 | 0.691 |
| 5 years | 162 (102–196) | 159 (125–193) | |||||
| Exercise test (W) | |||||||
| Baseline | 137 (108 –165) | 134 (100–160) | 0.26% | −3.82% | 0.128 | 0.005 | 0.851 |
| 5 years | 139 (99–173) | 126 (90–162) |
Data are presented as mean (SD), number of patients (%), or median (IQR). Delta represents mean change at 5-year follow-up in percentages.
LDL, low-density lipoprotein; LVEF, left ventricular ejection fraction; NT-proBNP, N-terminal pro-brain natriuretic peptide.
Discussion
We studied the long-term results of targeted therapy compared to conventional therapy in patients with early persistent AF and stable mild to moderate HF. Our data show that after follow-up of 5 years, targeted therapy was beneficial in reduction of blood pressure and cholesterol levels. However, the benefit that was seen in sinus rhythm maintenance at 1 year for the patients randomized to targeted therapy could not be upheld during long-term follow-up. Cardiovascular morbidity and mortality occurred in a 3.2% per year and was comparable between the two groups.
We now demonstrate that despite the promising results of targeted therapy at 1 year, the superior efficacy in sinus rhythm maintenance could not be preserved at 5-year follow-up, even with significantly higher use of MRAs and statins and significantly lower blood pressures and cholesterol levels in the targeted group compared to the conventional group. Why did we not observe benefit of targeted therapy at 5-year follow-up?
First, long-term sinus rhythm maintenance remains a challenge. Even with recent studies showing improvement in success of sinus rhythm maintenance with ablation, recurrence rate of AF during long-term follow-up remains high, especially in patients with persistent AF and HF.7 Additionally, despite the attempt to target risk factors at an early stage of AF, patients in the RACE 3 trial had early persistent AF and early HF, with relatively enlarged left atria. Therefore, reduction of blood pressure by MRAs and cholesterol levels by statins might simply not have prevented AF recurrences due to the more advanced stage of atrial remodelling as a result from long existing underlying risk factors and HF, compared to patients in studies with high success of rhythm control therapy.5,6 Similar results were seen in patients after ablation, where aggressive treatment of blood pressure showed no reduction in AF recurrences.13
Of note, NT-proBNP levels decreased significantly in both groups during follow-up but did not differ between the groups, presumably due to the lack of differences in sinus rhythm maintenance between the groups at 5 years. Importantly, no difference was seen in BMI between the groups at 5 years. This is in contrast with our 1-year follow-up data and previous studies with cardiac rehabilitation.10,15 Even though our cardiac rehabilitation programme was simply implementable to get patients active, the short supervised period, absence of weight reduction, and the comparable outcome on physical activity in both groups at 5 years could have contributed to the lack of benefit of targeted therapy.16 Keeping patients physically active remains difficult.17 More intensive counselling and extension of supervised exercise in the 5-year follow-up possibly could have improved outcome on physical activity and consequently maintain the weight loss and BMI reduction as seen at 1-year follow-up. Furthermore, with the new digital tools available nowadays, patients could be monitored and motivated in an easier way and more frequently. Studies that showed beneficial effects had a more aggressive approach with strict counselling, in highly motivated patients.10 This again stresses that long-term lifestyle changes are difficult to obtain.17 In addition, our long-term follow-up results may suggest that treatment of underlying conditions should be applied in a personalized matter.
Lastly, the intention of the trial was to aggressively treat underlying conditions using targeted therapy, not applying aggressive rhythm control therapy including ablation. Only a small number of our patients underwent ablation, also because they all had persistent AF. If the RACE 3 trial was done in present time, more patients probably would have undergone an ablation. Recent studies showed that early rhythm control is associated with less cardiovascular events and higher sinus rhythm maintenance rate at 2-year follow-up.5 In addition, ablation is superior to antiarrhythmic drugs, although data on patients with persistent AF are lacking.4,6,7,18
Progressive forms of AF are known to have worse outcome compared to paroxysmal AF.2,19 The comparable results on cardiovascular morbidity and mortality between the groups should be seen as explorative, due to the small sample size no definitive conclusions can be drawn. However, overall the cardiovascular mortality of our patients was comparable to those with stable HF patients in the Catheter Ablation vs. Antiarrhythmic Drug Therapy for Atrial Fibrillation (CABANA) trial (3%), but lower than in the Catheter Ablation vs. Standard Conventional Therapy in Patients with Left Ventricular Dysfunction and Atrial Fibrillation (CASTLE-AF) trial (17%), and higher than in the Early Treatment of Atrial Fibrillation for Stroke Prevention (EAST-AFNET 4) trial (1%).4,5,20 Hospitalization for HF was low (3%) compared to CABANA HF (9%) and CASTLE-AF (65%) patients, but higher compared to EAST (2%).4,5,20 Differences in outcome between the trials could be as a result of contrasts in severity of HF between the studies. CASTLE-AF included only HF with reduced ejection fraction patients, in EAST only a third had HF, and CABANA included HF patients without limitations of history of HF, whereas all RACE 3 patients had a short history of stable mild to moderate HF, mostly HFpEF.4,5
Even though ACE-Is and ARBs were instituted in a relatively high number of patients in both groups and MRAs and statins were used in the majority of the targeted patients, we did not observe a difference in cardiovascular outcome. Evidently, the number of patients in RACE 3 was too small to draw definitive conclusions. Nonetheless, it did result in well-controlled blood pressures and proper cholesterol levels at 5-year follow-up, with even a significantly lower blood pressure and cholesterol levels in the targeted group. In a group with comparable risk factors, it has been shown that aggressive treatment of hypertension results in better prognosis of cardiovascular events.9,11
Limitations
Limitations of this study include the small number of patients, being powered for sinus rhythm maintenance at 1 year, and not primarily being designed to assess differences in cardiovascular outcome. Due to the limited samples size results and outcomes are not conclusive. Furthermore, this was an open design study without use of placebo. Moreover, first year of follow-up was more comprehensive, with more visits for both groups and supervised physical activity for 11 weeks for the targeted group. No data on physical activity in the conventional group at 1-year follow-up were available. In the additional follow-up, only self-reported physical activity was assessed for both groups. Finally, with risk factor management being a more prominent recommendation throughout the years, becoming incorporated in standard care, this might also have mitigated any potential differences in results.
Conclusion
The RACE 3 study shows that in patients with early persistent AF and mild to moderate HF reduction of blood pressure and cholesterol levels with targeted therapy of underlying conditions on top of conventional therapy does not preserve improvement in sinus rhythm maintenance at 5-year follow-up, as seen at 1 year. We observed no differences in cardiovascular morbidity and mortality between the groups, a larger sample size is needed for conclusive results on cardiovascular outcome.
Supplementary material
Supplementary material is available at Europace online.
Funding
The study is supported by the Netherlands Heart Foundation (2008B035). Unrestricted grants from AstraZeneca, Bayer, Biotronik, Boehringer-Ingelheim, Boston Scientific, Medtronic, Sanofi-Aventis, St. Jude Medical paid to the Netherlands Heart Institute.
Conflict of interest: M.R. reports grants from Dutch Heart Foundation: RACE V, RED-CVD, CVON-AI, DECISION studies; grant from SJM/Abbott to institution: VIP-HF study; grant for Medtronic to institution: Cryoballoon AF registry/biobank study. All other authors declare that there is no conflict of interest.
Data availability
Details on research data are available up on request.
References
Author notes
A complete list of investigators in the RACE 3 (Routine versus Aggressive Risk Factor Driven Upstream Rhythm Control for Prevention of Early Atrial Fibrillation in Heart Failure) is provided in the Supplementary material online.
