


Abstract
The risk of adverse events in atrial fibrillation (AF) patients was commonly stratified by risk factors or clinical risk scores. Risk factors often do not occur in isolation and are often found in multimorbidity ‘clusters’ which may have prognostic implications. We aimed to perform cluster analysis in a cohort of AF patients and to assess the outcomes and prognostic implications of the identified comorbidity cluster phenotypes.
The Fushimi AF Registry is a community-based prospective survey of the AF patients in Fushimi-ku, Kyoto, Japan. Hierarchical cluster analysis was performed on 4304 patients (mean age: 73.6 years, female; 40.3%, mean CHA2DS2-VASc score 3.37 ± 1.69), using 42 baseline clinical characteristics. On hierarchical cluster analysis, AF patients could be categorized into six statistically driven comorbidity clusters: (i) younger ages (mean age: 48.3 years) with low prevalence of risk factors and comorbidities (n = 209); (ii) elderly (mean age: 74.0 years) with low prevalence of risk factors and comorbidities (n = 1301); (iii) those with high prevalence of atherosclerotic risk factors, but without atherosclerotic disease (n = 1411); (iv) those with atherosclerotic comorbidities (n = 440); (v) those with history of any-cause stroke (n = 681); and (vi) the very elderly (mean age: 83.4 years) (n = 262). Rates of all-cause mortality and major adverse cardiovascular or neurological events can be stratified by these six identified clusters (log-rank test; P < 0.001 and P < 0.001, respectively).
We identified six clinically relevant phenotypes of AF patients on cluster analysis. These phenotypes can be associated with various types of comorbidities and associated with the incidence of clinical outcomes.
https://www.umin.ac.jp/ctr/index.htm. Unique identifier: UMIN000005834.
A cohort of AF contains diverse and heterogeneous patients with AF. Cluster analysis identified six clinically relevant phenotypes in a Japanese AF cohort.
These phenotypes on cluster analysis can be associated with various types of comorbidities, and associated with the incidence of clinical outcomes in Japanese AF.
Introduction
Atrial fibrillation (AF) is the most common cardiac arrhythmia in clinical practice and patients with AF are at high risk of ischaemic stroke and mortality.1,2 Classification of AF is often based on arrhythmia subtype (paroxysmal, persistent, or long-standing persistent/permanent), or thromboembolism risk stratified by CHADS2 or CHA2DS2-VASc scores.3,4 However, this classification did not always represent the heterogeneity of AF.5 AF is a very heterogeneous condition caused by a variety of underlying processes and disorders, and it might not be optimally characterized with simplified clinical risk scores, which were designed to only focus on a specific outcome, e.g. stroke.6 Risk factors often do not occur in isolation and are often found in multimorbidity ‘clusters’ which may have prognostic implications.
Cluster analysis is a data-driven approach widely used in other fields of medical research.7–9 It evaluates and calculates differences between individual cases on the basis of their comorbidity variables and characteristics, and finds clusters of patients who are more similar to each other than the patients in other clusters thereby improving characterization of disease phenotypes. Previously, comorbidity classification of AF patients by cluster analysis was reported using data from the ORBIT-AF registry in the USA10 and from the KiCS-AF Registry in Japan.11 However, it is not known whether such comorbidity classifications or categorizations of AF patients are common in the other AF cohorts (e.g. community-based cohorts) and confers prognostic value.
The aim of this present study was to perform cluster analysis of comorbidities in a cohort of community-based AF patients, and secondly, to assess the clinical outcomes and prognostic implications of the identified comorbidity cluster phenotypes.
Methods
Study population
The data that support the findings of this study are available from the corresponding author on reasonable request. The detailed study design, patient enrolment, the definition of the measurements, and subjects’ baseline clinical characteristics of the Fushimi AF Registry have been previously described (UMIN Clinical Trials Registry: UMIN000005834).12 The inclusion criterion for the registry is the documentation of AF on a 12-lead electrocardiogram or Holter monitoring at any time. There were no exclusion criteria. A total of 81 institutions, all of which are members of Fushimi-Ishikai (Fushimi Medical Association), participated in the registry. The enrolment of patients was started in March 2011. All of the participating institutions attempted to enroll all consecutive patients with AF under regular outpatient care or under admission. Clinical data of the patients were registered in the Internet Database System (https://edmsweb16.eps.co.jp/edmsweb/002001/FAF/top.html) by the doctors in charge at each institution. The study protocol conforms to the ethical guidelines of the 1975 Declaration of Helsinki and was approved by the ethical committees of the National Hospital Organization Kyoto Medical Center and Ijinkai Takeda General Hospital.
Outcomes
We collected follow-up data of enrolled patients every year. The primary endpoint in this sub-analysis was the incidence of major adverse cardiovascular or neurological events (MACNE), which was defined as a composite of cardiovascular mortality, stroke, systemic embolism (SE), transient ischaemic attack (TIA), or myocardial infarction, according to the previous study.10 Other clinical endpoints included the incidence of all-cause mortality, major bleeding, and hospitalization for heart failure. Stroke was defined as the sudden onset of a focal neurologic deficit in a location consistent with the territory of a major cerebral artery, and the diagnosis of ischaemic or haemorrhagic stroke was confirmed by computed tomography or magnetic resonance imaging. SE was defined as an acute vascular occlusion of an extremity or organ. Major bleeding was defined in accordance with the criteria of the International Society on Thrombosis and Haemostasis (ISTH) as following: (i) reduction in the haemoglobin level of at least 2 g/dL; (ii) transfusion of at least 2 units of blood; (iii) symptomatic bleeding at a critical area or organ. Oral anticoagulants (OAC) included warfarin, dabigatran, rivaroxaban, apixaban, and edoxaban. Antiplatelet drugs (APD) included aspirin, clopidogrel, prasugrel, ticlopidine, and cilostazol.
Statistical analysis
In this study, we performed hierarchical clustering.13 The Ward minimum variance method of clustering was used to identify patient clusters, given the mixed data types of binary, ordinary, and continuous variables. The distance was calculated on the basis of 42 variables including baseline characteristics, such as demographics (age, sex, and body mass index), vital signs (pulse rate, diastolic, and systolic blood pressure), medical history (smoking habit, alcohol drinking, prior stroke, type of prior stroke, prior TIA, prior SE, heart failure, cardiomyopathy, valvular heart disease, hypertension, diabetes, dyslipidaemia, coronary artery disease, myocardial infarction, peripheral artery disease, chronic kidney disease, chronic obstructive lung disease, history of major bleeding, and liver dysfunction), therapeutic history (haemodialysis, previous valve surgery, device implantation, coronary artery bypass surgery, percutaneous coronary intervention, cardioversion, and catheter ablation), echocardiographic finding (left ventricular ejection fraction), type of AF, valvular AF, interval of first AF documentation, and symptom of AF. Smoking habit included both current and former smokers. Almost all baseline characteristics collected in the Fushimi AF Registry were used in this cluster analysis. Due to substantial missing data, data of blood examination, chest X-ray, electrocardiography, and echocardiography except ejection fraction were not used for the cluster analysis. The goal was to determine clusters that were homogeneous and that illustrated particular types of patients, without knowing the outcomes. According to the tree diagram (Figure 1), the groupings from three clusters or six clusters could be considered. Examination of tree diagram indicated that the groupings became more heterogeneous after being expanded to six clusters.
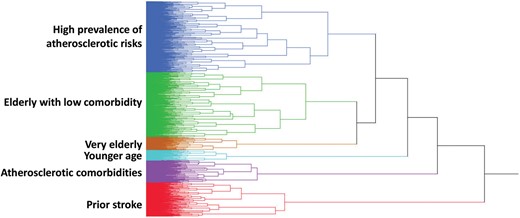
Tree diagram describing the clustering process. Each branch represents each patient.
Continuous variables are expressed as mean and standard deviation. Categorical variables are presented as numbers and percentages. We compared categorical variables using the χ2 test and continuous variables using analysis of variance for normally distributed data or the Kruskal–Wallis test for non-normal distribution. Crude outcomes were presented as events rates by 100 person-years. The Kaplan–Meier method was used to estimate the cumulative incidences of clinical outcomes. We carried out multivariate Cox proportional hazards model to determine the impact of clusters on the incidence of clinical outcomes. The covariates chosen to be included were OAC, APD, digitalis, β-blockers, antiarrhythmic drugs, angiotensin-converting enzyme inhibitor or angiotensin II receptor blocker, statins, calcium channel blocker, loop diuretics, catheter ablation, direct current conversion, percutaneous coronary intervention, coronary artery bypass graft, haemodialysis, and cardiac device at baseline. The second lowest risk cluster (elderly with low comorbidity) was taken as a reference to calculate the hazard ratios (HRs) of clinical outcomes, because several HRs were not applicable when the lowest risk cluster (younger age) was taken as a reference. Statistical significance was set at a two-sided P-value of <0.05. These analyses were performed using JMP version 13.2.0 (SAS Institute, Cary, NC, USA).
Results
Of the 4875 patients who were enrolled into the Fushimi AF Registry between March 2011 and December 2017, the total cohort included 4304 patients after excluding patients with missing follow-up data and prescription status. A median follow-up period was 1307 days [interquartile range (IQR) 709–2156 days]. On hierarchical cluster analysis, AF patients could be categorized into six statistically driven comorbidity clusters: (i) younger ages (mean age of 48.3 years) with low prevalence of risk factors and comorbidities (n = 209); (ii) elderly (mean age of 74.0 years) with low prevalence of risk factors and comorbidities (n = 1301); (iii) those with high prevalence of atherosclerotic risk factors, such as smoking behaviour, hypertension, and diabetes mellitus, but without atherosclerotic disease (n = 1411); (iv) those with coronary artery disease, myocardial infarction, and/or atherosclerotic comorbidities (n = 440); (v) those with history of any-cause stroke (n = 681); and (vi) the very elderly (mean age of 83.4 years) (n = 262) (Table 1).
Patient characteristics at baseline
| Overall (n = 4304) | Younger age (n = 209) | Elderly with low comorbidity (n = 1301) | High prevalence of atherosclerotic risks (n = 1411) | Atherosclerotic comorbidities (n = 440) | Prior stroke (n = 681) | Very elderly (n = 262) | P-value | |
|---|---|---|---|---|---|---|---|---|
| Demographics and vital signs | ||||||||
| Female | 1737 (40.4) | 49 (23.4) | 685 (52.7) | 387 (27.4) | 121 (27.5) | 269 (39.5) | 226 (86.3) | <0.001 |
| Age (years) | 73.6 (10.9) | 48.3 (10.0) | 74.0 (8.8) | 72.5 (9.0) | 76.1 (7.7) | 77.4 (9.5) | 83.4 (7.4) | <0.001 |
| Body weight (kg) | 59.5 (13.5) | 69.7 (15.6) | 56.8 (11.8) | 63.6 (13.4) | 61.3 (11.8) | 56.8 (11.9) | 45.5 (10.1) | <0.001 |
| Body mass index (kg/m2) | 23.1 (4.0) | 24.6 (5.0) | 22.6 (3.4) | 24.1 (4.3) | 23.5 (3.5) | 22.3 (3.7) | 20.0 (3.6) | <0.001 |
| Pulse rate (b.p.m.) | 78.3 (16.5) | 78.2 (14.9) | 78.1 (16.9) | 78.2 (15.7) | 78.4 (15.8) | 79.4 (18.4) | 77.3 (16.3) | 0.511 |
| Systolic blood pressure (mmHg) | 125.0 (18.9) | 123.6 (15.9) | 125.0 (19.1) | 125.8 (18.3) | 123.1 (19.7) | 126.2 (19.4) | 121.9 (20.0) | 0.003 |
| Diastolic blood pressure (mmHg) | 71.1 (13.0) | 75.3 (11.0) | 71.2 (12.2) | 71.8 (12.9) | 68.8 (13.9) | 71.6 (13.7) | 66.6 (13.6) | <0.001 |
| Information of AF | ||||||||
| Paroxysmal AF | 2117 (49.2) | 160 (76.6) | 692 (53.2) | 631 (44.7) | 250 (56.8) | 262 (38.5) | 122 (46.6) | <0.001 |
| Persistent/permanent AF | 2187 (50.8) | 49 (23.4) | 609 (46.8) | 780 (55.3) | 190 (43.2) | 419 (61.5) | 140 (53.4) | <0.001 |
| Valvular AF | 86 (2.0) | 2 (1.0) | 7 (0.5) | 49 (3.5) | 5 (1.1) | 5 (0.7) | 18 (6.9) | <0.001 |
| Interval since 1st detection of AF (years) | 3.8 (5.1) | 2.5 (3.7) | 3.9 (4.7) | 3.6 (5.2) | 3.6 (4.7) | 4.5 (5.4) | 4.4 (6.6) | <0.001 |
| Asymptomatic | 2310 (53.7) | 62 (30.0) | 629 (48.4) | 762 (54.0) | 236 (53.6) | 461 (67.7) | 160 (61.1) | <0.001 |
| Medical history | ||||||||
| Smoking habit | 1456 (33.8) | 64 (30.6) | 158 (12.1) | 809 (57.3) | 212 (48.2) | 189 (27.8) | 24 (9.2) | <0.001 |
| Daily drinker | 806 (18.7) | 39 (18.7) | 100 (7.7) | 463 (32.8) | 72 (16.4) | 127 (18.7) | 5 (1.9) | <0.001 |
| Stroke/TIA/SE | 871 (20.2) | 2 (1.0) | 35 (2.7) | 64 (4.5) | 91 (20.7) | 673 (98.8) | 6 (2.3) | <0.001 |
| Prior stroke | 778 (18.1) | 1 (0.5) | 8 (0.6) | 19 (1.4) | 78 (17.7) | 672 (98.7) | 0 (0.0) | <0.001 |
| Ischaemic stroke | 700 (16.3) | 1 (0.5) | 4 (0.3) | 14 (1.0) | 77 (17.5) | 604 (88.7) | 0 (0.0) | <0.001 |
| Haemorrhagic stroke | 80 (1.9) | 0 (0.0) | 2 (0.2) | 3 (0.2) | 3 (0.7) | 72 (10.6) | 0 (0.0) | <0.001 |
| Prior TIA | 81 (1.9) | 1 (0.5) | 19 (1.5) | 32 (2.3) | 11 (2.5) | 16 (2.4) | 2 (0.8) | 0.150 |
| Prior SE | 53 (1.2) | 0 (0.0) | 10 (0.8) | 15 (1.1) | 14 (3.2) | 10 (14.5) | 4 (1.5) | 0.002 |
| Heart failure | 1170 (27.2) | 24 (11.5) | 172 (13.2) | 438 (31.0) | 189 (43.0) | 179 (26.3) | 168 (64.1) | <0.001 |
| LVEF <40% | 198 (4.6) | 5 (2.4) | 9 (0.7) | 79 (5.6) | 58 (13.2) | 24 (3.5) | 23 (8.8) | <0.001 |
| Valvular heart disease | 739 (17.2) | 26 (12.4) | 152 (11.7) | 233 (16.5) | 64 (14.6) | 127 (18.7) | 137 (52.3) | <0.001 |
| Cardiomyopathy | 120 (2.8) | 8 (3.8) | 13 (1.0) | 69 (4.9) | 5 (1.1) | 14 (2.1) | 11 (4.2) | <0.001 |
| Hypertension | 2707 (62.9) | 63 (30.1) | 648 (49.8) | 1059 (75.1) | 330 (75.0) | 433 (63.6) | 174 (66.4) | <0.001 |
| Diabetes mellitus | 1013 (23.5) | 21 (10.1) | 135 (10.4) | 455 (32.3) | 205 (46.6) | 155 (22.8) | 42 (16.0) | <0.001 |
| Dyslipidaemia | 1895 (44.0) | 62 (29.7) | 467 (35.9) | 685 (48.6) | 319 (72.5) | 284 (41.7) | 78 (29.8) | <0.001 |
| Coronary artery disease | 632 (14.7) | 6 (2.9) | 30 (2.3) | 82 (5.8) | 430 (97.7) | 44 (6.5) | 40 (15.3) | <0.001 |
| Myocardial infarction | 261 (6.1) | 3 (1.4) | 2 (0.2) | 6 (0.4) | 219 (49.8) | 15 (2.2) | 16 (6.1) | <0.001 |
| Peripheral artery disease | 177 (4.1) | 2 (1.0) | 15 (1.2) | 65 (4.6) | 60 (13.6) | 23 (3.4) | 12 (4.6) | <0.001 |
| Chronic kidney disease | 1543 (35.9) | 12 (5.7) | 186 (14.3) | 656 (46.5) | 230 (52.3) | 254 (37.3) | 205 (78.2) | <0.001 |
| Chronic obstructive lung disease | 224 (5.2) | 1 (0.5) | 43 (3.3) | 122 (8.7) | 20 (4.6) | 32 (4.7) | 6 (2.3) | <0.001 |
| Liver dysfunction | 64 (1.5) | 4 (1.9) | 13 (1.0) | 20 (1.4) | 12 (2.7) | 7 (1.0) | 8 (3.1) | 0.030 |
| History of major bleeding | 185 (4.3) | 3 (1.4) | 17 (1.3) | 28 (2.0) | 22 (5.0) | 110 (16.2) | 5 (1.9) | <0.001 |
| Risk scores | ||||||||
| CHADS2 score | 2.03 (1.33) | 0.54 (0.67) | 1.26 (0.95) | 1.90 (1.00) | 2.62 (1.27) | 3.74 (0.98) | 2.36 (0.83) | <0.001 |
| CHA2DS2-VASc score | 3.37 (1.69) | 0.82 (0.84) | 2.67 (1.29) | 3.06 (1.36) | 4.44 (1.61) | 5.09 (1.27) | 4.35 (1.02) | <0.001 |
Continuous variables are expressed as mean (SD). Categorical variables are presented as numbers (%).
LVEF, left ventricular ejection fraction; SE, systemic embolism; SD, standard deviation; TIA, transient ischaemic attack.
Younger age cluster
This cluster was the youngest and the most likely to be male. They had the highest body mass index among the six clusters and were most likely to have paroxysmal AF. They had the lowest prevalences of risk factors and comorbidities. They also had the lowest mean CHADS2 score and CHA2DS2-VASc score.
Elderly with low comorbidity cluster
These patients were elderly and more likely to be female. They had average body mass index and relatively lower prevalences of risk factors and comorbidities. They had the second lowest mean CHADS2 score and CHA2DS2-VASc score.
High prevalence of atherosclerotic risks cluster
This was the largest cluster, with approximately one-third of patients in this cohort. Patients in this cluster were elderly and more likely to be male. They had the second largest body mass index and relatively high prevalences of atherosclerotic risk factors and behaviour. They had lower prevalences of actual cardiovascular diseases per se, including coronary artery disease, myocardial infarction, and peripheral artery disease. They had an average mean CHADS2 score and CHA2DS2-VASc score.
Atherosclerotic comorbidities cluster
The atherosclerotic comorbidities cluster was similar to the high prevalence of atherosclerotic risks cluster, as patients in this cluster were likely to be male and relatively high prevalences of atherosclerotic risk factors and behaviour. They had the highest prevalences of atherosclerotic cardiovascular disease, including coronary artery disease, myocardial infarction, and peripheral artery disease. They had the second highest mean CHADS2 score and CHA2DS2-VASc score.
Prior stroke cluster
This cluster was the second oldest and more likely to be male. They had average body mass index and were the less likely to have paroxysmal AF. They also had high prevalence of risk factors and comorbidities; specifically, 673 of these 681 patients had history of stroke/TIA/SE. They had also the highest prevalence of history of major bleeding. Reflecting the presence of many comorbidities, they had the highest mean CHADS2 score and CHA2DS2-VASc score.
Very elderly cluster
This was the oldest group and the most likely to be female. They had the lowest body mass index and body weight among the six clusters. They had relatively low prevalences of risk factors and behaviours, but the highest prevalences of heart failure and chronic kidney disease. They had the third highest mean CHADS2 score and CHA2DS2-VASc score.
Treatment patterns by clusters
The differences in treatment patterns by clusters are shown in Table 2. Patients in the younger age cluster were more likely to be managed with a rhythm-control strategy than the other 5 clusters; i.e. antiarrhythmic drugs, catheter ablation, and direct current conversion. They received the lowest prescriptions of OAC, APD, digitalis, and statin. Patients in the high prevalence of atherosclerotic risks and prior stroke clusters were more prescribed OAC than those in the other 4 clusters. APD was most commonly prescribed to the atherosclerotic comorbidities cluster. They also had the highest use of β-blocker, angiotensin-converting enzyme inhibitor or angiotensin II receptor blocker, percutaneous coronary intervention, coronary artery bypass graft, and haemodialysis. The very elderly cluster received the most prescription of digitalis and cardiac devices.
Medication and previous therapies at baseline
| Overall (n = 4304) | Younger age (n = 209) | Elderly with low comorbidity (n = 1301) | High prevalence of atherosclerotic risks (n = 1411) | Atherosclerotic comorbidities (n = 440) | Prior stroke (n = 681) | Very elderly (n = 262) | P-value | |
|---|---|---|---|---|---|---|---|---|
| OAC | 2378 (55.3) | 54 (25.8) | 631 (48.5) | 877 (62.2) | 229 (52.1) | 460 (67.6) | 127 (48.5) | <0.001 |
| Warfarin | 1815 (42.2) | 37 (17.7) | 468 (36.0) | 636 (45.1) | 185 (42.1) | 379 (55.7) | 110 (42.0) | <0.001 |
| NOAC | 563 (13.1) | 17 (8.1) | 163 (12.5) | 241 (17.1) | 44 (10.0) | 81 (11.9) | 17 (6.5) | <0.001 |
| APD | 1180 (27.4) | 20 (9.6) | 239 (18.4) | 289 (20.5) | 335 (76.1) | 227 (33.3) | 70 (26.7) | <0.001 |
| AAD | 844 (19.6) | 68 (32.5) | 317 (24.4) | 256 (18.1) | 75 (17.1) | 95 (14.0) | 33 (12.6) | <0.001 |
| Digitalis | 487 (11.3) | 6 (2.9) | 145 (11.2) | 171 (12.1) | 44 (10.0) | 79 (11.6) | 42 (16.0) | <0.001 |
| β-Blockers | 1308 (30.4) | 68 (32.5) | 326 (25.1) | 481 (34.1) | 175 (39.8) | 164 (24.1) | 94 (35.9) | <0.001 |
| ACE-I/ARB | 1913 (44.4) | 65 (31.1) | 425 (32.7) | 736 (52.2) | 269 (61.1) | 292 (42.9) | 126 (48.1) | <0.001 |
| CCB | 1350 (31.4) | 34 (16.3) | 353 (27.1) | 532 (37.7) | 156 (35.5) | 216 (31.7) | 59 (22.5) | <0.001 |
| Statins | 1048 (24.3) | 23 (11.0) | 235 (25.0) | 243 (55.2) | 160 (23.5) | 160 (23.5) | 35 (13.4) | <0.001 |
| Loop diuretics | 975 (22.7) | 15 (7.2) | 181 (13.9) | 351 (24.9) | 149 (33.9) | 144 (21.2) | 135 (51.5) | <0.001 |
| PCI | 353 (8.2) | 5 (2.4) | 4 (0.3) | 19 (1.4) | 308 (70.0) | 9 (1.3) | 8 (3.1) | <0.001 |
| CABG | 98 (2.3) | 0 (0.0) | 4 (0.3) | 13 (0.9) | 69 (15.7) | 6 (0.9) | 6 (2.3) | <0.001 |
| Valve surgery | 184 (4.3) | 14 (6.7) | 13 (1.0) | 89 (6.3) | 13 (3.0) | 18 (2.6) | 37 (14.1) | <0.001 |
| HD | 106 (2.5) | 3 (1.4) | 0 (0.0) | 50 (3.5) | 30 (6.8) | 13 (1.9) | 10 (3.8) | <0.001 |
| Cardiac device implantation | 326 (7.6) | 7 (3.4) | 103 (7.9) | 87 (6.2) | 44 (10.0) | 40 (5.9) | 45 (17.2) | <0.001 |
| Ablation | 274 (6.4) | 37 (17.7) | 114 (8.8) | 70 (5.0) | 25 (5.7) | 23 (3.4) | 5 (1.9) | <0.001 |
| DC | 148 (3.4) | 24 (11.5) | 19 (1.5) | 60 (4.3) | 24 (5.5) | 8 (1.2) | 13 (5.0) | <0.001 |
Categorical variables are presented as numbers (%).
AAD, antiarrhythmic drugs; ACE-I, angiotensin-converting enzyme inhibitor; APD, antiplatelet drug; ARB, angiotensin II receptor blocker; CABG, coronary artery bypass graft; CCB, calcium channel blocker; DC, direct current conversion; HD, haemodialysis; NOAC, non-vitamin K oral anticoagulants; OAC, oral anticoagulants; PCI, percutaneous coronary intervention.
Outcomes
Kaplan–Meier curves demonstrated that the incidences of all-cause mortality were well-stratified by six clusters (log-rank test; P < 0.001) (Figure 2). The cumulative incidences of all-cause mortality at 5 years were 1.1% in the younger age cluster, 14.1% in the elderly with low comorbidity cluster, 21.0% in the high prevalence of atherosclerotic risks cluster, 26.7% in the atherosclerotic comorbidities cluster, 33.5% in the prior stroke cluster, and 50.9% in the very elderly cluster. Kaplan–Meier analysis for the incidence of MACNE throughout whole follow-up period is shown in Figure 3. The cumulative incidences of MACNE at 5 years in the younger age, the elderly with low comorbidity, the high prevalence of atherosclerotic risks, the atherosclerotic comorbidities, the prior stroke, and the very elderly clusters, were 2.2%, 10.9%, 12.2%, 21.9%, 24.2%, and 30.4%, respectively (log-rank test; P < 0.001). The crude incidence rates of clinical events are shown in Figure 4. The incidence rates of many clinical outcomes were high according to the identified 6 clusters, with similar trends concerning all-cause mortality.
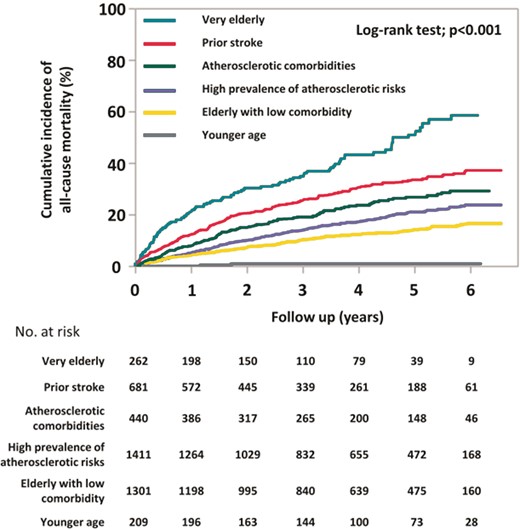
Kaplan–Meier curves for all-cause mortality during follow-up period.
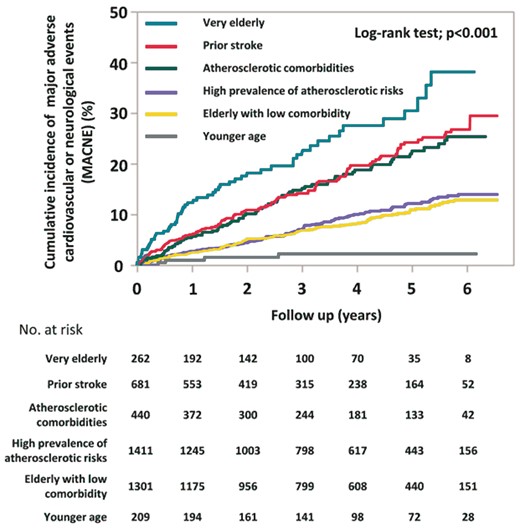
Kaplan–Meier curves for MACNE during follow-up period. MACNE, major adverse cardiovascular or neurological events.
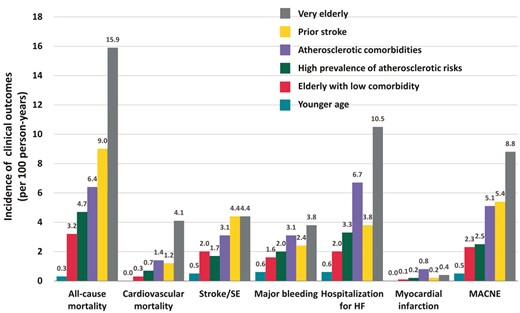
Crude incidence rates of various clinical outcomes, presented by 100 person-years. HF, heart failure; MACNE, major adverse cardiovascular or neurological events; SE, systemic embolism.
On multivariate Cox regression analysis, when compared with the elderly with low comorbidity cluster, the adjusted HR of MACNE were significantly lower in the younger age cluster and higher in the three other clusters (Figure 5). The prior stroke cluster and the very elderly cluster were significantly associated with an increased incidence of stroke/SE. The adjusted risks of major bleeding were significantly higher in the very elderly cluster and those of myocardial infarction were significantly higher in the atherosclerotic comorbidities cluster.
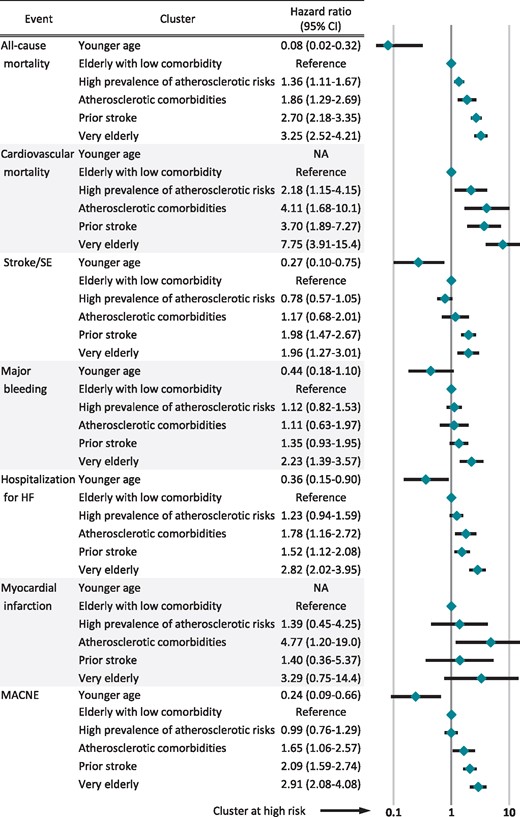
Hazard ratios on multivariate analysis for clinical outcomes. Hazard ratios (95% confidence interval) were presented. They were adjusted by OAC, APD, digitalis, β-blockers, AAD, ACE-I/ARB, statins, CCB, loop diuretics, catheter ablation, DC, PCI, CABG, HD, and cardiac device. AAD, antiarrhythmic drugs; ACE-I, angiotensin-converting enzyme inhibitor; APD, antiplatelet drugs; ARB, angiotensin II receptor blocker; CABG, coronary artery bypass graft; CCB, calcium channel blockers; DC, direct current conversion; HD, haemodialysis; HF, heart failure; MACNE, major adverse cardiovascular or neurological events; NA, not applicable; OAC, oral anticoagulants; PCI, percutaneous coronary intervention; SE, systemic embolism.
Discussion
In this analysis from the Fushimi AF Registry, the principal findings are as follows: (i) cluster analysis identifies six clinically relevant comorbidity phenotypes; (ii) treatment patterns varied among the clusters; and (iii) these distinct clusters were related to prognosis, being associated with incidence of clinical adverse outcomes.
In clinical practice, AF patients commonly have >1 comorbidity, and frequently ≥2 long-term chronic conditions (thus fulfilling the definition of ‘multimorbidity’).14 Nonetheless, the traditional approach has been to assess the prognostic impact of individual risk factors, e.g. hypertension vs. ‘no hypertension’, or diabetes with ‘no diabetes’. The present analysis uses cluster analysis to define comorbidity clusters, which range from the low risk cluster with minimal comorbidity, to the high-risk elderly clusters with multimorbidity. Conventional clinical classifications such as type of AF do not contribute to the formation of these clusters. However, age was one of the most important factors on classification of AF patients in our cohort. Patients could be divided by three groups according to mean age of approximately 50 (younger age), 75 (elderly age), and 85 years (very elderly). Furthermore, elderly patients were characterized by four clusters, based on atherosclerotic risk factors, cardiovascular disease, and cerebrovascular disease.
In the ORBIT-AF registry, a US-based AF cohort, four clinically relevant phenotypes were identified: (i) patients with considerably lower rates of risk factors and comorbidities than all other clusters; (ii) younger patients characterized by high prevalence of liver disease, alcohol abuse, drug abuse, and current smoking; (iii) older patients with high prevalence of device implantation; and (iv) patients with high prevalence of coronary artery disease.10 In the KiCS-AF Registry, a Japanese multicentre outpatient AF registry that enrolled patients from the metropolitan Tokyo area, the cohort was classified into three clusters: (i) younger paroxysmal AF; (ii) persistent/permanent AF with left atrial enlargement; and (iii) atherosclerotic comorbid AF in elderly patients.11 The major differential features of our cohort were the presence of the prior stroke cluster, and that we also had the very elderly cluster with a mean age of 83 years. Also, the mean age of the younger age cluster was younger than the ORBIT-AF and KiCS-AF cohorts. Indeed, age distribution of the clusters was different among the three study cohorts. In ORBIT-AF, the highest median age of clusters was 79 years of age in the device implantation cluster, and the youngest median age was 69 years of age in the younger/behavioural disorder cluster.10 In the KiCS-AF Registry, mean age of clusters ranged from 68.9 to 73.4 years of age.11
In comparison to the cluster phenotypes described in the ORBIT-AF, the device implantation cluster was not observed in the Fushimi AF registry, and cardiac device implantation did not contribute to cluster formation; however, 17.2% of patients of the very elderly cluster in our cohort received implantation of cardiac devices. Also, when compared with the KiCS-AF Registry, the persistent/permanent AF patients with left atrial enlargement cluster were not identified in our cohort. Left atrial size was not included in the cluster analysis because echocardiographic data were not available for all patients in our cohort. Type of AF also did not contribute to cluster formation in our study, either. Furthermore, the presence of one of our cluster phenotypes characterized by history of stroke/TIA/SE was unique, when compared with the ORBIT-AF and the KiCS-AF cohorts. Distribution of history of stroke/TIA in the identified clusters ranged from 12.1% to 19.3% in the ORBIT-AF and from 9.4% to 12.0% in the KiCS-AF Registry.
There are some important similarities between the cluster phenotypes characterized by three cohorts. The atherosclerotic comorbidities AF cluster phenotype was consistently observed among these cohorts. The distinguishing feature in this cluster was the high prescription rates of APD, angiotensin-converting enzyme inhibitors or angiotensin II receptor blockers, and β-blockers. The cluster characterized by younger and low comorbidity was also consistently shown in all cohorts. As these cluster phenotypes appear preserved across cohorts, identification of interventions specific to these patients may be an important goal for future research. The differences in the identified clusters between the three study cohorts (ORBIT-AF, KiCS-AF, and Fushimi AF) represents the heterogeneity of AF patients, which is likely due to the difference in geographical region (Japan vs. USA, different regions), enrolment setting (outpatient only vs. all-comers), and enrolment criteria (all-comer patients with AF on electrocardiogram for Fushimi-AF Registry; compared with patients with a diagnosis of AF within 6 months before the initial visit for KiCS-AF; compared with all-comer AF patients except for AF with reversal cause and life expectancy of <6 months for ORBIT-AF). Use of cluster analysis might be helpful to identify and determine the difference of cohorts in diverse clinical studies.
Association with clinical outcomes
The incidence of all-cause mortality was well-stratified by the identified six clusters in our study. Also, the incidence of MACNE was clearly stratified, but by four groups, since the prior stroke and atherosclerotic comorbidities clusters showed the similar incidence of MACNE, and the high prevalence of atherosclerotic risks and elderly with low comorbidity clusters also demonstrated the similar Kaplan–Meier curves on the incidence of MACNE. In the ORBIT-AF and the KiCS-AF cohorts, the incidence of MACNE was the highest among the patients in atherosclerotic-comorbid AF cluster phenotype. Of note, the incidence rate of MACNE was 5.1 per 100 person-years in our study, in consistency with the incidence rate of 6.1 per 100 person-years in the ORBIT-AF. However, patients in the very elderly cluster had higher incidence rate of MACNE (8.8 per 100 person-years) compared with those in the atherosclerotic comorbidities cluster in our cohort. Clarifying the distinguishing characteristics and key components of each cluster may help physicians understand how they should manage and treat to improve outcomes of patients with these phenotypes.
The OAC prescription rate of 55.3% in our cohort was very low for an AF population with a mean age of 73.6 years and a mean CHA2DS2-VASc score of 3.37, and we previously reported and raised the issue of under-use of anticoagulation.15 This issue can have a large impact on the incidence of MACNE. However, this is not limited to our cohort; the OAC prescription rate was 67% in the GARFIELD-AF Registry which enrolled AF patients worldwide from 2010 to 2016 (median age of 71 years; median CHA2DS2-VASc score of 3.0).16 Moreover, our cohort was not particularly low among AF registries around the world in the INTERAF study.17 OAC is an essential treatment for AF patients with previous stroke, but only 67.6% of patients in the prior stroke cluster received OAC. Our study comparing with the AF cohort in Darlington, UK reported that the OAC prescription rate in the UK was not high, at 61.7% for AF patients with previous stroke.18 We also reported that OAC prescription rates in Japan were increasing year by year after the release of direct OAC.19
The very elderly cluster is a distinctive cluster in our cohort, featuring the ageing society in Japan, but the management and treatment of very elderly patients with AF is a challenging issue worldwide. The incidence rate of hospitalization for heart failure was remarkably high in the very elderly cluster, highlighting the importance of management and prevention of heart failure in those patients.
Limitations
There were several limitations in this study. Different statistical clustering and linkage methods may result in different cluster formation. However, there is no established scientific consensus on the best clustering and linkage method. Medication and indication of treatment were selected at the discretion of the attending physician and were not randomized. We also have no data on time in therapeutic range for individual patients taking warfarin.
Conclusions
We identified six clinically relevant phenotypes of AF patients using cluster analysis of a multicentre Japanese AF cohort. Age, atherosclerotic risk factors or behaviour, cardiovascular disease, and cerebrovascular disease contributed to the formation of the distinct comorbidity clusters. These phenotypes can be associated with various types of comorbidities and associated with the incidence of clinical outcomes in Japanese AF.
Appendix 1
The participating physicians are listed in Ref.12
Acknowledgements
We sincerely appreciate the help of all the institutions participating in the registry and the clinical research coordinators (T. Shinagawa, M. Mitamura, M. Fukahori, M. Kimura, M. Fukuyama, C. Kamata, and N. Nishiyama).
Funding
The Fushimi AF Registry is supported by research funding from Boehringer Ingelheim, Bayer Healthcare, Pfizer, Bristol-Myers Squibb, Astellas Pharma, AstraZeneca, Daiichi Sankyo, Novartis Pharma, MSD, Sanofi-Aventis, and Takeda Pharmaceutical. This research was partially supported by the Practical Research Project for Life-Style related Diseases including Cardiovascular Diseases and Diabetes Mellitus from Japan Agency for Medical Research and Development, AMED (19ek0210082h0003 and 18ek0210056h0003).
Conflict of interest: G.Y.H.L. is a consultant for Bayer/Janssen, BMS/Pfizer, Biotronik, Medtronic, Boehringer Ingelheim, Novartis, Verseon, and Daiichi-Sankyo; speaker for Bayer, BMS/Pfizer, Medtronic, Boehringer Ingelheim, and Daiichi-Sankyo; and no fees are directly received personally. M.A. received lecture fees from Pfizer, Bristol-Myers Squibb, Boehringer Ingelheim, Bayer Healthcare, and Daiichi Sankyo. All the remaining authors have declared no conflicts of interest.
Data availability
The data that support the findings of this study are available from the corresponding author on reasonable request.
References
Author notes
The last two authors are joint senior authors.
