


Abstract
Obstructive sleep apnoea (OSA) associates with atrial fibrillation (AF), but the relationship of OSA severity and AF phenotype with the atrial substrate remains poorly defined. We sought to define the atrial substrate across the spectrum of OSA severity utilizing high-density mapping.
Sixty-six consecutive patients (male 71%, age 61 ± 9) having AF ablation (paroxysmal AF 36, persistent AF 30) were recruited. All patents underwent formal overnight polysomnography and high-density left atrial (LA) mapping (mean 2351 ± 1244 points) in paced rhythm. Apnoea–hypopnoea index (AHI) (mean 21 ± 18) associated with lower voltage (−0.34, P = 0.005), increased complex points (r = 0.43, P < 0.001), more low-voltage areas (r = 0.42, P < 0.001), and greater voltage heterogeneity (r = 0.39, P = 0.001), and persisted after multivariable adjustment. Atrial conduction heterogeneity (r = 0.24, P = 0.025) but not conduction velocity (r = −0.09, P = 0.50) associated with AHI. Patchy regions of low voltage that co-localized with slowed conduction defined the atrial substrate in paroxysmal AF, while a diffuse atrial substrate predominated in persistent AF. The association of AHI with remodelling was most apparent among paroxysmal AF [LA voltage: paroxysmal AF −0.015 (−0.025, −0.005), P = 0.004 vs. persistent AF −0.006 (−0.017, 0.005), P = 0.30]. Furthermore, in paroxysmal AF an AHI ≥ 30 defined a threshold at which atrial remodelling became most evident (nil–mild vs. moderate vs. severe: 1.92 ± 0.42 mV vs. 1.84 ± 0.28 mV vs. 1.34 ± 0.41 mV, P = 0.006). In contrast, significant remodelling was observed across all OSA categories in persistent AF (1.67 ± 0.55 mV vs. 1.50 ± 0.66 mV vs. 1.55 ± 0.67 mV, P = 0.82).
High-density mapping observed that OSA associates with marked atrial remodelling, predominantly among paroxysmal AF cohorts with severe OSA. This may facilitate the identification of AF patients that stand to derive the greatest benefit from OSA management.
Obstructive sleep apnoea (OSA) independently associates with an increasingly remodelled atrial substrate.
There is a dose-dependent association of sleep apnoea severity with atrial remodelling.
Atrial remodelling is most apparent among patients with paroxysmal atrial fibrillation (AF) and severe OSA.
Remodelling in patients with paroxysmal AF is characterized by demarcated regions of low voltage, compared with diffuse regions of low voltage observed in persistent AF.
Introduction
Multiple epidemiologic studies have observed a robust association between obstructive sleep apnoea (OSA) and prevalent atrial fibrillation (AF).1 Stevenson et al. observed that more than 50% of AF patients had moderate or severe sleep apnoea.2 Others have noted that rates of incident AF are significantly higher among patients with sleep apnoea compared to those without.3 Furthermore, associations of AF with OSA persist even after adjusting for other known risk factors such as age, gender, and body mass index.
Observational clinical evidence suggests that sleep apnoea therapy improves the efficacy of rhythm control strategies for AF. This relationship has been identified across multiple clinical contexts including cardioversion4 and catheter ablation.5 However, a single small randomized trial evaluating OSA therapy in a persistent AF cohort having cardioversion did not identify differences in rates of recurrence.6
The current diagnosis and severity of sleep apnoea are largely based on the apnoea–hypopnoea index (AHI) that represents the average number of disordered breathing events per hour of sleep or recording time, including both hypopnoeas and apnoeas. Dimitri et al. and Anter et al. demonstrated that moderate–severe OSA associates with an increasingly remodelled atrial substrate. However, these investigators dichotomized data based on AHI (nil–mild OSA vs. moderate–severe OSA)7,8 and did not evaluate the impact of AHI on the atrial substrate as a continuous variable. Furthermore, the interaction between OSA severity and AF phenotype on the atrial substrate remains uncharacterized.
In part, these more limited analyses reflect the use of low-density mapping modalities to characterize the atrial substrate.7,8 However, the advent of high-density, high-resolution mapping has provided a new window into the nature of atrial remodelling and atrial conduction.
In the current study, we evaluated the impact of OSA on the left atrial (LA) substrate for AF utilizing high-density mapping. We characterized the atrial substrate across the spectrum of AHI to determine whether there is a dose-dependent relationship between atrial remodelling and OSA severity. We also investigated the interaction between OSA severity and AF substrate according to the AF phenotype.
Methods
We prospectively recruited consecutive patients having first-time catheter ablation for AF at two major tertiary hospitals in Melbourne, Australia. All participants provided written informed consent. The study was approved by the Research and Ethics Committees at The Royal Melbourne Hospital and The Alfred Hospital and complied with the Declaration of Helsinki.
Exclusion criteria included prior ablation, left ventricular ejection fraction (EF) < 50% assessed by two-dimensional transthoracic echocardiography utilizing the biplane method, greater than trivial valvular regurgitation, pulmonary artery hypertension (pulmonary artery systolic pressure > 30 mmHg), refractory to electrical cardioversion, and treatment for OSA (previous or present).
Atrial fibrillation type was defined according to the 2017 HRS/EHRA/ECAS/APHRS/SOLAECE expert consensus statement on catheter and surgical ablation of atrial fibrillation.9 Paroxysmal AF was defined as AF that terminated without intervention within 7 days of onset. Persistent AF was defined as continuous AF that is sustained over 7 days.
Overnight polysomnography
All participants underwent routine overnight polysomnography for diagnosis of sleep-disordered breathing as part of the standard clinical protocol implemented at both participating centres. Based on the American Academy of Sleep Medicine (AASM) practice guidelines, polysomnography was performed in the sleep laboratory or at home utilizing a portable polysomnography.10
Respiratory events were classified based on standard AASM criteria.10 All events were independently analysed by two experts in sleep medicine (sleep physician/sleep scientist) blinded to all other clinical data. Diagnosis of sleep apnoea was based on the mean number of apnoeas or hypopnoeas observed per hour of sleep (AHI) in accordance with AASM guidelines; no OSA 0–5, mild OSA 5–15, moderate OSA 15–30, severe OSA > 30.10 Although AHI was treated as a continuous variable for analysis, we also stratified participants based on OSA severity (nil–mild, moderate, and severe) to explore (i) interactions between segmental substrate and OSA severity and (ii) the dose dependency of the atrial substrate with OSA severity.
Left atrial mapping
All procedures were performed under general anaesthetic. Anti-arrhythmic medications were ceased at least five half-lives prior to the procedure. All patients underwent transoesophageal echocardiography (TOE) on the day of the procedure to exclude atrial thrombus. Dual transseptal punctures were performed under TOE and fluoroscopic guidance. The activated clotting time was maintained at 300–350 s.
Bipolar intracardiac electrocardiograms and 12-lead surface electrocardiography were recorded simultaneously on a digital amplifier system (EPMed Systems, West Berlin, NJ, USA). Intracardiac electrograms were filtered from 30 to 500 Hz and measured with digital callipers at a 200 mm/s sweep speed.
Patients in AF at the time of the procedure were externally cardioverted. A 20-pole circular mapping catheter (Biosense Webster Inc., Diamond Bar, CA, USA, 2–5–2 mm electrode spacing) was used to construct left atrial geometry and merged with pre-procedural cardiac computed tomography using the CARTO3 electroanatomic mapping system. Voltage and activation maps were constructed using the circular mapping catheter during constant pacing at 600 ms from the distal coronary sinus to standardize the direction of wavefront propagation. Points were acquired evenly across the left atrium. A minimum of 2000 points were acquired per map using the Confidense algorithm.
Strict criteria were employed to account for the lack of tissue contact data on the multi-polar mapping catheter. Point collection was performed only by experienced operators after careful assessment of tactile catheter pressure, fluoroscopic motion, and application of an internal point filter to within 5 mm of the chamber surface geometry.11 The mapping fill threshold was set at 5 mm. Although data were collected using the Confidense algorithm, all acquired points were also meticulously manually reviewed and annotated. Only points demonstrating characteristics of near-field signals were included. In keeping with prior publications,12 these signals demonstrated at least two sharp peaks and were consistent with anatomically adjacent signals in terms of signal quality and electrogram timing. Points that did not fit these criteria were excluded.
Analysis of high-density maps
Maps comprised a mean of 2351 ± 1244 points [median 2511 (1292, 3456)]. All left atrial maps were analysed manually off-line at 200 mm/s sweep speed. Each electrogram was individually reviewed and annotated. The mitral annulus and pulmonary veins beyond the antrum were excluded from analysis.
Each point was manually annotated at the maximum negative dV/dt for unipolar signals or the peak of the sharp deflection of the bipolar electrogram. Complex points were defined as electrograms with ≥3 deflections >50 ms duration or two separate deflections separated by an isoelectric interval. The proportion of complex points was expressed as a percentage of the total number of points in the relevant segment or map.
Following manual annotation, classification of complex points, and exclusion of signals that failed to meet criteria, data were exported and analysed using customized off-line software (MATLAB 9.1, Mathworks, MA, USA). The LA was segmented into six separate regions: posterior, anterior, septal, lateral, roof, and floor. Additionally, to determine the association of conduction with voltage at regions of interest, we also analysed low-voltage areas (bipolar voltage < 0.5 mV).
Bipolar voltage was defined as the peak–peak electrogram voltage.
Conduction velocity was analysed in MATLAB as previously described using the polynomial algorithm.13,14 In brief, this method assigns a fitting ‘window’ per region with a minimum of 20 points required. Each region is assigned subsets of Cartesian coordinates in space and activation time. These are fitted to a smooth polynomial surface in three-dimensional space, using a standard least-squares algorithm, which provides robustness against outliers. The gradient is then calculated from the fit and used to calculate velocity components, with final velocities at each point calculated from the weighted average of velocity components from every fit including that point.15,16 The mean left atrial conduction velocity was calculated globally and regionally for each patient.
An index of heterogeneity for voltage and conduction velocity was determined by calculating the CoV (CoV = SD/mean × 100%) of the different regions in each chamber.
Statistical analysis
Normally distributed continuous data are expressed as mean ± SD and tested with unpaired Student’s t-tests between paroxysmal and persistent AF groups. The Shapiro–Wilk test was used to test for normality. Where outcome variables were not normally distributed, a log transformation was applied to meet the assumption of normality prior to linear regression analysis. Outcome variables include bipolar voltage, conduction velocity, and proportion of complex points at both global and segmental levels, in addition to voltage and conduction heterogeneity. Additionally, voltage and conduction velocity were calculated at low-voltage regions and compared with global LA voltage and conduction velocity utilizing the paired Student’s t-test.
The association between AHI and outcome variables were modelled using the Pearson’s correlation and general linear models. Multivariable analysis was performed by adjusting for all univariable predictors with P < 0.2 using a backward stepwise approach. The impact of AF phenotype on the relationship between AHI and outcome variables was investigated by the subgroup analysis of paroxysmal and persistent AF cohorts. The AHI threshold that associates with atrial remodelling within each AF phenotype was determined by stratifying into three groups based on OSA severity: AHI 0–15, 15–30, and ≥30. One-way analysis of variance (ANOVA) tests were used to test differences between the three groups, and where the null hypothesis was rejected, a Bonferroni post hoc analysis was used to test between groups. Linear mixed models were used to evaluate the interaction of AHI with atrial segment (see Supplementary material online for details).
Two-sided P-values <0.05 were considered statistically significant. All analyses were performed using SPSS (Version 23, IBM, Armonk, NY, USA).
Results
Patient characteristics
Sixty-six consecutive patients (male 71%, age 61 ± 9) having catheter ablation for AF (paroxysmal 36, persistent 30) were recruited. Baseline characteristics are presented in Table 1. The mean AHI was 21 ± 18 events/h, with the distribution of OSA diagnosis as follows: nil 15%, mild 35%, moderate 24%, and severe 26%. Patients with persistent AF (cf paroxysmal AF) had higher mean AHI (26 ± 21 vs. 17 ± 13, P = 0.03) and larger atrial area (Left Atrium 26 ± 5cm2 vs. 23 ± 5 cm2, P = 0.03 and Rright Atrium 23 ± 6 cm2 vs. 19 ± 4 cm2, P = 0.015).
Baseline characteristics
| All patients n = 66 | Paroxysmal AF n = 36 | Persistent AF n = 30 | P-value | |
|---|---|---|---|---|
| Age (years) | 60 ± 9 | 61±10 | 60 ± 8 | 0.56 |
| Male n (%) | 47 (71) | 24 (67) | 23 (77) | 0.42 |
| BMI (kg/m2) | 30 ± 4 | 30 ± 4 | 31±4 | 0.47 |
| Persistent AF n (%) | 30 (45) | – | – | – |
| AF duration (months) | 33 [12, 84] | 31 [14, 50] | 33 [12, 120] | 0.54 |
| Hypertension n (%) | 30 (45) | 18 (50) | 12 (40) | 0.46 |
| Diabetes n (%) | 3 (5) | 2 (6) | 1 (3) | 1.0 |
| Stroke n (%) | 6 (9) | 4 (11) | 2 (7) | 0.68 |
| CHADS2-VaSc2 | 1.5 ± 1.3 | 1.7 ± 1.4 | 1.2 ± 1.1 | 0.12 |
| AHI (events/h) | 21 ± 18 | 17 ± 13 | 26 ± 21 | 0.03 |
| ODI (events/h) | 14 ± 20 | 11 ± 14 | 17 ± 27 | 0.49 |
| LA area (cm2) | 24 ± 5 | 23 ± 5 | 26 ± 5 | 0.03 |
| RA area (cm2) | 21 ± 65 | 19 ± 4 | 23 ± 6 | 0.015 |
| EF (%) | 59 ± 55 | 59 ± 6 | 59 ± 2 | 0.92 |
AF, atrial fibrillation; BMI, body mass index; AHI, apnoea–hypopnoea index; ODI, oxygen desaturation index; LA, left atrial; EF, ejection fraction.
Univariable and multivariable predictors of AHI are presented in the Supplementary material online. Hypertension was the only predictor of AHI at univariable and multivariable levels. Persistent AF showed a trend but failed to reach significance.
Obstructive sleep apnoea severity and atrial fibrillation substrate
Apnoea–hypopnoea index associated with lower LA bipolar voltage (r = −0.34, P = 0.005), greater proportion of low-voltage points (r = 0.423, P < 0.001) and higher proportion of complex points (r = 0.43, P < 0.001), but not with atrial conduction velocity (r = –0.09, P = 0.50). These effects remained consistent across different LA segments following evaluation of the interaction of atrial region with OSA severity [interaction: P (voltage) = 0.68, P (conduction velocity) = 0.48; see Supplementary material online].
Higher levels of AHI were associated with an increasingly heterogeneous distribution of voltage (r = 0.39, P = 0.001) and conduction velocity (r = 0.24, P = 0.05). Similarly, the proportion of complex points increased with greater AHI (r = 0.43, P < 0.001) (Figure 1).
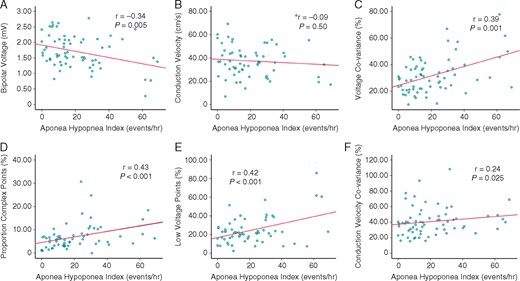
Increasing AHI correlates with an increasingly remodelled atrial substrate, except for conduction velocity. (A) Bipolar voltage, (B) conduction velocity, (C) voltage heterogeneity, (D) complex points, (E) low-voltage points, and (F) conduction velocity heterogeneity. P-values refer to Pearson’s correlation. AHI, apnoea–hypopnoea index.
Univariable and multivariable predictors of bipolar LA voltage are presented in Table 2. Apnoea–hypopnoea index and age were the only univariable predictors of bipolar left atrial voltage; both of which remained independent predictors following multivariable analysis.
Univariable and multivariable predictors of bipolar atrial voltage
| Univariable (β, 95% CI) | Multivariable (β, 95% CI) | |
|---|---|---|
| Age (years) | −0.02 (−0.033, −0.006), P = 0.005 | −0.016 (−0.029, −0.003), P = 0.016 |
| AHI (events/h) | −0.01 (−0.017, −0.003), P = 0.005 | −0.008 (−0.015, −0.002), P = 0.018 |
| OSA severity | −0.22 (−0.37, 0.07), P = 0.005 | – |
| Male | −0.182 (−0.463, 0.100), P = 0.202 | – |
| BMI (kg/m2) | −0.002 (−0.032, 0.029), P = 0.91 | – |
| Persistent AF | −0.192 (−0.447, 0.063), P = 0.14 | −0.145 (−0.391, 0.10), P = 0.241 |
| AF duration (months) | −0.002 (−0.005, 0.001). P = 0.21 | – |
| Hypertension | −0.146 (−0.409, 0.117), P = 0.27 | – |
| Diabetes | −0.239 (−0.863, 0.386), P = 0.45 | – |
| Stroke | −0.12 (−0.57, 0.33), P = 0.59 | – |
| Vascular disease | 0.15 (−0.47, 0.76), P = 0.64 | – |
| Class Ia/III AAD | 0.03 (−0.25, 0.31), P = 0.83 | – |
| LA area (cm2) | −0.001 (−0.030, 0.029), P = 0.96 | – |
| RA area (cm2) | −0.023 (-0.052, 0.005), P = 0.105 | – |
OSA severity comprises three categories: nil–mild AHI < 15 (reference), moderate AHI 15–30, severe AHI ≥ 30. Hypertension included in multivariable analysis.
AAD, anti-arrhythmic drug; AF, atrial fibrillation; AHI, apnoea–hypopnoea index; BMI, body mass index; LA, left atrial; OSA, obstructive sleep apnoea.
Association of atrial fibrillation phenotype with atrial substrate
The distribution of OSA severity according to AF phenotype was as follows: paroxysmal AF: nil 22%, mild 33%, moderate 25%, and severe 20%; persistent AF: nil 7%, mild 37%, moderate 25%, and severe 33% (P = 0.27).
Higher left atrial voltages were associated with paroxysmal vs. persistent AF (1.81 ± 0.43 mV vs. 1.58 ± 0.59 mV, P < 0.05). The paroxysmal AF cohort was observed to harbour patchy discrete regions of low voltage (Figures 2and3) while the persistent AF group exhibited diffuse regions of low voltage (Figure 4). Focal analysis was performed at regions of low voltage in paroxysmal AF patients and compared with global LA parameters. While global LA conduction slowing was not observed, slowed conduction associated with regions of low voltage [Mean bipolar voltage (low-voltage zone vs. global LA): 0.17 ± 0.1 mV vs. 1.30 ± 0.28, P < 0.001 and conduction velocity: 22.45 ± 12.00 cm/s vs. 35.96 ± 12.25 cm/s, P = 0.014].
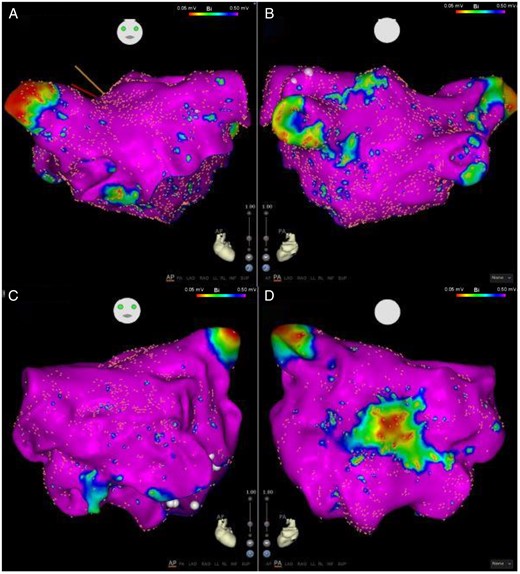
Anterior (A) and posterior (B) views of a left atrial map of a patient with no OSA (AHI 4.3). Minimal low-voltage regions observed. Anterior (C) and posterior (D) views of a left atrial map of patient with severe OSA (AHI 41.6) shows a circumscribed well delineated region of low voltage on the posterior wall. Note that the remainder of the atrium has normal voltage. AHI, apnoea–hypopnoea index; OSA, obstructive sleep apnoea.
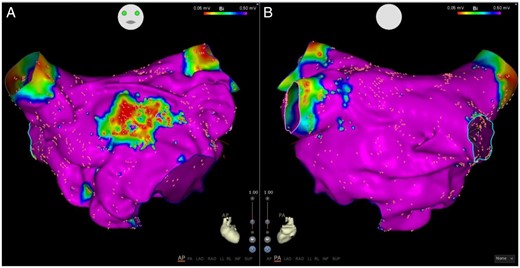
Anterior (A) and posterior (B) views of a left atrial voltage map in a patient with paroxysmal AF with severe OSA (AHI 32) shows a well demarked region of low voltage on the anterior wall with preserved voltage elsewhere. AF, atrial fibrillation; AHI, apnoea–hypopnoea index; OSA, obstructive sleep apnoea.
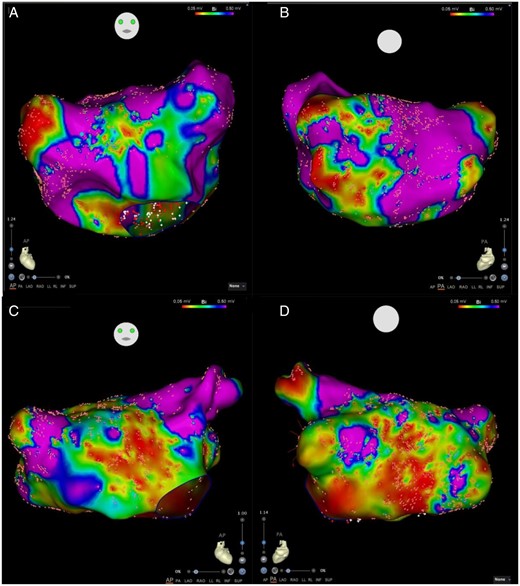
Comparison of left atrial voltages in patients with persistent AF. Anterior (A) and Posterior (B) views of a left atrial map of a patient with no-mild OSA (AHI 7.4). Anterior (C) and Posterior (D) views of a left atrial map of patient with severe OSA (AHI 61.7). Both maps show diffuse substrate with low voltage distributed among most atrial segments. AF, atrial fibrillation; AHI, apnoea–hypopnoea index; OSA.
Reduction of bipolar LA voltage (paroxysmal: r = −0.50, P = 0.002 persistent: r = 0.20, P = 0.299), increased proportion low-voltage points (paroxysmal: r = 0.59, P < 0.001 and persistent r = 0.31, P = 0.1) and increased voltage/conduction heterogeneity (voltage CoV: paroxysmal r = 0.52, P = 0.001 and persistent r = 0.40, P = 0.03; conduction CoV: paroxysmal r = 0.35, P = 0.038 and persistent r = 0.20, P = 0.28) correlated with increasing AHI among paroxysmal but not persistent AF (with the exception of voltage heterogeneity) (Figure 5). Furthermore, in paroxysmal AF the association of AHI with decreased bipolar LA voltage [−0.015 (−0.025, −0.005), P = 0.004] and increased voltage heterogeneity [0.455 (0.197, 0.713), P = 0.008] persisted even after multivariable analysis (Supplementary material online).
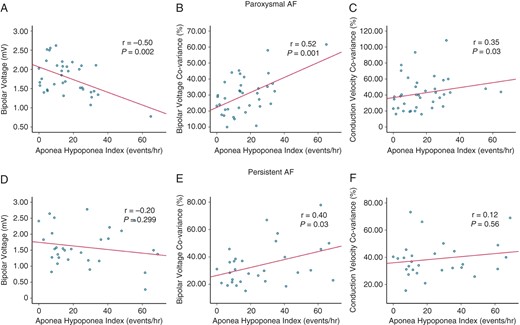
Apnoea–hypopnoea index correlates with measures of atrial substrate in paroxysmal AF but are less robust in persistent AF. (A–C) LA bipolar voltage, voltage heterogeneity and conduction heterogeneity correlate with AHI in paroxysmal AF. (D–F) Only voltage heterogeneity correlates with AHI in persistent AF. Voltage heterogeneity increases with greater AHI in both paroxysmal and persistent AF but the association is less robust in persistent AF. (B, E) P-values refer to Pearson’s correlation. AF, atrial fibrillation; AHI, apnoea–hypopnoea index; LA, left atrial.
Across groups of OSA severity with paroxysmal AF, patients with nil–mild (AHI 0–15) and moderate (AHI 15–30) OSA were observed to have comparable degrees of atrial remodelling. However, when mild, moderate, and severe OSA were compared, markers of atrial remodelling in patients with severe OSA (AHI ≥ 30) were significantly more advanced [mean atrial voltage (mV): 1.92 ± 0.42 vs. 1.84 ± 0.28 vs. 1.34 ± 0.41 P = 0.006, low-voltage points (%): 19.77 ± 9.19 vs. 17.73 ± 5.42 vs. 36.51 ± 8.44 P = 0.001, complex points (%): 4.28 ± 2.16 vs. 9.10 ± 9.20 vs. 11.92 ± 0.844 P = 0.02]. In contrast, there were no significant differences between OSA severity groups in the persistent AF cohort [mean atrial voltage (mV): 1.67 ± 0.55 vs. 1.50 ± 0.66 vs. 1.55 ± 0.67 P = 0.82, low voltage points (%): 22.81 ± 11.17 vs. 27.86 ± 16.66 vs. 31.21 ± 26.84 P = 0.56, complex points (%): 5.74 ± 3.21 vs. 8.23 ± 2.54 vs. 7.25 ± 3.59 P = 0.26). These data indicate that AHI ≥ 30 may mark a threshold point for advanced remodelling in paroxysmal but not persistent AF (Figure 6).
![Severe OSA (AHI ≥ 30) is associated with a more remodelled atrium [(A) mean LA bipolar voltage (B) mean complex points, (C) mean low-voltage points] amongst paroxysmal but not persistent AF cohorts. P-value refers to one-way ANOVA comparing paroxysmal AF OSA severity groups. *P < 0.05, **P < 0.01 refer to between groups comparison with Bonferroni post hoc tests. AF, atrial fibrillation; LA, left atrial; OSA, obstructive sleep apnoea.](https://oup.silverchair-cdn.com/oup/backfile/Content_public/Journal/europace/23/5/10.1093_europace_euaa275/1/m_euaa275f6.jpeg?Expires=1748027720&Signature=eI4p1aT8BAQWCivzP7Yqb9jbAl4vsfP-2Awd5SNnTUcBrWRxsS8u5MhpvtRttWUjOPNcf41w6hQQx4hQ4mxD1jRWxitvvwycbBZovKXG-sBhIIXTwOtNneCUQlKU1f-MeKA5PVj-ub-DTQCtaLJHhVATrOAeiKqbAePOxZTP492hpLhgRsjkmytiuxF5g7yW2y1gZN26rioz4kWmA~dnDlKA4wuXQOD0gilQWbLXT9tkSNkNP9y3BLpJEB1WSeie1wJL6AN7Ves0o1yK4NE0TFZ5857iqdJW0Y-Ys8qKKtvbvcdasF-PEkRzK4ApdE5bCU0Eo0tFSblKULCB6F5nbA__&Key-Pair-Id=APKAIE5G5CRDK6RD3PGA)
Severe OSA (AHI ≥ 30) is associated with a more remodelled atrium [(A) mean LA bipolar voltage (B) mean complex points, (C) mean low-voltage points] amongst paroxysmal but not persistent AF cohorts. P-value refers to one-way ANOVA comparing paroxysmal AF OSA severity groups. *P < 0.05, **P < 0.01 refer to between groups comparison with Bonferroni post hoc tests. AF, atrial fibrillation; LA, left atrial; OSA, obstructive sleep apnoea.
Discussion
The main findings of this high-density mapping study characterizing the AF substrate in OSA are as follows:
Increasing AHI correlates with an increasingly remodelled LA characterized by lower bipolar voltage, greater voltage/conduction heterogeneity, and higher proportions of low voltage and complex points.
The association of AHI with LA remodelling is more apparent among paroxysmal compared with persistent AF.
The impact of OSA severity on the atrial substrate appears to be dose dependent. AHI ≥ 30 indicates a threshold at which atrial remodelling in paroxysmal AF becomes more advanced. In contrast, persistent AF is associated with advanced atrial remodelling across categories of AHI.
Obstructive sleep apnoea and the atrial substrate
The results of the present study are broadly consistent with existing data that associate OSA status with an increasingly remodelled atrial substrate.7,8 The substrate difference between OSA and non-OSA patients are marked by lower atrial voltages, and this has consistently been observed across studies to date.
While previous studies have made general observations about the association of categorical OSA diagnosis with the atrial substrate, none have shown an independent association between measures of atrial remodelling (lower atrial voltage, complex points, and low-voltage points), and AHI as a continuous variable. Our results imply a dose-dependent relationship between the two variables. Clinical data suggesting poorer efficacy of rhythm control strategies among AF cohorts with increasingly severe OSA, support this conclusion.17
Stratification of AHI by OSA severity and subgroup analysis based on AF phenotype, observed that the correlation was driven by paroxysmal vs. persistent AF. The persistent AF cohort was characterized by a more remodelled diffuse substrate irrespective of AHI. In contrast, the pattern of remodelling in paroxysmal AF was patchy and discrete with a clear escalation of atrial remodelling when AHI was ≥ 30. Supervening arrhythmia in persistent AF can drive atrial remodelling through multiple mechanisms that include an abbreviation of the effective refractory period and enhancement of atrial fibrosis. Secondly, patients with persistent AF may represent a group with more prevalent concomitant AF risk factors that can react synergistically to accelerate atrial remodelling.18 Simultaneous mechanisms for remodelling in persistent AF coupled with the remodelling effects of persistent AF itself may dilute the apparent impacts of OSA alone on the atrial substrate.
Multiple mechanisms including atrial stretch, autonomic dysregulation, and abnormalities of gas exchange,19 have been invoked to describe the relationship of AF with OSA. In particular, large swings of intra-thoracic pressures during apnoea may enable remodelling at atrial sites vulnerable to atrial stretch such as the posterior LA (Figure 2D). Existing observational data evaluating the impact of sleep apnoea management on AF profile arbitrarily utilizes an AHI cut-off ≥ 15 (moderate OSA based on AASM criteria10) for therapy. Contemporary data indicate attenuation and reversal of atrial arrhythmias following aggressive management of all AF lifestyle risk factors (obesity/overweight, hypertension, diabetes, alcohol/tobacco, and OSA).20 Whether OSA management alone would have such a potent impact remains unclear. Patients with significant OSA and AF derive variable anti-arrhythmic benefit from sleep apnoea management, and there exists little evidence delineating the most affected subgroups. The present data highlight paroxysmal AF cohorts with severe OSA as a group well poised to derive maximal anti-arrhythmic benefit from OSA treatment. This observation is consistent with results from a recent small randomized trial that did not show any benefit of OSA management in persistent AF participants having cardioversion.6
Impact of high-density mapping
Lower voltage but not slower conduction correlated with increasing AHI. The absence of correlation between AHI and conduction velocity may be explained by the patchy distribution of atrial substrate especially evident in paroxysmal AF. Slowed conduction at confined atrial zones is not accurately reflected in the global atrial analysis. However, the patchy substrate was reflected by an association between heterogeneous distribution of voltage and conduction. Focused analysis at patchy zones of low voltage showed co-localization of slowed conduction.
Unlike previous investigators that observed localization of substrate to the anterior LA, we did not identify a unique regional substrate for OSA.8Low-density mapping can overlook substrate at other atrial regions. Alternatively, maps with low point densities are liable to over-estimate the extent of the substrate in the absence of closely spaced points to accurately define its boundaries. This is the first study to date that utilizes high-density mapping to define the atrial substrate in OSA.
Differences in atrial remodelling in paroxysmal vs. persistent AF may have implications for clinical management. Firstly, these observations highlight the role of early upstream risk factor management to attenuate or reverse atrial remodelling that leads to persistent AF. Secondly, OSA management may carry different magnitudes of benefit across AF phenotypes and OSA severity. Patients with paroxysmal AF and severe OSA may enjoy the greatest anti-arrhythmic benefits following OSA treatment. Finally, different patterns of substrate in paroxysmal vs. persistent AF may enable a patient-tailored approach to AF ablation in OSA populations depending on the AF phenotype that includes posterior wall isolation and isolation of fibrotic areas.21,22
Limitations
While these data provide provocative insights into the association between OSA and atrial remodelling across AF phenotypes, it does not prove the causal relationship and cannot directly address the important clinical question of the impact of OSA treatment on reverse atrial remodelling. Secondly, while the present analysis observed that AHI/OSA severity was an independent predictor in paroxysmal but not persistent AF, we acknowledge that there may be too few patients in the persistent AF cohort to draw definitive conclusions. However, the analysis makes the point that AHI/OSA severity has a stronger association with LA voltage in paroxysmal vs. persistent AF. We speculate from observed associations between OSA severity and high-density mapping data, that paroxysmal AF patients with severe sleep apnoea may derive the greatest benefit. Studies that evaluate the impact of OSA management alone on the substrate for AF are needed. Secondly, the association of improved AF profile with OSA management are derived entirely from observational data. Randomized evidence is needed to confirm the anti-arrhythmic benefit of OSA diagnosis/treatment and bring it within the mandated paradigm for AF management.
Conclusion
Obstructive sleep apnoea severity is differentially associated with the atrial substrate for AF based on the AF phenotype. Persistent AF represents a more remodelled atrium irrespective of AHI. Atrial remodelling in paroxysmal AF has a dose-dependent association with OSA severity that is most apparent in severe OSA. These observations strengthen the case for OSA management in AF and may carry significant implications for identifying the subgroup that will derive optimal anti-arrhythmic benefit.
Supplementary material
Supplementary material is available at Europace online.
Funding
The National Health and Medical Research Council (NHMRC) research scholarship to C.J.N., R.P., G.R.W., A.V., and H.S.; Practitioner fellowships from the NHMRC to J.K. and P.S.; J.K. has reported receiving research support from Biosense Webster, Boston Scientific, Abbott, and Medtronic and has served on the advisory board of Boston Scientific and Biosense Webster.
Conflict of interest: none declared.
Data availability
The data underlying this article will be shared on reasonable request to the corresponding author.
