


Abstract
Myocardial fibrosis is a hallmark of atrial fibrillation (AF) and its characterization could be used to guide ablation procedures. Late gadolinium enhanced-magnetic resonance imaging (LGE-MRI) detects areas of atrial fibrosis. However, its accuracy remains controversial. We aimed to analyse the accuracy of LGE-MRI to identify left atrial (LA) arrhythmogenic substrate by analysing voltage and conduction velocity at the areas of LGE.
Late gadolinium enhanced-magnetic resonance imaging was performed before ablation in 16 patients. Atrial wall intensity was normalized to blood pool and classified as healthy, interstitial fibrosis, and dense scar tissue depending of the resulting image intensity ratio. Bipolar voltage and local conduction velocity were measured in LA with high-density electroanatomic maps recorded in sinus rhythm and subsequently projected into the LGE-MRI. A semi-automatic, point-by-point correlation was made between LGE-MRI and electroanatomical mapping. Mean bipolar voltage and local velocity progressively decreased from healthy to interstitial fibrosis to scar. There was a significant negative correlation between LGE with voltage (r = −0.39, P < 0.001) and conduction velocity (r = −0.25, P < 0.001). In patients showing dilated atria (LA diameter ≥45 mm) the conduction velocity predictive capacity of LGE-MRI was weaker (r = −0.40 ± 0.09 vs. –0.20 ± 0.13, P = 0.02).
Areas with higher LGE show lower voltage and slower conduction in sinus rhythm. The enhancement intensity correlates with bipolar voltage and conduction velocity in a point-by-point analysis. The performance of LGE-MRI in assessing local velocity might be reduced in patients with dilated atria (LA diameter ≥45).
Areas of fibrosis detected by late gadolinium enhanced-magnetic resonance imaging (LGE-MRI) using a detailed, systematic, operator-independent analysis, correlates with arrhythmogenic substrate detected through bipolar voltage and conduction velocity.
The performance of LGE-MRI to predict local conduction velocity seems to be lower in patients with dilated left atria.
Introduction
In recent years, catheter ablation has become an effective therapy for atrial fibrillation (AF). Pulmonary vein isolation (PVI) is the cornerstone of ablation procedures, especially in paroxysmal AF. In persistent AF, however, mechanisms sustaining prolonged arrhythmic events commonly include further complex atrial substrates and triggers beyond the pulmonary veins, eventually resulting in unsatisfactory outcomes of PVI when performed alone. In this regard, preclinical and clinical work has established that atrial fibrosis is the main contributor to the arrhythmogenic substrate maintaining AF in these patients.1
The atrial arrhythmogenic substrate may be characterized during ablation procedures through high-density mapping, by the identification of low-voltage areas (LVAs) or areas of a decreased conduction velocity (CV).2,3 Experimental research suggests that CV in the left atrium (LA) is also altered as a consequence of myocardial fibrosis.1,4 Rolf and collaborators emphasized the importance of LVAs in the evaluation of the arrhythmic substrate,5 and subsequent work showed that LVAs may predict AF recurrences after catheter ablation.3 Therefore, despite conflicting evidence, it is conceivable that the ablation of LVAs increases the effectiveness of ablation procedures solely targeting PVI.6 However, these parameters can only be assessed during invasive procedures. Non-invasive tools have been developed in recent years to characterize the arrhythmogenic substrate. Electrocardiographic imaging has been used to identify potential AF drivers with hitherto little success in clinical practice. Characterization of the LA by late gadolinium-enhanced magnetic resonance imaging (LGE-MRI) has been proposed as an attractive non-invasive tool to visualize atrial fibrosis.7 Previous studies have correlated intra-cavitary voltage7–10 and CV11 with LGE-MRI data, but the use of operator-dependent and rough techniques jeopardize the robustness of results and the applicability of LGE-MRI to fine-tuning and personalizing ablation procedures.
In this study, we aimed to evaluate the accuracy of LGE-MRI at a point-by-point level to assess the native atrial arrhythmogenic substrate and study whether this accuracy depends on LA size. For these purposes, we conducted a point-to-point correlation between high-density electroanatomic maps (EAM) focusing on both bipolar voltage and local CV, and LGE-MRI, and took advantage of a semi-automatic, systematic, reproducible, and largely operator-independent fusion method.
Methods
Patient selection
Sixteen patients who underwent their first AF ablation in our centre from January 2018 to January 2019 were included. Only patients without contraindication for MRI who presented optimal quality in the LGE sequence and who were in sinus rhythm (SR) at the beginning of the procedure and throughout the acquisition of EAM were included. Further exclusion criteria are listed in Table 1. Patient characteristics including age, gender, comorbidities, and type of AF were recorded. Written informed consent was obtained; the research protocol was reviewed and approved by the local research ethics committee (reference HCB/2017/0509).
Inclusion and exclusion criteria
| Inclusion criteria | Exclusion criteria |
|---|---|
|
|
| Inclusion criteria | Exclusion criteria |
|---|---|
|
|
AF, atrial fibrillation; LA, left atrium; LV, left ventricle; LVEF, left ventricle ejection fraction; MRI, magnetic resonance imaging; SR, sinus rhythm.
Magnetic resonance imaging
If the patient was in AF before the MRI, electrical cardioversion was performed under deep sedation. Magnetic resonance imaging acquisition was performed <2 weeks before the ablation using a 3-Tesla scanner (Magnetom Trio, Siemens Healthcare, Erlangenm Germany) and a 32-channel cardiac coil. An intra-venous bolus of 0.2 mmol/kg gadobutrol (Gadovist, BayerSchering, Berlin, Germany) was administered 20 min before the acquisition. A free-breathing three-dimensional (3D) navigator and ECG-gated inversion recovery gradient-echo sequence were applied in axial projection. The voxel size acquired was 1.25 × 1.25 × 2.5 mm3. Other typical sequence parameters were 2.3 ms repetition time, 1.4 ms echo time, 11° flip angle, 460 Hz/pixel bandwidth, and 280–380 ms inversion time (TI). A TI scout sequence was used to nullify myocardial signal and determine optimal TI. Complete LA coverage was typically obtained with 40–50 slices.
Late gadolinium-enhanced magnetic resonance imaging post-processing
The LA was segmented in the LGE-MRI using ADAS-AF® image post-processing software (Galgo medical SL, Barcelona, Spain). The mid-myocardial (50% thickness) layer was manually drawn on each axial plane and was automatically adjusted by the software to build a 3D shell. The pulmonary vein at the ostia and the mitral valve were removed for analysis of fibrosis. The signal intensity was normalized to the LA blood pool intensity as described previously.12 The image intensity ratio (IIR) was calculated as the ratio between the signal intensity of each pixel and the mean blood pool intensity in every patient. Each IIR value was projected onto the mid-myocardial 3D shell and colour-coded as healthy (IIR < 1.20), interstitial fibrosis (1.20 ≥ IIR < 1.32), or dense scar (IIR ≥ 1.32), according to thresholds proposed by Benito et al.13 (Figure 1C).

Representative maps obtained for correlation analyses. Posteroanterior view of the left atrium. (A) Local voltage map. The zones with voltage >0.5 mV are shown in purple and the red zone denotes voltage <0.1 mV. Green, yellow, and blue represent intermediate voltages. (B) Local activation map. From green to pink, early to late activation. (C) Gadolinium enhancement intensity in MRI. The healthy tissue (IIR < 1.20) area is represented in dark blue, scar (IIR ≥1.32) is shown red and intermediate colours (blue to red) denote interstitial fibrosis (1.20 ≥ IIR < 1.32). IIR, image intensity ratio; MRI, magnetic resonance imaging.
Electrophysiological mapping
Trans-oesophageal echocardiography was performed in all patients <24 h before ablation to rule out the presence of an intra-atrial thrombus. The ablation and EAM acquisition protocol were performed as described previously.13Three-dimensional (3D) position coordinates were recorded with CARTO 3 (Biosense Webster, Diamond Bar, CA, USA) and a 20-pole circular mapping catheter (LassoNav, Biosense Webster). Peak-to-peak voltages were collected from the 10 dipoles and a high-density bipolar voltage map was created. Left atrial voltage and activation maps were constructed during SR before ablation. Endocardial contact of the mapping catheter was ensured with CARTO 3D catheter stability algorithms and an internal point filter to limit data acquisition to 7 mm from the anatomic shell to reduce mapping in the blood pool (Figure 1A and B).
Analysis of conduction velocity
Subsequently, an activation map of the LA was created for each patient to calculate the local activation time (LAT) and CV. Electrical signals were processed and rendered in 3D to display the LAT at each point and investigate electrical activation patterns. All points were manually reviewed, those recorded during ectopic beats were excluded, and a stable SR electrogram was set as reference. A map representing the time difference between the stable reference and the activation wavefront was constructed. The LA was parameterized using a common reference system following a previously described method.14 The CV between two adjacent points was calculated as the geodesic distance divided by the LAT difference and was expressed in mm/ms. Offline analyses were conducted with Python.
Late gadolinium-enhanced magnetic resonance imaging and electroanatomic maps correlation
A reconstructed surface mesh of the LA and EAM data were extracted from the CARTO mapping system. CARTO points were first projected onto the surface mesh of the EAM by closest point approximation. Then, both the LGE-MRI and CARTO surface meshes were standardized by semi-automatically clipping off pulmonary veins, the LA appendage, and the mitral valve. Both standardized meshes were affine and non-rigidly registered to an LA template mesh. With both meshes in the template space, CARTO points were projected from the EAM surface mesh to the LGE-MRI mesh, enabling point-by-point correlations. An overview of the correlation method described is depicted in Figure 2.15

Characteristic multi-modal workflow for each patient. Scheme of multi-modal data analysis. LA anatomy and tissue type in the LA wall are extracted from LGE-MRI data. A reconstructed EAM is obtained from CARTO points. Spatial correspondence of CARTO points and LGE-MRI-derived LA shape is obtained using a registration-based approach. EAM, electroanatomical map; LA, left atrium; LGE-MRI, late gadolinium enhanced cardiac magnetic resonance. Reproduced from Ref.15
Statistical analysis
Continuous variables are expressed as mean ± standard deviation (SD) and range. Categorical variables are shown as the total number (percentage). We used unpaired t-tests to compare means between groups. The correlation between two quantitative variables was assessed with Pearson’s correlation coefficient. The association between atrial EAM and IIR was fitted in a generalized linear mixed model with random intercept due repeated measures per patient and, given that homoscedasticity assumption was clearly not accomplished, log-transformed data were used. A two-sided type I error of 5% was used for all tests. All analyses were performed using R v3.6.1 (R Project for Statistical Computing; Vienna, Austria).
Results
Patient characteristics
Between January 2018 and January 2019, 88 patients underwent a first AF ablation procedure. In 44 patients, another system than CARTO high-density mapping with a multi-polar mapping catheter was applied. Twenty-six patients were excluded because they did not undergo MRI or their quality was insufficient. One patient with cardiomyopathy and another with no possibility of maintaining SR throughout the LA mapping were also excluded. Finally, a cohort of 16 patients who met the inclusion criteria was prospectively included. Table 2 shows their clinical and cardiac imaging characteristics. The mean age was 63 ± 7 years, AF was paroxysmal in 13 patients (76%), and the average mean time since diagnosis was 21 ± 19 months (range: 2–96 months).
Baseline patient characteristics
| Characteristic | Value |
|---|---|
| Age (years) | 63 ± 7 |
| Sex (male) | 5 (29%) |
| Body mass index | 28 ± 4 |
| Atrial fibrillation pattern | |
| Paroxysmal | 13 (77%) |
| Persistent | 3 (23%) |
| AF duration (months) | 21 ± 19 |
| Arterial hypertension | 8 (50%) |
| Obstructive sleep apnoea | 3 (18%) |
| Diabetes mellitus | 5 (29%) |
| LVEF (%) | 58 ± 6 |
| LA AP diameter (mm) | 43 ± 4 |
| LA volume (mL) | 111 ± 24 |
Data are presented as mean ± SD or N (%).
AF, atrial fibrillation; AP, anteroposterior; LA, left atrium; LVEF, left ventricular ejection fraction.
Bipolar voltage and image intensity ratio
Bipolar electrograms were obtained at 4055 sites in the 16 patients, with an average of 253 ± 139 points per patient and a mean density of mapping points/LA surface of 2.25 points/cm2. The mean overall voltage was 1.46 ± 0.23 mV. These electrograms were subsequently projected into the LGE-MRI shell as mentioned previously. Most electrograms fell into MRI-areas classified as healthy (3549 points, 88%), with 369 (9.1%) electrograms in interstitial fibrosis areas, and 137 (3.4%) in the dense scar. The voltage significantly differed amongst these areas (Figure 3A). The mean electrogram voltage in LGE-MRI areas classified as healthy was 1.59 ± 0.05 mV, being lower in interstitial fibrosis areas (0.79 ± 0.07 mV, P < 0.001 vs. healthy). The lowest voltage (P = 0.002) was observed in electrograms localized at scar areas, with a mean of 0.44 ± 0.1 mV.
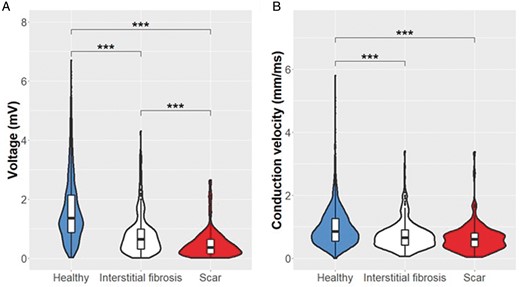
Voltage and conduction velocity distribution. Distribution of the local bipolar voltage (A) and the local CV (B) in the three different regions identified in the LGE-MRI. ***P < 0.001. CV, conduction velocity; LGE-MRI, late gadolinium enhanced-magnetic resonance imaging.
Conduction velocity and image intensity ratio
The mean local CV in the LA of all patients was 0.96 ± 0.23 mm/ms. In the 3549 points classified as healthy, the mean local CV was 1.04 ± 0.06 mm/ms, being significantly lower in interstitial fibrosis areas (0.72 ± 0.07 mm/ms, P < 0.001). The slowest local CV was found in the scar region (0.62 ± 0.08 mm/ms), although it did not reach statistical significance when compared with interstitial fibrosis (P = 0.13). Figure 3B shows the distribution of the local CV among the three regions of the LGE-MRI.
Correlation between voltage, conduction velocity, and image intensity ratio
Voltage and CV at all 4055 points in the EAM were correlated with the LGE-MRI on a point-by-point basis. The overall correlation is depicted in Figure 4 with the data of each patient shown in Figure 5. Data for both the voltage and the CV were non-normally distributed, and their log-transformation was used for correlation analyses. The log-transformed bipolar voltage showed a negative correlation with local IIR (r = −0.39, P < 0.001; Figures 4A and 5A). Correlation plots between voltage and IIR for each patient are shown in Figure 5A, ranging from −0.16 to −0.71.
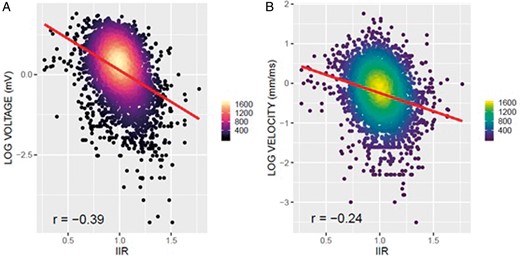
Global correlation between EAM parameters and IIR. Association between voltage, conduction velocity, and IIR. (A) Negative correlation between bipolar voltage and IIR (r = −0.39). (B) Negative correlation between conduction velocity and IIR (r = −0.25). EAM, electroanatomic maps; IIR, image intensity ratio.
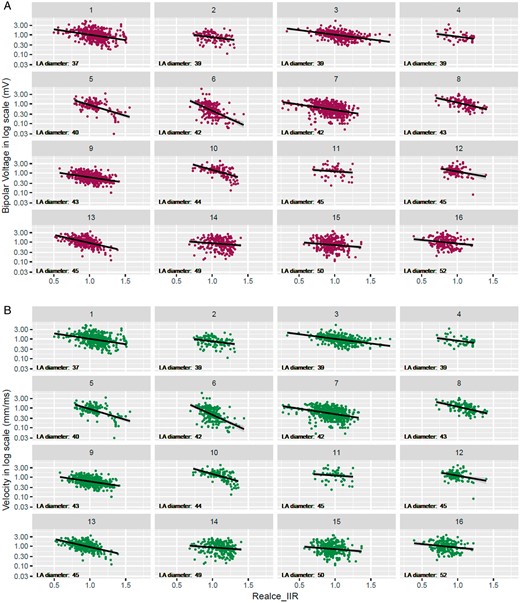
By-patient correlation between EAM parameters and IIR. Scatter plot between EAM and IIR for each individual. The left atrial diameter of each patient is specified. (A) Correlation plots between bipolar voltage and IIR. (B) Correlation plots between CV and IIR. CV, conduction velocity; EAM, electroanatomic maps; IIR, image intensity ratio.
Similarly, a negative correlation was also found between local CV and IIR (Figures 4B and 5B; r = −0.25, P < 0.001). A negative correlation between CV and IIR was found for all patients, with correlation coefficients ranging from −0.06 to −0.56 (Figure 5B).
Impact of left atrium size in correlation indices
The LA size was measured in all patients. Echocardiography showed a mean anteroposterior (AP) diameter of 43 ± 4 mm (range: 37–52) and the MRI demonstrated a mean LA volume of 111 ± 24 mL (range: 75–146). There was no significant correlation between the size of the LA and the mean voltage or CV of each patient (P = 0.50 and P = 0.32, respectively). We subsequently analysed whether LA size had an impact on the accuracy of LGE-MRI to predict both bipolar voltage and CV. We found that LGE-MRI yielded a worse capacity to predict CV as the atrium dilates (significant inverse correlation between the local CV-IIR with LA size, r = −0.54, P < 0.03 for AP diameter; r = −0.34, P < 0.02 for LA volume, Figure 6A). Indeed, the intensity of the association was lower in patients with a dilated atrium (AP diameter ≥ 45 mm, mean r = −0.20 ± 0.13 vs. –0.40 ± 0.09, dilated vs. non-dilated, P = 0.01, Figure 6B). Results remained similar when atrial size was indexed by body surface area (BSA) (r = −0.52, P = 0.037). The intensity of this association was also lower in patients with non-dilated indexed atrium (AP diameter/BSA <24 mm/m2, mean r = −0.19 ± 0.09 vs. −0.39 ± 0.13, not dilated vs. dilated, P = 0.004). Conversely, the accuracy of LGE-MRI to predict voltage did not change over a range of atrial size (r = −0.15, P = 0.57 for AP diameter; r = −0.03, P = 0.92 for LA volume and r = −0.08, P = 0.77 for BSA-indexed LA), and there were no significant differences between dilated and non-dilated atria (−0.39 ± 0.20 vs. –0.34 ± 0.14, P = 0.56).
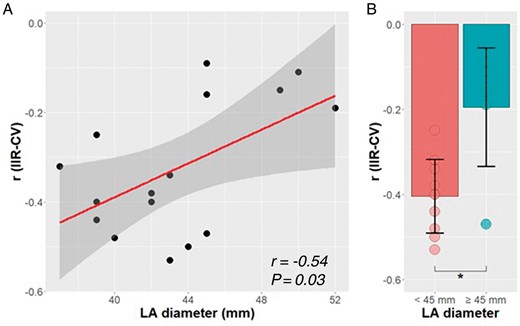
Impact of LA size on LGE-MRI accuracy. Impact of LA size on the magnitude of the association between IIR and CV. (A) Correlation between LA diameter and IIR accuracy. (B) Comparison between IIR accuracy to predict CV and LA size. *P < 0.05. CV, conduction velocity; IIR, image intensity ratio; LA, left atrial diameter; LGE-MRI, late gadolinium enhanced-magnetic resonance imaging.
Discussion
The main findings of the study were that (i) in a point-by-point analysis, more intense LGE correlates with lower bipolar voltage and slower local CV and (ii) left atrial dilation seems to decrease the accuracy of LGE-MRI to predict LA local CV.
Widespread use of late gadolinium-enhanced magnetic resonance imaging warrants accuracy validation
It has been proposed that atrial fibrosis underlies low voltage areas in the EAM, substantiating the use of voltage mapping to characterize the arrhythmogenic substrate in AF patients.2 Magnetic resonance imaging is an evolving technique capable of detecting atrial fibrosis, but its reliability is still disputed. Definitive validation would require the collection of histological samples as the gold standard, but the feasibility of such analyses is limited. Therefore, efforts have focused on comparing LGE-MRI data with surrogate fibrosis parameters such as intra-cavitary voltage and CV maps. Recent studies have compared voltage and LGE intensity by averaging data over relatively large atrial surface areas7 or standard deviations ranges,9 or by comparing fibrotic and non-fibrotic patches.16 Nevertheless, the advent of MRI-guided ablation procedures requires accurate identification of the small fibrotic patches to be targeted. Therefore, while previous studies have shown that LGE-MRI yields an estimate of atrial fibrosis over large areas, these appear insufficient to validate LGE-MRI to guide ablation. Demonstration of accuracy at a much more detailed level (i.e. point-by-point) is warranted.
Detailed mapping shows an inverse correlation between bipolar voltage and late gadolinium-enhanced magnetic resonance imaging
Whether LGE-MRI precisely defines fibrotic patches remains unknown. Harrison and collaborators found a weak point-by-point correlation between non-standardized atrial intensity in LGE-MRI and endocardial voltage in patients undergoing re-do procedures10 but, unfortunately, first cases were not included, and accuracy in predicting CV was not addressed. Our results show a significant correlation between voltage and the normalized IIR in detailed, point-by-point correlation analysis of patients undergoing a first ablation. To reduce variability, we took advantage of a systematic, operator-independent, semi-automatic method, thereby reducing variability associated with operational factors. Moreover, in contrast to previous studies,10,13 we used non-rigid fusion techniques, thereby yielding more accurate analysis.
Although an association between IIR, voltage, and CV has been demonstrated, it is of moderate intensity, as shown between log-transformed voltage and IIR. Technical artefacts and inter-individual variability may partially account for decreased precision, but relevant mismatches between techniques should be considered. It has recently been reported that bipolar voltage during SR can vary regarding the atrial rhythm, the frequency, and the direction of activation waves and might not accurately predict the underlying arrhythmogenic substrate.17Far-field potentials may conceal small local electrograms, therefore atrial fibrosis might remain undetected. Late gadolinium enhanced-magnetic resonance imaging might be a more sensitive technique than SR bipolar voltage to characterize atrial fibrosis.18 Alternatively, it is plausible that interstitial fibrosis at early stages might remain undetected with current MRI sequences.19
Late gadolinium-enhanced magnetic resonance imaging predicts conduction velocity in the left atrium
Although endocardial voltage has been the most extensively used parameter to assess arrhythmogenic remodelling, other parameters have also been tested. Amongst these, CV is particularly attractive because of its contribution to AF pathophysiology.1 However, few studies have addressed the relationship between LGE-MRI and CV. Fukumoto et al.11 found a lower CV in those atrial areas with a higher LGE-MRI-detected fibrosis burden. We show that a higher IIR in the LA myocardium correlates with a lower local CV in a detailed, point-by-point correlation. The slowest CV was localized in the scar area, although it was not significantly different from the CV at interstitial fibrosis areas, likely due to the low number of dense scar points in our cohort of patients without previous ablations. Indeed, post-ablation studies suggest that LGE-MRI is a useful tool to predict conduction block lines and post-ablation gaps.20
Left atrium size impacts late gadolinium-enhanced magnetic resonance imaging accuracy
Left atrial structural remodelling triggers and perpetuates AF, and AF perpetuation induces further structural remodelling. In our study, we found that the accuracy of LGE-MRI to predict CV decreases with atrial dilation, suggesting a better performance in small, less remodelled atria. Indeed, in dilated atria (AP diameter ≥ 45 mm), the ability of LGE-MRI to predict CV is rather low (r generally <−0.2). Conversely, this atrial size-dependent effect was not observed for voltage prediction. The reasons for this finding remain unclear. It is possible that in more remodelled atria (larger, higher fibrosis burden), electrical conduction becomes increasingly anisotropic. This zigzag conduction at a microscopic level might not be properly captured in EAM or may be uncovered only under rapid activation or stimulation. Overall, these findings could explain the low performance of LGE-MRI in previous studies that mostly included patients with dilated LA. It is of note, however, that our results should be confirmed in subsequent, larger studies.
Clinical implications
Previous work demonstrated that dense scar identified in LGE-MRI provides a reliable definition of conduction block lines in patients who have already undergone AF ablation, thereby substantiating its use in re-do procedures.20 However, the accuracy in detecting native fibrotic patches is still unclear. Our results support that MRI can provide a reliable estimate of the presence of interstitial fibrotic patches of variable sizes. Whether ablation or homogenization of patches identified in LGE-MRI truly targets arrhythmogenic mechanisms and improves ablation outcomes is currently being tested in randomized clinical trials (ALICIA -NCT02698631- and DECAAF II -NCT02529319-). Nonetheless, atrial dilation might significantly impact accuracy and should be considered as a potential factor modifying efficacy.
Limitations
While our results are statistically significant and constitute conclusive and clinically relevant findings, the small sample size has to be acknowledged as a limiting factor. Moreover, the inclusion criteria and the specific MRI quality demands of the study imply a certain selection; thus, our findings may not be readily applicable to the general population. We have chosen local voltage and CV as a reference to validate LGE-MRI. Both, local voltage and CV in SR have been used as surrogates of fibrosis, but they do not necessarily represent an arrhythmogenic substrate per se. However, while it would be intriguing to correlate gadolinium enhancement with functional surrogates of arrythmogeneicity, this would have been beyond the scope of this study. Finally, although most processes were operator-independent, segmentation still needed to be manual; of note, however, high inter-operator reproducibility was demonstrated.21
Conclusions
The LGE-MRI showed an inverse association with the electroanatomical mapping in SR, demonstrating the ability of LGE-MRI to delineate the arrhythmogenic substrate of the LA and its possible utility in AF ablation. However, LA dilation could reduce the performance of MRI in this task, being unable to accurately predict the arrhythmogenic substrate in more remodelled atria.
Funding
The present work has been partially funded by research grants from the European Commission, (CATCHME project, contract agreement 633196; Personalize-AF, contract agreement 860974), Instituto de Salud Carlos III (PI16/00435; PI19/00443; PI19/00573); Fundació la Marató TV3 (reference 20152730); and CERCA Programme/Generalitat de Catalunya.
Conflict of interest: L.M. has received honoraria as a lecturer and consultant and has received research grants from Abbot, Biosense Webster, Boston Scientific, and Medtronic. He is a shareholder of Galgo Medical. All remaining authors have declared no conflicts of interest.
Data availability
The data that support the findings of this study are available from the corresponding authors, L.M. and E.G., upon reasonable request. The data are not publicly available due to their containing information that could compromise the privacy of research participants.
