


Atrial fibrillation (AF) is the most common tachyarrhythmia and a significant cause of cardioembolic strokes. Atrial fibrillation is often intermittent and asymptomatic making detection a major clinical challenge. We evaluated a photoplethysmography (PPG) wrist band in individual pulse detection in patients with AF and tested the reliability of two commonly used algorithms for AF detection.
A 5-min PPG was recorded from patients with AF or sinus rhythm (SR) with a wrist band and analysed with two AF detection algorithms; AFEvidence and COSEn. Simultaneously registered electrocardiogram served as the golden standard for rhythm analysis and was interpreted by two cardiologists. The study population consisted of 213 (106 AF, 107 SR) patients. The wrist band PPG achieved individual pulse detection with a sensitivity of 91.7 ± 11.2% and a positive predictive value (PPV) of 97.5 ± 4.6% for AF, with a sensitivity of 99.4 ± 1.5% [7.7% (95% confidence interval, 95% CI 5.5% to 9.9%); P < 0.001] and PPV of 98.1 ± 4.1% [0.6% (95% CI −0.6% to 1.7%); P = 0.350] for SR. The pulse detection sensitivity was lower 86.7 ± 13.9% with recent-onset AF (AF duration <48 h, n = 43, 40.6%) as compared to late AF (≥48 h, n = 63, 59.4%) with 95.1 ± 7.2% [−8.3% (95% CI −12.9% to −3.7%); P = 0.001]. For the detection of AF from the wrist band PPG, the sensitivities were 96.2%/95.3% and specificity 98.1% with two algorithms.
The wrist band PPG enabled accurate algorithm-based detection of AF with two AF detection algorithms and high individual pulse detection. Algorithms allowed accurate detection of AF from the PPG. A PPG wrist band provides an easy solution for AF screening.
A wrist band photoplethysmography (PPG) achieved individual pulse detection with a sensitivity of 91.7 ± 11.2% and a positive predictive value (PPV) of 97.5 ± 4.6% for atrial fibrillation (AF), with a sensitivity of 99.4 ± 1.5% (P < 0.001 between groups) and PPV of 98.1 ± 4.1% (P = 0.350) for sinus rhythm.
Pulse detection sensitivity was less satisfactory in patients with recent-onset AF (arrhythmia duration <48 h) as compared to patients with late AF (≥48 h, 86.7 ± 13.9% vs. 95.1 ± 7.2%; P = 0.001).
The wrist band PPG enabled accurate automated algorithm-based AF detection with sensitivities of 96.2%/95.3% and specificity of 98.1% with two commonly used AF detection algorithms; AFEvidence and COSEn.
The detection of AF did not differ between the PPG and electrocardiogram with AFEvidence (P = 0.51) or COSEn (P = 0.13). A PPG wrist band could provide an easy-to-use solution for AF screening.
Introduction
In global terms, atrial fibrillation (AF) is the most common tachyarrhythmia in clinical practise and a fast-growing public health problem.1 It is estimated that as many as one in four individuals have a lifetime risk for developing AF, and it is associated with a 1.5- to 2.0-fold risk of death and three- to five-fold risk of ischaemic stroke.2 A significant number, 20–30%, of all strokes are caused by AF.3 In addition, although ∼25% of all ischaemic strokes are of unknown cause, there is convincing evidence that most of these are due to thromboembolisms.4
Although AF is usually associated with life-limiting symptoms,5 as many as 40% of patients with AF are asymptomatic.6 It has been reported that asymptomatic AF carries a similar risk of mortality, cardiovascular death, stroke, and thromboembolism as symptomatic AF.6 Thus, the identification of AF patients is a major clinical challenge. It has been claimed that up to two-thirds of AF-related strokes could be prevented if the patient had received anticoagulation therapy.7,8
Novel technologies are needed to improve AF detection as the population ages. A recent meta-analysis suggested that an AF screening programme with initial screening age of 65 years utilizing photoplethysmography (PPG) as the AF screening method would likely be cost-effective.9 Photoplethysmography is an optical non-invasive technology that measures the volumetric variations of blood flow and is often used for heart rate monitoring.10 This study aimed to evaluate the accuracy of a commercially available PPG wrist band in individual pulse detection in AF and to evaluate the reliability of two commonly used AF detection algorithms for PPG-based detection of AF.
Methods
Study design
The study was implemented as a national multi-centre prospective case–control study in three central hospitals in Finland: Kuopio University Hospital (KUH), HUS Helsinki University Hospital, and North Karelia Central Hospital (NKCH). The study design was approved by the Ethics Committee of KUH (237/2017) and registered in ClinicalTrials.gov database (NCT03721601, URL: https://clinicaltrials.gov/ct2/show/NCT03721601).
Consent
The participants were given written information about the study and were given the opportunity to ask questions. All participants provided written informed consent before participation.
Study population
In all, 295 patients were screened in the emergency care departments and cardiological wards between May and September 2017. The researchers, when present in the hospital, were informed by the hospital staff about patients potentially meeting the inclusion criteria. The inclusion criteria were AF or sinus rhythm (SR) based on a 12-lead resting electrocardiogram (ECG) from the same in-hospital treatment period. The exclusion criteria were body mass index (BMI) ≥33 kg/m2, implanted cardiac pacemaker, left bundle branch block, right bundle branch block, and a medical condition requiring immediate treatment that would be delayed by the study measurements.
At first, a total of 110 patients with AF were identified based on the initial 12-lead resting ECG and furthermore 110 patients with SR were recruited. The final rhythm classification was based on 3-lead continuous ECG recording analysed by two experienced cardiologists blinded to the initial 12-lead resting ECG. The 3-lead ECG is our ‘golden standard’ for the rhythm analysis. In five cases, the rhythm on the 3-lead ECG differed from the initial 12-lead ECG. In addition, seven patients were excluded due to inadequate quality of data or inconclusive rhythm. Based on the 3-lead ECG, a total of 106 patients were assigned in the AF group and 107 patients in the control SR group. Thus, the final study population consisted of 213 patients. The study flow diagram is presented in Figure 1.
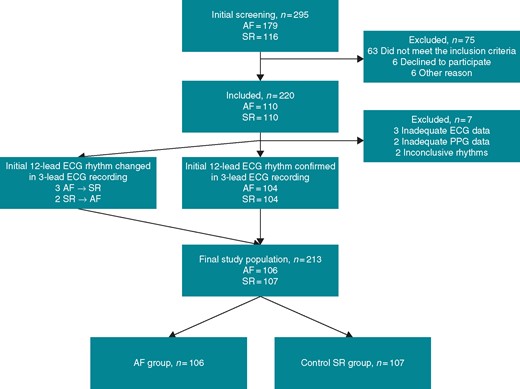
STARD flow diagram of the study. STARD 2015 Checklist and information about STARD 2015 are provided as Supplementary material online, Appendix S1. Patient recruitment was performed on occasional days when the researchers were present in the hospital. The hospital nursing and medical staff informed the researchers about patients with diagnosed AF or SR and probably fulfilling the inclusion criteria. A total of 295 patients were screened in the participating hospitals by the researchers. At first, 220 patients (110 AF and 110 SR) were recruited based on the 12-lead resting ECG interpreted by the treating physician. Seventy-five patients were excluded due to failure to meet the inclusion criteria, refusal to participate in the study, or other reasons. The other reasons included: three study equipment malfunctions, two altered rhythms (as seen on the patient monitor), and one ‘no common language with the patient’. The rhythm of the 3-lead ECG registration was interpreted by two experienced cardiologists blinded to the initial 12-lead ECG. In case of disagreement, the rhythm was discussed until the cardiologists agreed on the interpretation of the rhythm. The rhythm was confirmed to be unaltered in 208 of the cases. In five cases, the rhythm had altered. Seven patients were excluded due to inadequate quality of data or inconclusive rhythm. A total of 106 patients were assigned in the AF group and 107 patients in the control SR group, respectively. AF, atrial fibrillation; ECG, electrocardiogram; SR, sinus rhythm; STARD, Standards for Reporting Diagnostic accuracy studies.
Data acquisition
A 12-lead resting ECG was first recorded for a period of 10 s and interpreted by the treating physician. This was followed by a simultaneous 5-min 3-channel ECG and PPG wrist band recording. The time period elapsing between the initial 12-lead ECG and the study registration varied from a few minutes to several hours. The clinical characteristics of the patients as well as concomitant diseases and medications were documented.
Electrocardiogram was recorded using a 3-lead Holter ECG device (Faros 360, Bittium, Oulu, Finland). For PPG recordings, the Empatica E4 wrist band (Empatica Inc., Cambridge, USA) was used. The wrist band records an optical PPG signal utilizing a blood volume pulse (BVP) method. Before starting the registrations, patients were lying in the supine position for at least 2 min. After the 2-min rest, 5-min 3-lead ECG and PPG were registered simultaneously in the supine position.
Electrocardiogram analysis
The 3-lead 5-min ECG rhythm analysis was conducted by two experienced cardiologists blinded to the initial ECG. The cardiologists’ interpretation of the 3-lead ECG rhythm was used as the ‘golden standard’.
The 5-min 3-lead ECG was analysed with a 1000 Hz sampling frequency simultaneously with the PPG. A Kubios HRV Premium software version 3.1.0 (Kubios Oy, Kuopio, Finland) was used for R-peak detection. In addition, the detection of R-peaks was visually confirmed (Figure 2A–C). This was used as a reference for the pulse detections estimated from the PPG signal. AFEvidence and COSEn algorithms were respectively applied to analyse AF detection performance from the 3-lead ECG. The detected R-peaks were also used in the calculation of the PPG amplitude changes evoked by individual pulses, even for those pulses that were not detected from the PPG signal.
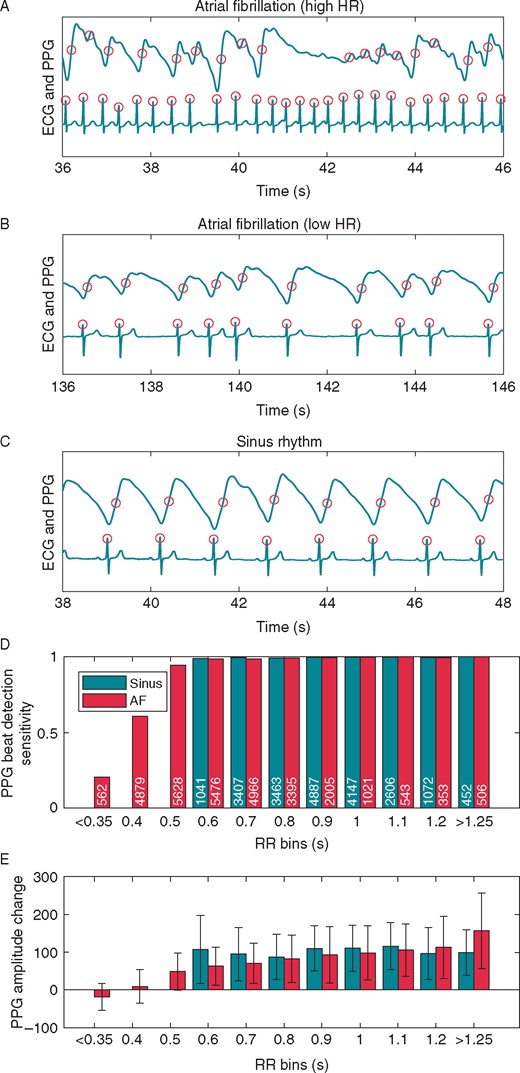
Example ECG and PPG data samples from three different subjects and analysis of all the individual pulses divided into bins. Detected individual pulses are marked with circles in AF samples (A, B) and in SR sample (C). In the case of rapid AF (sample A), some pulses with a low RR interval are not detected from the PPG signal due to the low PPG amplitude. Analysis of all of the individual pulses detected from the ECG data divided into bins according to RR intervals and rhythm type are shown in D and E: SR or AF. For example, the RR bin 0.6 includes all RR intervals between 0.551 and 0.650 s. (D) The bar height represents the sensitivity of pulse detection from PPG for all the pulses within each bin. The value denotes the pulse count in the bar. Values for bins with less than 150 pulses are not shown. (E) The bar height represents the amplitude change (mean and SD) of the PPG signal from a 0.3 s window after each pulse detection from ECG. The negative AF PPG amplitude change with RR bins <0.35 s is due to the lowering of the PPG signal as seen in the AF sample in A. AF, atrial fibrillation; ECG, electrocardiogram; HR, heart rate; PPG, photoplethysmography; SR, sinus rhythm.
Processing and analysing photoplethysmography
The PPG signal was measured with the Empatica E4 wrist band sensor with a 64 Hz sampling frequency. Photoplethysmography data were transferred to MATLAB® software version R2017b for pre-processing and analysis. To increase the time resolution of pulse detection, the raw PPG data were first interpolated at 128 Hz with cubic spline interpolation. The PPG data were then bandpass filtered with a 0.1–7 Hz passband to remove baseline drift and high frequency noise. The derivative of the PPG signal (dPPG) was calculated as the difference of two values separated by 16 samples (dPPG(i) = PPG(i + 8) − PPG(i − 8)), which corresponds to 0.125 s difference.
Individual pulses were detected from the dPPG when the value exceeded a threshold calculated as half of the standard deviation of dPPG within a 5-s window. The minimum inter-pulse-interval was set as 0.25 s. The pulse detection time was finally fixed at the point where the PPG signal amplitude reached the mean of the previous local minimum and next local maximum (Figure 2A–C).
A pulse-to-pulse interval (PP interval) time series was formed from the time intervals between successive pulse detections, and the AFEvidence and Coefficient of Sample Entropy (COSEn) were calculated for the assessment of AF. The AFEvidence algorithm is based on relative population of segments in a 2D histogram which is a Lorentz plot’s numeric representation of dRR intervals.11 The COSEn algorithm is an entropy estimate optimized for the detection of AF.12
AFEvidence and COSEn were utilized to assess the possibilities of exploiting automated AF detection using wrist attached PPG devices. The receiver operating characteristic (ROC) curves and F1-scores were applied to evaluate the performances of the algorithms with different data lengths. The pulse detection sensitivity and positive predictive value (PPV) were calculated for 3-min PPG data lengths. The sensitivity and specificity of the algorithms for AF detection were calculated for 2-min data lengths.
Statistical analysis
The sample size was estimated as 200 observations with an assumed sensitivity of 95% with the method and with a 3% margin error. Clinical characteristic data were analysed using IBM SPSS statistics software version 25. The χ2 tests, Fisher’s exact tests, or t-tests were applied to test differences between the groups. All significance tests were two-tailed with P ≤ 0.05 considered statistically significant. The difference between the algorithms were tested by the McNemar tests.
The correlation between the PPG amplitude change and the RR interval was examined at a subject-level with Spearman’s rank correlation. Correlation coefficient mean values with statistical significance and the number of subjects with P < 0.001 were calculated for each group.
Results
Clinical characteristics
The study population consisted of 106 patients with AF and 107 patients with SR (Table 1). Of the AF patients, 43 (40.6%) were recent-onset AF (duration < 48 h) and 63 (59.4%) were late AF cases (duration ≥ 48 h) (Supplementary material online, Table S2). In the AF group, 61 (57.5%) and in the SR group, 59 (55.1%) were male (AF vs. SR P = 0.72). Atrial fibrillation patients were older than their SR controls [72.0 ± 14.3 vs. 54.5 ± 18.6 years; mean difference −17.5 (95% confidence interval, 95% CI −22.0 to −13.0); P < 0.001] and presented more often with a history of paroxysmal AF, hypertension, and congestive heart failure; they were more often receiving anticoagulation, beta-blocker, and digoxin therapy than the SR patients. Atrial fibrillation patients were also more likely to report palpitations and abdominal pains than the SR patients, but patients with SR were more likely to complain of chest pains. There were no differences between AF and SR patients with respect to the other clinical characteristics.
Patient demographics
| AF group n = 106 | SR group n = 107 | Significance (2-sided) | Mean difference and (95% CI of the difference) | ||
|---|---|---|---|---|---|
| Characteristics | Age (years) | 72.0 ± 14.3 | 54.5 ± 18.6 | <0.001 | −17.52 (−22.00 to −13.05)a |
| BMI (kg/m2) | 25.2 ± 3.0 | 25.3 ± 3.2 | 0.873 | 0.07 (−0.77 to 0.91)a | |
| Sex, male | 61 (57.5) | 59 (55.1) | 0.723 | 2.41 (−10.74 to 15.44) | |
| Medical history | Earlier AF episode | 87 (82.1) | 32 (29.9) | <0.001 | 52.17 (39.69 to 62.14) |
| Hypertension | 66 (62.3) | 45 (42.1) | 0.003 | 20.21 (6.79 to 32.63) | |
| Coronary heart disease | 29 (27.4) | 23 (21.5) | 0.319 | 5.86 (−5.68 to 17.23) | |
| Diabetes | 22 (20.8) | 12 (11.2) | 0.057 | 9.54 (−0.37 to 19.40) | |
| Congestive heart failure | 21 (19.8) | 2 (1.9) | <0.001 | 17.94 (9.95 to 26.63) | |
| Heart surgery history | 14 (13.2) | 4 (3.7) | 0.013 | 9.47 (1.93 to 17.54) | |
| Other arrhythmia | 13 (12.3) | 8 (7.5) | 0.241 | 4.79 (−3.46 to 13.21) | |
| Structural heart defect | 11 (10.4) | 5 (4.7) | 0.114 | 5.70 (−1.63 to 13.43) | |
| Medication | Anticoagulation therapy | 79 (74.5) | 21 (19.6) | <0.001 | 54.90 (42.47 to 64.65) |
| Beta-blocker | 77 (72.6) | 42 (39.3) | <0.001 | 33.39 (20.21 to 44.95) | |
| Digoxin | 16 (15.1) | 0 (0.0) | <0.001 | 15.09 (8.52 to 23.12) | |
| Other anti-arrhythmia medication | 9 (8.5) | 3 (2.8) | 0.069 | 5.69 (−0.78 to 12.79) | |
| Symptoms prior to hospital admission | Fatigue | 59 (55.7) | 50 (46.7) | 0.192 | 52.86 (42.07 to 62.14) |
| General state decline | 48 (45.3) | 42 (39.3) | 0.373 | 6.03 (−7.13 to 18.91) | |
| Heart palpitation | 44 (41.5) | 30 (28.0) | 0.039 | 13.47 (0.69 to 25.67) | |
| Respiratory distress | 24 (22.6) | 27 (25.2.) | 0.658 | −2.59 (−13.94 to 8.86) | |
| Dizziness or syncope | 15 (14.2) | 10 (9.3) | 0.276 | 4.81 (−4.03 to 13.74) | |
| Paralysis or numbness | 11 (10.4) | 12 (11.2) | 0.844 | −0.84 (−9.46 to 7.80) | |
| Chest pains | 8 (7.5) | 19 (17.8) | 0.025 | −10.21 (−19.30 to −1.20) | |
| Nausea | 7 (6.6) | 10 (9.3) | 0.614 | −2.74 (−10.52 to 4.91) | |
| Vague or heavy sensation in the chest | 3 (2.8) | 4 (3.7) | >0.999 | −0.91 (−6.70 to 4.73) | |
| Abdominal paints | 2 (1.9) | 19 (17.8) | <0.001 | −15.87 (−24.30 to −8.16) | |
| Visual disturbances | 1 (0.9) | 5 (4.7) | 0.100 | −3.73 (−9.58 to 1.25) | |
| Other symptoms | 25 (23.6) | 24 (22.4) | 0.841 | 1.15 (−10.12 to 12.41) | |
Values are mean ± standard deviation and number (percentages). In the last column, values are mean difference and (95% confidence interval of the difference). Values for dicotomical variables in this column (e.g. sex or hypertension) are percentages.
AF, atrial fibrillation; BMI, body mass index; CI, confidence interval.
Mean difference and (95% confidence interval of the difference) values for age and BMI are years and kg/m2.
The mean heart rate in the AF group was higher than in the SR group [94.0 ± 22.1 min−1 vs. 67.6 ± 12, 8 min−1, −26.5 (95% CI −31.4 to −21.6); P < 0.001] (Supplementary material online, Table S2). It was also higher in the recent-onset AF subgroup in comparison to their late AF counterparts [101.0 ± 22.8 min−1 vs. 89.2 ± 20.4 min−1; 11.8 (95% CI 3.4 to 20.2); P = 0.006]. The Root Mean Square of the Successive R–R Differences (rMSSD) was higher in the AF group than in the SR group [209.8 ± 84.7 ms vs. 56.9 ± 59.2 ms; −152.8 (95% CI −172.6 to −133.0); P < 0.001].
Detection of individual pulses with the photoplethysmography wrist band
In the AF group, individual pulses were detected from the PPG with a sensitivity of 91.7 ± 11.2% with a PPV of 97.5 ± 4.6% (Supplementary material online, Table S2). Pulse detection sensitivity and PPV in the SR group were 99.4 ± 1.5% [AF vs. SR 7.7% (95% CI 5.5% to 9.8%); P < 0.001] and 98.1 ± 4.1% [AF vs. SR 0.6% (95% CI −0.6% to 1.7%); P = 0.35], respectively. In both groups, longer (ECG-based) RR intervals yielded better PPG pulse detection sensitivities (Figure 2D). The PPG pulse detection sensitivity was 86.7 ± 13.9% in the recent-onset AF subgroup, 95.1 ± 7.2% in the late AF subgroup [−8.3% (95% CI −12.9% to −3.7%); P < 0.001]. However, the PPV of pulse detection did not differ between the groups [97.7 ± 4.8% vs. 97.4 ± 4.5%; 0.3% (95% CI −1.5% to 2.1%); P = 0.76].
The correlation between the RR interval and PPG amplitude change was calculated for each patient individually. The correlations were not linear for individual cases, especially in the AF group. Thus, Spearman’s correlation was applied. The mean Spearman’s correlation coefficient was 0.602 (P < 0.001) for individual cases in the AF group (n = 106) and 0.087 (P < 0.37) in the SR group (n = 107), respectively. The correlation was statistically significant with P < 0.001 in 101 of the 106 AF patients but only in 27 of the 107 SR patients. The mean correlation coefficients were 0.667 (P < 0.001) in the recent-onset AF subgroup (n = 43) and 0.557 (P < 0.001) in the late AF subgroup (n = 63) with P < 0.001 in 42 out of 43 and 59 out of 63 patients, respectively.
Atrial fibrillation detection using photoplethysmography wrist band
The ROC curves were determined and F1-scores calculated for different PPG data lengths to evaluate the performance of AFEvidence and COSEn on AF detection. The values of F1-score and area under the curve (AUC) were higher in the area between data lengths from 110 to 120 s in comparison with those obtained with shorter samples (Supplementary material online, Figure S3A). Photoplethysmography data length of 120 s were selected for AF detection. AFEvidence and COSEn algorithms’ F1-scores on PPG-based AF detection were 0.971 and 0.967. The AUCs for AFEvidence and COSEn algorithms were 0.993 and 0.986, respectively. The algorithm parameter values of PPG and ECG are presented in Supplementary material online, Figure S3B.
The values of sensitivity and specificity of AF detection for 2-min PPG were 96.2% and 98.1% for AFEvidence. For COSEn, the sensitivity was 95.3% with a specificity of 98.1%. The corresponding AF detection sensitivities and specificities for 2-min ECG data were 98.1% and 97.2% for AFEvidence and 93.4% and 100.0% for COSEn, respectively. An exact McNemar’s test determined that there was no difference in the AF detection between the PPG and ECG with AFEvidence (P = 0.51) or COSEn (P = 0.13). Although statistically, the pulse detection sensitivity was significantly lower in the recent-onset AF subgroup as compared to the late AF [86.7 ± 13.9% vs. 95.1 ± 7.2%; −8.3% (95% CI −12.9% to −3.7%); P = 0.001], nonetheless the vast majority i.e. 40 of 43 recent-onset AF cases, were correctly identified as AF with both AFEvidence and COSEn (Supplementary material online, Table S2).
Discussion
We aimed to assess the capability of a wrist band PPG pulse detection and detection of AF. The main finding was that the wrist band PPG enabled moderately reliable pulse detection in AF. The pulse detection sensitivity was significantly lower in AF as compared to SR. In patients with SR, both the heart rate and the RR interval duration did not influence the variation in the PPG amplitude as much as in AF patients. In addition, the sensitivity was lower in patients with recent-onset AF than in patients with late AF. A high heart rate (HR) in AF leads to smaller stroke volume and thus to decreased variations of PPG amplitude as the pulse waves merge. This results in decreased sensitivity in pulse detection as the pulse morphology becomes transformed with no clear amplitude variation. Particularly, the pulse detection sensitivity of PPG decreases in RR intervals shorter than 0.5 s (Figure 2D) corresponding to HR over 120 b.p.m. On the other hand, from clinical point of view this is not a major problem, because AF with high heart rate is most likely to be symptomatic and therefore rises the suspicion of arrhythmia.
In addition, we examined the potential capability of wrist attached PPG devices in automated algorithm-based AF detection; they achieved both high sensitivity and specificity. Despite the difference in the pulse detection between the recent-onset and late AF, the detection of AF was reliable. The AF detection was performed on 120 s PPG samples, because of their high maximum F1-scores and area under ROC-curve values. Time periods as short as 40 or 50 s achieved rather high maximum F1-scores and good values of the area under ROC-curves for both AFEvidence and COSEn parameters (Supplementary material online, Figure S3A). This suggests that an algorithm-based wrist band PPG is a reliable method of detecting AF over rather short time periods.
Each patient’s rhythm was interpreted by two experienced cardiologists from the 3-lead ECG which served as the ‘golden standard’ in our study. The ECG was recorded simultaneously with the PPG. In many patients, AF progresses from short, infrequent, self-terminating episodes to longer episodes and in some cases even to sustained AF.3
A recent meta-analysis proposed that a national AF screening programme with initial screening age of 65 years would likely to be cost-effective.9 The number needed to screen among a population ≥65 years of age is suggested to be 70.3 In addition, many of the Wilson–Junger criteria for a screening programme are met by AF.13 Additional cases of AF can be detected over current clinical practice with active screening.14 Opportunistic pulse taking with a follow-up ECG in patients aged 65 or over is suggested to be the preferred screening method in primary care.14 However, radial pulse palpatation results in high number of false positives that can lead to unnecessary ECGs.1 It seems likely that PPG is one of the most promising and cost-effective AF screening methods.9
Recognition of AF, especially ‘silent’ or asymptomatic AF, is a major clinical challenge. There are currently only a few methods available for arrhythmia detection at-home or in outpatient care. These are usually ECG-based and require multiple wet electrodes or a chest strap. Some ECG-based methods require expensive or even invasive devices and the results need to be interpreted by health care professionals.15 Novel methods for arrhythmia detection are needed as the population ages with the concurrent increase in the prevalence of AF. Fingertip PPG from routine in-hospital pulse oximetry has been shown capable of detection AF.16 New technologies such as single-lead ECGs and modified blood pressure monitors may be useful in identifying patients with asymptomatic AF.17 Blood pressure monitors used at home reduce strokes and save costs.17 Wrist attached PPG-based consumer devices are already widely used for tracking the pulse for sport and welfare purposes. Recently, a commercially available PPG smartwatch was found to be able to detect AF from mean RR intervals utilizing a deep neural network (sensitivity 98.0% and specificity 90.2%).18 The FibriCheck smartphone application utilizing PPG detects AF with a sensitivity of 98% and a specificity of 88%.19 We demonstrated that a wrist band PPG utilizing two commonly used AF detection algorithms was also able to diagnose AF with both high sensitivity (96.2%/95.3%) and specificity (98.1%). This could lead to the exploitation of PPG devices in the follow-up rhythm control in permanent AF. A wrist band PPG could provide a cost-effective AF screening method.
Limitations
The PPG-based detection of AF still requires a follow-up ECG for confirmation of the AF diagnosis. The algorithms are also not able to detect atrial or ventricular extrasystoli affecting the regularity of pulse. In paroxysmal AF, the patient’s rhythm can shift from AF to SR which means that the ECG needs to be assessed at the appropriate time. At present, a wrist band PPG is not capable of achieving a diagnosis of AF; instead it should be considered as a tool which can point to the possible existence of AF episodes. Therefore, patients with detected pulse irregularity episodes could be directed to follow-up ECG.
The study population was recruited by researchers on occasional days in three hospitals. Researchers were informed by the hospital staff only on specific days of data collection about patients currently present and probably meeting the inclusion criteria. Only the patients suggested by the hospital staff were screened for this study by the researchers.
The study registrations were performed on stationary patients resting in a supine position. Photoplethysmography was recorded relatively peripherally and is probably susceptible to interference caused by blood pressure changes and fluctuations in vascular elasticity. The PPG wrist band’s BVP sensor is subject to artefacts caused by sensor movement against the skin of the wrist, resulting in noise in the variation in the PPG amplitude. Since the pulse detection demands a clear pulse morphology, these disturbances can interfere with the identification of individual pulses and AF. The PPG morphology in AF as well as the capabilities of PPG wrist bands to achieve pulse detection in AF and its detection in non-supine mobile patients will require further research.
Conclusions
We demonstrated that a commercially available PPG wrist band can detect individual pulses in AF with moderate sensitivity and supplemented with two commonly used algorithms detect AF with high sensitivity and specificity. The pulse detection sensitivity however was lower in recent-onset AF compared to late AF. The wrist band PPG could provide an easy-to-use solution in algorithm-based detection of AF. Photoplethysmography wrist bands are already widely used in tracking pulse for non-medical purposes e.g. in sports and welfare. The incorporation of AF detection algorithms into such devices could achieve continuous arrhythmia self-monitoring and represent a cost-effective AF screening method. Photoplethysmography wrist bands could help in detecting asymptomatic or ‘silent’ AF cases before they can cause serious complications e.g. stroke.
Acknowledgements
We thank the nursing and medical staff of the participating hospitals and especially Lasse Pörsti BM from the School of Medicine, UEF for his help with data acquisition, and biostatistician Tuomas Selander for statistical consultance.
Conflict of interest: J.A.L., T.T.R., T.J.M., H.J., and M.P.T. are shareholders of a company (Heart2Save) that designs ECG-based software for medical equipment. P.K., J.A.L., M.P.T., and H.J. report personal fees from Heart2Save.
