


In recent years, stroke prevention in patients with atrial fibrillation (AF) has radically changed, with increasing use of non-vitamin K antagonist oral anticoagulants (NOACs). Contemporary European data on AF thromboprophylaxis are needed.
We report 1-year follow-up data from the EURObservational Research Programme in Atrial Fibrillation (EORP-AF) General Long-Term Registry. Outcomes were assessed according to antithrombotic therapy. At 1-year follow-up, 9663 (88.0%) patients had available data for analysis: 586 (6.1%) were not treated with any antithrombotic; 681 (7.0%) with antiplatelets only; 4066 (42.1%) with vitamin K antagonist (VKA) only; 3167 (32.8%) with NOACs only; and 1163 (12.0%) with antiplatelet and oral anticoagulant. At 1-year follow-up, there was a low rate of stroke (0.7%) and any thromboembolic event (TE) (1.2%), while haemorrhagic events occurred in 222 patients (2.3%). Cardiovascular (CV) death and all-cause death occurred in 3.9% and 5.2% of patients, respectively. Cumulative survival for all the three main outcomes considered was highest amongst patients treated only with NOACs (P < 0.0001). Multivariable-adjusted Cox regression analysis found that VKA or NOACs use was independently associated with a lower risk for any TE/acute coronary syndrome/CV death, while all treatments were independently associated with a lower risk for CV death and all-cause death.
The 1-year follow-up of EORP-AF General Long-Term Registry reported a low occurrence of thromboembolic and haemorrhagic events, although mortality was high. Both VKA and NOACs were associated with a lower risk of all main adverse outcomes. All treatments were associated with a lower risk for CV death and all-cause death.
One-year follow-up of EORP-AF General Long-Term Registry found an overall low occurrence of thromboembolic and haemorrhagic events, although mortality remains high.
Vitamin K antagonist and non-vitamin K antagonist oral anticoagulants were similarly associated with a lower risk of all main adverse outcomes. All antithrombotic treatments were associated with a lower risk of cardiovascular death and all-cause death.
Introduction
Atrial fibrillation (AF) prevalence and incidence have been projected to substantially increase in the future, with more than 15 million Europeans to be affected by 2030 and up to 215 000 new AF patients diagnosed each year.1 Epidemiology of AF has changed in the last 15 years, with patients found to be older and more affected by cardiovascular (CV) and non-CV comorbidities.2
Atrial fibrillation is associated with an increased risk of stroke, with up to 30% of reported strokes being associated with AF; moreover, an increased risk of CV events, CV related death, and all-cause death with AF has clearly been established.3–6 The introduction of the non-vitamin K antagonist oral anticoagulants (NOACs) as an effective and safer alternative to vitamin K antagonist (VKA) has changed the landscape of clinical management for these patients,7 although there are clear regional differences in prescription of these drugs.8,9
In order to improve knowledge about AF natural history, association with risk factors and comorbidities and role of antithrombotic therapy in real-life, several observational registries have been conducted worldwide.10–12 In 2012, the European Society of Cardiology (ESC) initiated the EURObservational Research Programme in AF (EORP-AF) General Pilot Registry, which was the first contemporary independent observational registry to provide a picture of the changing landscape of AF epidemiology and treatment in Europe, taking a snapshot of current practice amongst European cardiologists’ on the edge of the ‘NOAC era’.3,13,14 In 2013, the EORP-AF General Long-Term Registry was launched with the aim to provide more evidence about European AF patient characteristics, clinical practices and use of antithrombotic drugs after NOAC use was largely established in most of Europe.8
In this article, we report the 1-year follow-up data of the EORP-AF General Long-Term Registry, focusing on the relationship between baseline antithrombotic therapy use and the occurrence of major clinical adverse events.
Methods
The EORP-AF General Long-Term Registry is a prospective, observational, multicentre registry established by ESC in 27 participating countries. The study enrolled consecutive AF patients presenting in 250 cardiology practices, both in- and outpatient settings. The detailed description of the design and baseline characteristics have been provided previously.8 In brief, all AF patients enrolled had AF documented within 12 months before enrolment on the basis of objective electrocardiographic evaluation. All patients were ≥18 years old and provided written informed consent form. Enrolment was undertaken from October 2013 to September 2016, while 1-year follow-up was performed up until to September 2017. Institutional review board approved the study protocol for every institution, and the study was performed according to the EU Note for Guidance on Good Clinical Practice CPMP/ECH/135/95 and the Declaration of Helsinki.8
Baseline information were collected according to study procedures previously described.8 Thromboembolic risk was defined according to CHA2DS2-VASc score.1 ‘Low risk’ was defined as a CHA2DS2-VASc 0 in males and 1 in females; ‘moderate risk’ was defined for a CHA2DS2-VASc 1 in males; ‘high risk’ was defined as CHA2DS2-VASc ≥2. Bleeding risk was defined according to HAS-BLED score.1 ‘Low risk’ was defined as HAS-BLED 0–2, while ‘high risk’ was defined as HAS-BLED ≥3. Symptomatic status was defined according to EHRA (European Heart Rhythm Association) score.1
For the purpose of this analysis, patients were categorized according to antithrombotic therapy prescribed at discharge/after consultation, following enrolment in the study. Patients were then divided in five groups: (i) no antithrombotic therapy; (ii) only antiplatelet drugs; (iii) only VKA; (iv) only NOACs; and (v) antiplatelet drugs plus any oral anticoagulant (OAC).
Follow-up procedures
All follow-up was performed at 1-year after enrolment. During follow-up all incident major adverse clinical events were recorded, with the composite outcome of any thromboembolism (TE) (including stroke, transient ischaemic attack, and any peripheral embolism)/acute coronary syndrome (ACS)/CV death, CV death, all-cause death as the main outcomes of interest.
We also considered the individual outcomes of stroke, any TE, any haemorrhagic events, and intracranial haemorrhage. Haemorrhagic events were not specifically defined, but all significant events which investigators became aware, were reported. All data about hospital admissions (any admission, AF-related, and CV-related) were also recorded. Investigators reported all available details about incident major adverse clinical events on the centralized electronic case report form. Events are reported according to the five prespecified groups.
Statistical analysis
All continuous variables were reported as mean ± standard deviation or as median and interquartile range. Among-group comparisons were made using a non-parametric test (Kruskal–Wallis test). Categorical variables were reported as counts and percentages. Among-group comparisons were made using a χ2 test or Fisher’s exact test (if any expected cell count was less than five). Plots of Kaplan–Meier curves for time to any TE/ACS/CV death, to CV deaths or to all-cause of death according to antithrombotic pattern were performed. Survival distributions were compared using the log-rank test.
A univariate and stepwise multivariate Cox regression analysis, adjusted for all the main outcomes predictors in AF patients, was performed to establish the relationship between the various antithrombotic therapy patterns and the risk of the composite outcome of any TE/ACS/CV death, CV death, or all-cause death. Into the model all the candidate variables (variables with P < 0.10 in univariate) were included. A univariate significance level of 0.05 was required to allow a variable into the model (SLENTRY = 0.05) and a multivariate significance level of 0.05 was required for a variable to stay in the model (SLSTAY = 0.05). No interaction was tested. Hosmer and Lemeshow Goodness-of-Fit and Harrell’s C statistic tests were used to verify that the models were optimal. A two-sided P < 0.05 was considered statistically significant. All analyses were performed using SAS statistical software version 9.4 (SAS Institute Inc., Cary, NC, USA).
Results
Of the original 11 096 patients enrolled in the EORP-AF General Long-Term Registry at baseline from October 2013 to November 2017, 121 (1.1%) withdrew their consent for the follow-up phase for their own personal choice, in accordance to good clinical practice. Of the remaining 10 975 patients, 9663 (88.0%) had available data about follow-up status. The overall demographic and clinical characteristics of this cohort have been previously reported.8 Baseline characteristics according to antithrombotic therapy prescribed at discharge are reported in Table 1.
Demographic and baseline characteristics according to antithrombotic therapy at baseline discharge
| No antithrombotic (N = 586) | Only antiplatelet drugs (N = 681) | Only VKA (N = 4066) | Only NOACs (N = 3167) | Antiplatelet drugs + OAC (N = 1163) | P-value | |
|---|---|---|---|---|---|---|
| Demographics | ||||||
| Age (years), median (IQR) | 61 (51–73) | 72 (62–78) | 71 (64–78) | 70 (62–77) | 72 (65–78) | <0.0001 |
| Female, n (%) | 223 (38.1) | 289 (42.4) | 1729 (42.5) | 1272 (40.2) | 374 (32.2) | <0.0001 |
| Type of AF, n (%) | <0.0001 | |||||
| First diagnosed | 136 (23.9) | 127 (19.2) | 386 (9.6) | 626 (20.0) | 189 (16.7) | |
| Paroxysmal | 231 (40.7) | 285 (43.1) | 821 (20.5) | 844 (27.0) | 288 (25.4) | |
| Persistent | 78 (13.7) | 80 (12.1) | 711 (17.7) | 814 (26.0) | 215 (19.0) | |
| LS persistent | 9 (1.6) | 18 (2.7) | 206 (5.1) | 158 (5.1) | 35 (3.1) | |
| Permanent | 114 (20.1) | 151 (22.8) | 1884 (47.0) | 683 (21.9) | 405 (35.8) | |
| Concomitant diseases, n (%) | ||||||
| Hypertension | 188 (32.5) | 412 (61.1) | 2631 (65.2) | 1897 (60.4) | 791 (68.5) | <0.0001 |
| CAD | 91 (16.2) | 334 (52.8) | 850 (22.3) | 498 (16.4) | 834 (76.3) | <0.0001 |
| Previous MI | 40 (44.0) | 160 (47.9) | 325 (38.2) | 194 (39.0) | 432 (51.8) | <0.0001 |
| Heart failure | 135 (23.4) | 323 (47.9) | 1735 (42.9) | 934 (29.8) | 590 (51.1) | <0.0001 |
| Valvular disease | 157 (27.4) | 305 (46.0) | 2362 (59.1) | 1316 (42.5) | 625 (54.6) | <0.0001 |
| Dilated cardiomyopathy | 24 (4.2) | 54 (8.0) | 419 (10.4) | 185 (5.9) | 142 (12.4) | <0.0001 |
| Hypertrophic cardiomyopathy | 9 (1.6) | 16 (2.4) | 154 (3.8) | 76 (2.4) | 41 (3.6) | 0.0007 |
| Restrictive cardiomyopathy | 2 (0.3) | 1 (0.1) | 11 (0.3) | 4 (0.1) | 2 (0.2) | 0.5788 |
| Other cardiomyopathy | 12 (2.1) | 24 (3.6) | 161 (4.0) | 97 (3.1) | 56 (4.8) | 0.0102 |
| Congenital heart disease | 6 (1.0) | 9 (1.3) | 50 (1.2) | 25 (0.8) | 12 (1.0) | 0.3852 |
| PAH | 21 (3.7) | 53 (8.0) | 345 (8.6) | 128 (4.1) | 93 (8.1) | <0.0001 |
| Cardiovascular risk factors, n (%) | ||||||
| Diabetes mellitus | 86 (14.8) | 161 (23.7) | 943 (23.3) | 595 (18.9) | 409 (35.5) | <0.0001 |
| Lipid disorder | 148 (26.6) | 295 (45.7) | 1651 (42.5) | 1138 (37.5) | 617 (55.1) | <0.0001 |
| Current smoker | 85 (15.5) | 71 (11.2) | 305 (8.2) | 244 (8.2) | 124 (11.3) | <0.0001 |
| No regular exercise | 170 (33.4) | 290 (47.6) | 1483 (42.5) | 989 (37.0) | 525 (50.9) | <0.0001 |
| Other comorbidities, n (%) | ||||||
| Previous stroke | 14 (2.4) | 40 (6.0) | 262 (6.5) | 189 (6.0) | 83 (7.2) | 0.0005 |
| Previous TIA | 6 (1.0) | 18 (2.7) | 126 (3.1) | 119 (3.8) | 41 (3.6) | 0.0048 |
| Previous bleedings | 39 (6.8) | 59 (8.8) | 166 (4.1) | 163 (5.2) | 68 (5.9) | <0.0001 |
| PAD | 26 (4.5) | 84 (12.8) | 299 (7.5) | 176 (5.7) | 175 (15.5) | <0.0001 |
| Chronic kidney disease | 37 (6.3) | 123 (18.2) | 504 (12.5) | 304 (9.6) | 223 (19.3) | <0.0001 |
| COPD | 34 (5.9) | 60 (8.9) | 388 (9.6) | 226 (7.2) | 147 (12.7) | <0.0001 |
| Malignancy | 47 (8.0) | 54 (8.0) | 285 (7.0) | 262 (8.3) | 89 (7.7) | 0.3309 |
| Thyroid disease/disorder | 57 (9.9) | 75 (11.4) | 615 (15.4) | 452 (14.5) | 166 (14.5) | 0.0017 |
| Main reason for admission/consultation, n (%) | <0.0001 | |||||
| AF | 447 (76.3) | 368 (54.0) | 2565 (63.1) | 2557 (80.7) | 537 (46.2) | |
| ACS | 13 (2.2) | 84 (12.3) | 36 (0.9) | 19 (0.6) | 161 (13.8) | |
| Valvular disease | 9 (1.5) | 19 (2.8) | 177 (4.4) | 17 (0.5) | 52 (4.5) | |
| Hypertension | 21 (3.6) | 10 (1.5) | 94 (2.3) | 51 (1.6) | 19 (1.6) | |
| Heart failure | 22 (3.8) | 67 (9.8) | 502 (12.3) | 207 (6.5) | 142 (12.2) | |
| Other CAD | 8 (1.4) | 41 (6.0) | 80 (2.0) | 36 (1.1) | 96 (8.3) | |
| Other CV | 28 (4.8) | 65 (9.5) | 363 (8.9) | 159 (5.0) | 105 (9.0) | |
| Other non-CV | 38 (6.5) | 27 (4.0) | 248 (6.1) | 121 (3.8) | 51 (4.4) | |
| Symptomatic status, n (%) | <0.0001 | |||||
| EHRA I | 261 (44.5) | 337 (49.5) | 1942 (47.8) | 1328 (41.9) | 519 (44.6) | |
| EHRA II–III–IV | 325 (55.5) | 344 (50.5) | 2124 (52.2) | 1839 (58.1) | 644 (55.4) | |
ACS, acute coronary syndrome; AF, atrial fibrillation; CAD, coronary artery disease; COPD, chronic obstructive pulmonary disease; CV, cardiovascular; EHRA, European Heart Rhythm Association; IQR, interquartile range; MI, myocardial infarction; NOACs, non-vitamin K antagonist oral anticoagulants; OAC, oral anticoagulants; PAD, peripheral artery disease; PAH, pulmonary artery hypertension; TIA, transient ischaemic attack; VKA, vitamin K antagonist.
Patients prescribed with only antiplatelet drugs and antiplatelet drugs and OAC were older, with the latter ones were also less females (P < 0.0001), while those not prescribed with any antithrombotic therapy were the youngest (P < 0.0001) (Table 1). Atrial fibrillation patients not prescribed with any antithrombotic therapy were generally less affected with concomitant cardiac diseases, CV risk factors, and other comorbidities, while patients prescribed with both antiplatelet drugs and OAC were more likely diagnosed with most of those conditions. Non-vitamin K antagonist oral anticoagulant patients were more likely asymptomatic, compared with other groups (P < 0.0001) (Table 1). In general, patients not prescribed with any antithrombotic therapy were less prescribed with other CV and non-CV drugs (Supplementary material online, Table S1).
Baseline CHA2DS2-VASc score and proportion of patients with high thromboembolic risk (Supplementary material online, Table S2) were significantly lower in patients not prescribed with any antithrombotic, while it was progressively higher for patients prescribed only with NOACs, VKA, antiplatelet drugs, and with both antiplatelet drugs and OAC (all P < 0.0001).
Similarly, HAS-BLED score (Supplementary material online, Table S2) and proportion of patients with high bleeding risk were lower in patients not prescribed with any antithrombotic therapy and progressively higher for patients prescribed only with NOACs, VKA, antiplatelet drugs, and with both antiplatelet drugs and OAC (all P < 0.0001).
Use of antithrombotic therapy at 1-year follow-up
Antithrombotic therapy at follow-up visit discharge, according to baseline discharge antithrombotic therapy is shown in Figure 1. Almost half of the patients initially not prescribed with any antithrombotic were then prescribed with an antithrombotic drug, mostly NOACs (17.9%) (Figure1, 1st column); also, 33.3% of patients treated only with antiplatelet drugs at baseline were prescribed with an OAC, both alone and associated with antiplatelet drugs, at follow-up (Figure 1, 2nd column). The large majority of patients originally prescribed with VKA or NOACs only remained on the same drugs, even though 4.5% and 7.9%, respectively stopped taking their VKA and NOACs (Figure 1, 3rd and 4th columns). Among patients treated with antiplatelet drugs and OAC, 41.7% were switched to a single OAC at follow-up (Figure1, 5th column).
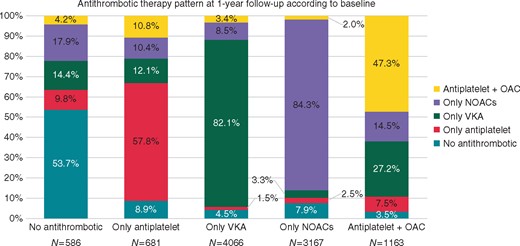
Antithrombotic therapy at 1-year follow-up discharge according to antithrombotic therapy at baseline discharge. NOACs, non-vitamin K antagonist oral anticoagulants; OAC, oral anticoagulation; VKA, vitamin K antagonist.
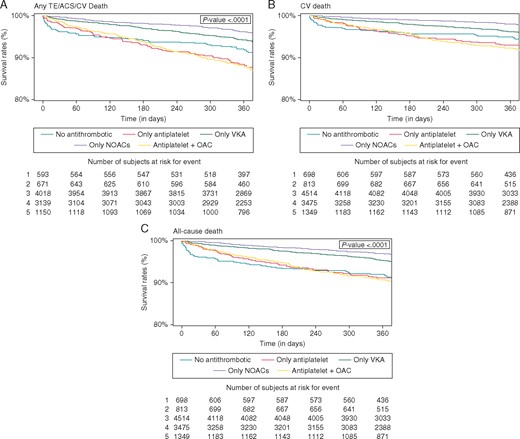
Kaplan–Meier curves for major adverse clinical events according to antithrombotic therapy at baseline discharge. ACS, acute coronary syndrome; AF, atrial fibrillation; CV, cardiovascular; NOACs, non-vitamin K antagonist oral anticoagulants; OAC, oral anticoagulation; TE, thromboembolism; VKA, vitamin K antagonist.

Cox multivariate regression analysis for major clinical adverse events according to antithrombotic therapy at baseline discharge. Dashes stand for hazard ratio and 95% confidence interval. Reference for type of AF is first diagnosed, for enrolment year is 2013/2014 and for antithrombotic therapy is no antithrombotic; ACS, acute coronary syndrome; AF, atrial fibrillation; CV, cardiovascular; LS, long-standing; NOACs, non-vitamin K antagonist oral anticoagulants; OAC, oral anticoagulation; TE, thromboembolism; TIA, transient ischaemic attack; VKA, vitamin K antagonist.
Follow-up analysis
After 1-year of follow-up observation, a total of 63 (0.7%) strokes, 116 (1.2%) any TE events, and 148 (1.6%) ACS were recorded. A total of 222 (2.3%) haemorrhagic events, with 24 (0.3%) intracranial haemorrhages, as well as 380 (3.9%) CV death and 501 (5.2%) all-cause death events were also recorded. Overall, the composite outcome of any TE/ACS/CV death was recorded in 618 (6.5%).
Analysing the occurrence of major adverse clinical events according to baseline antithrombotic therapy use at discharge (Table 2), a higher rate of stroke and any TE was recorded with antiplatelet drugs [1.7% (P = 0.043) and 2.4% (P = 0.053), respectively]. No difference in rate of haemorrhagic events and intracranial haemorrhage was found. A higher rate of ACS, CV death, and all-cause death was reported for both antiplatelet drugs and OAC, while the lowest rate was found in patients treated only with NOACs (all P < 0.0001) (Table 2).
Major adverse clinical events according to antithrombotic therapy at baseline discharge
| No antithrombotic (N = 586) | Only antiplatelet drugs (N = 681) | Only VKA (N = 4066) | Only NOACs (N = 3167) | Antiplatelet drugs + OAC (N = 1163) | P-value | |
|---|---|---|---|---|---|---|
| Stroke, n (%) | 2 (0.3) | 11 (1.7) | 22 (0.6) | 20 (0.6) | 8 (0.7) | 0.0453 |
| Any TE, n (%) | 9 (1.6) | 16 (2.4) | 40 (1.0) | 37 (1.2) | 14 (1.2) | 0.0530 |
| Haemorrhagic events, n (%) | 8 (1.4) | 15 (2.3) | 95 (2.4) | 74 (2.4) | 30 (2.7) | 0.5797 |
| Intracranial haemorrhage, n (%) | 1 (0.2) | 2 (0.3) | 12 (0.3) | 6 (0.2) | 3 (0.3) | 0.8932 |
| Acute coronary syndrome, n (%) | 6 (1.1) | 27 (4.1) | 49 (1.2) | 24 (0.8) | 42 (3.7) | <0.0001 |
| CV death, n (%) | 17 (2.9) | 47 (6.9) | 157 (3.9) | 64 (2.0) | 95 (8.2) | <0.0001 |
| All-cause death, n (%) | 30 (5.1) | 60 (8.8) | 196 (4.8) | 100 (3.2) | 115 (9.9) | <0.0001 |
| Any TE/ACS/CV death, n (%) | 31 (5.4) | 81 (12.1) | 240 (6.0) | 122 (3.9) | 144 (12.5) | <0.0001 |
| Any readmission, n (%) | 120 (21.4) | 176 (27.6) | 912 (23.4) | 723 (23.5) | 326 (29.7) | <0.0001 |
| Any AF readmission, n (%) | 48 (8.5) | 67 (10.4) | 405 (10.3) | 354 (11.5) | 135 (12.3) | 0.0915 |
| Any CV readmission, n (%) | 85 (15.2) | 151 (23.6) | 745 (19.1) | 561 (18.2) | 278 (25.2) | <0.0001 |
ACS, acute coronary syndrome; AF, atrial fibrillation; CV, cardiovascular; NOACs, non-vitamin K antagonist oral anticoagulants; OAC, oral anticoagulation; TE, thromboembolism; VKA, vitamin K antagonist.
The composite outcome of any TE/ACS/CV death was higher with antiplatelet drugs and those treated with both antiplatelet drugs and OAC (12.1% and 12.5%, respectively), while patients treated only with NOACs reported the lowest rate (3.9%) (P < 0.0001). Regarding hospital readmissions, patients treated both with antiplatelet drugs and OAC reported higher crude rates of any readmission and any CV readmission (Table 2).
For the main outcomes of interest, overall incidence of any TE/ACS/CV death was 6.6 per 100 patient-years, incidence of CV death was 3.9 per 100 patient-years and incidence of all-cause death was 5.2 per 100 patient-years. Patients treated only with antiplatelet drugs and those treated with both antiplatelet drugs and OAC reported the highest incidence rates (12.7 and 13.1 per 100 patient-years, respectively), while those not treated with any antithrombotic and those treated with VKA reported a similar incidence (5.5 and 6.1 per 100 patient-years, respectively); lastly those patients treated only with NOACs reported the lowest incidence (3.9 per 100 patient-years). Similar differences across the groups were found for CV death and all-cause death outcomes.
The Kaplan–Meier curves (Figure 2) show that the cumulative survival for any TE/ACS/CV death (Figure 2A) was highest for patients treated only with NOACs and progressively lower for patients treated only with VKA, patients not treated with any antithrombotic and those treated with antiplatelet drugs or antiplatelet drugs and OAC (P < 0.0001). Similar evidence was reported for the CV death outcome (Figure 2B), while for all-cause death outcome, patients treated only with VKA or NOACs had similar cumulative survival, higher than those in other groups (P < 0.0001) (Figure 2C).
Cox regression analysis
After the univariate analysis (Supplementary material online, Tables S3–S5), a Cox multivariate regression analysis (Table 3), adjusted for all the main known outcomes predictors in AF patients (Figure3A–C), showed an independent association with lower risk for any TE/ACS/CV death for patients treated only with VKA [hazard ratio (HR) 0.44, 95% confidence interval (CI) 0.31–0.63] and NOACs (HR 0.37, 95% CI 0.26–0.54), compared with those not treated with any antithrombotic therapy.
Cox regression analysis for major adverse clinical events according to antithrombotic therapy at baseline discharge
| Any TE/ACS/CV deatha | CV deathb | All-cause deathc | |||||||
|---|---|---|---|---|---|---|---|---|---|
| HR | 95% CI | P-value | HR | 95% CI | P-value | HR | 95% CI | P-value | |
| No antithrombotic (ref.) | – | – | – | – | – | – | – | – | – |
| Only antiplatelet drugs | 0.83 | 0.55–1.24 | 0.3619 | 0.56 | 0.34–0.91 | 0.0195 | 0.55 | 0.36–0.83 | 0.0041 |
| Only VKA | 0.44 | 0.31–0.63 | <0.0001 | 0.38 | 0.25–0.57 | <0.0001 | 0.34 | 0.24–0.47 | <0.0001 |
| Only NOACs | 0.37 | 0.26–0.54 | <0.0001 | 0.25 | 0.16–0.40 | <0.0001 | 0.26 | 0.18–0.38 | <0.0001 |
| Antiplatelet drugs + OAC | 0.71 | 0.48–1.04 | 0.0776 | 0.64 | 0.41–0.98 | 0.0402 | 0.57 | 0.40–0.83 | 0.0031 |
ACS, acute coronary syndrome; AF, atrial fibrillation; CV, cardiovascular; NOACs, non-vitamin K antagonist oral anticoagulants; OAC, oral anticoagulation; TE, thromboembolism; VKA, vitamin K antagonist.
Hosmer and Lemeshow Goodness-of-Fit: 17.349, Harrell’s C statistic: 0.734.
Hosmer and Lemeshow Goodness-of-Fit: 19.754, Harrell’s C statistic: 0.796.
Hosmer and Lemeshow Goodness-of-Fit: 19.152, Harrell’s C statistic: 0.780.
For the CV death and all-cause death outcomes, all the antithrombotic therapies were associated to a lower risk of event occurrence, with treatment only with VKA or NOACs showing the lower risk (for CV death and all-cause death, only VKA, HR 0.38, 95% CI 0.25–0.57 and HR 0.34, 95% CI 0.24–0.47, respectively; for only NOACs, HR 0.25, 95% CI 0.16–0.40 and HR 0.26, 95% CI 0.18–0.38, respectively).
Discussion
In this 1-year follow-up report of the EORP-AF General Long-Term Registry, our principal findings are as follows: (i) we observed an overall low rate of thromboembolic, bleeding and CV events amongst a contemporary cohort of European AF patients, while conversely a higher rate of CV death and all-cause death was evident; (ii) after 1 year, the persistence of OAC treatments was high and most patients remained treated with at least one type of OAC; (iii) use of either VKA or NOACs was associated with a significant independent reduced risk for the composite of adverse clinical events. All the antithrombotic treatments (only antiplatelet drugs, only VKA, only NOACs, and antiplatelet drugs and OAC) have been found to be associated with a lower risk of CV death and all-cause death, even though use of only VKA and only NOACs showed a stronger magnitude in risk reduction (Figure 4).
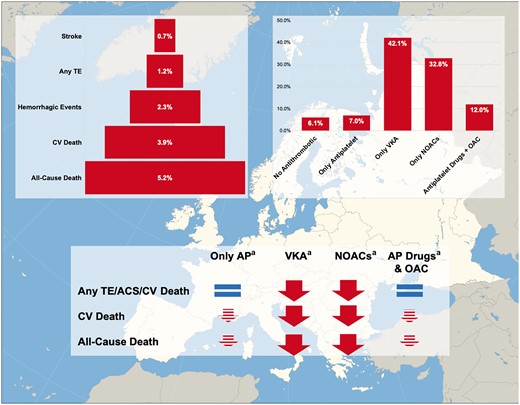
EORP-AF General Long-Term follow-up. aThe logical signs are intended as expressing the association between antithrombotic therapies and risk of outcomes occurrence and do not imply a causative link. AP, antiplatelet; CV, cardiovascular; NOACs, non-vitamin K antagonist oral anticoagulants; OAC, oral anticoagulation; TE, thromboembolism; VKA, vitamin K antagonist.
Results presented in this article strengthen and reinforce the evidence, already provided in the baseline paper,8 which the uptake of OAC (both VKA and NOACs) is very high and remains high persistently across 1-year of follow-up observation, also showing a significant reduction in use of aspirin. A recent study held in the UK, merging several different national databases further supported this observation in the context of a real-life scenario, reporting an increase in OAC uptake up to 78.6%, with a consensual decrease of antiplatelet drugs use up to 16.1%.15 Notwithstanding, other nationwide real-life databases (based on general care and not on cardiology practices) even if confirmed an increase in OAC uptake (mostly based on the increased use of NOACs), reported an overall lower prescription rate compared with our data.16,17 Further, the reduction in the use of aspirin was definitely more modest than that described by our study.16,17 These differences are likely to be attributed to the fact that our study is based on highly skilled and expert cardiology practices, also in the context of a specific study investigating cardiology practices in AF.
Data from worldwide registries have established that oral anticoagulation is significantly associated with reduced rates of thromboembolic events.10,11 Data from EORP-AF Pilot Registry reported a low rate of thromboembolic events, even though it was conducted when NOAC use was limited and also with a limited number of countries included.3,14 Our data confirm and extend previous knowledge, demonstrating a high uptake of OAC treatment after NOACs fully entered current daily clinical practice in Europe, which are associated with a significantly reduced risk for thromboembolic complications, without an excess of bleeding complications. Even though the observational nature of the study does not allow to establish the causality link, the results presented seems to strengthen the concept that NOACs use is effective and safe in real-life AF population. Moreover, despite the observed differences in OAC prescription across European regions,8 we found no impact of regions on outcomes, which did not emerge as significant independent predictors on multivariate analysis.
Of note, the low rates of overall bleeding events possibly underlined how indications for appropriate management of modifiable bleeding risk score from international guidelines1 are implemented in cardiology clinical practice and effective in containing bleeding events. This appears to be particularly true regarding the intracranial haemorrhage events, which rates are extremely low (ranging from 0.2% to 0.3% in all the groups). Notwithstanding, this very low rate of events does not allow to draw definitive conclusions regarding the difference in terms of intracranial bleeding between the various antithrombotic therapy approach.
Despite the high use of OAC, the risk of CV death and all-cause death remained high in AF real-life patients. A post hoc analysis derived from the ROCKET-AF trial also showed that the majority of deaths are related to cardiac causes associated with comorbidities.5 In the Loire Valley Atrial Fibrillation project, after over a 2.5 years follow-up, 14% of patients died, with the majority of deaths associated with pre-existing CV comorbidities rather than stroke.4 These data were also confirmed in the Phase III trials on NOACs.18 Indeed, focus on the reduction of mortality is should be the next objective in improving outcomes for AF patients. This has led to the concept of ‘integrated care’ for improving management of AF patients, which has been shown to reduce mortality and hospitalizations.19 Such ‘integrated care’ can be operationalized with the simple ABC pathway (‘A’ Avoid stroke with Anticoagulation; ‘B’ Better symptom management with rate or rhythm control; ‘C’ Cardiovascular and comorbidity risk management, including lifestyle interventions).20 A more integrated, comprehensive evaluation of these patients would properly manage patients in a more holistic manner.20,21
Follow-up data from large observational registries about AF patients have provided evidence about a sustained association of OAC and NOACs antithrombotic therapy with a reduced risk of thromboembolic events and death.10,11 Our results supplement these industry-sponsored registries with an independent ESC-conducted European-wide cohort of AF patients, where the use of VKA and NOACs was consistently associated with a reduced risk of main clinical adverse events, without an increase in the risk of bleeding events. Our cohort included also AF patients not treated with VKA or NOACs (6% of the cohort) and this allows to make important considerations on this subgroup of ‘real-life’ patients usually not object of analysis in other registries. Our data reinforce the concept that the use of any OAC is associated with a reduced risk of CV death and all-cause death, independently of known predictors of death in AF patients.22
The association between use of antiplatelet drugs and reduced risk of CV death and all-cause death deserves some considerations. Current guidelines firmly contraindicate the use of antiplatelet drugs in patients with AF,1 due to inefficacy to prevent stroke and the contemporary increased risk of major bleeding. Actually, both stroke and thromboembolic events are reported to be more than doubled in patients treated with antiplatelet drugs only. Conversely, no difference was found in the rate of haemorrhagic events, even though the overall low rate is likely due to the good implementation of current recommendations for minimizing bleeding risk as reported above.
In the cohort of untreated patients more than 40% had a baseline high risk of stroke, which may have led to an overestimation of risk reduction in patients treated with antiplatelet drugs, even though still in this case the proportion of high risk is notable. Moreover, considering the high prevalence of cardiac disease associated to AF in these patients, that drive the prescription of antiplatelet drugs as described in other observational cohorts,23 the inverse association with the risk of mortality can be due to an impact on the cardiac substrate, often due to relatively recent ACS.8
These considerations need to be extended also to those patients treated with both antiplatelet drugs and OAC. Indeed, these patients not only presented the highest baseline thromboembolic risk, but also reported the highest rate of events. Considering the baseline characteristics, we can see how these patients are the most burdened with coronary artery disease, previous myocardial infarction and peripheral artery disease. Our observations match with some recent papers specifically investigating this issue.23,24 Even in these patients, very likely the combining action of OAC and antiplatelet drugs is able to modulate the CV risk associated with the vascular disease that goes beyond the AF-related thromboembolic risk.
Our observations surely do not allow to reconsider the role of antiplatelet drugs in thromboembolic risk management, but highlight the role of these drugs in the management of concomitant heart disease, that is often reported in AF patients, as underlined by clinical guidelines.1
Limitations
The main limitation of the study is related to its observational nature. Second, a significant number of patients were lost at follow-up, notwithstanding similar proportion of losses were reported by other registries.11 Even though the events were not centrally adjudicated, this limitation is shared by almost all real-life observational registries. Moreover, if the low rate of thromboembolic events could be due to a relatively short follow-up, longer follow-up is planned to further substantiate our observations. Another limitation is related to the study setting, based exclusively on cardiology practices. Hence, since AF patients are also commonly managed by different health professionals (i.e. general practitioners, internal medicine specialists, geriatricians), our data need to be cautiously interpreted when extended to the entire AF population.
Conclusions
The 1-year follow-up of EORP-AF General Long-Term Registry reported an overall low occurrence of thromboembolic and haemorrhagic events, although mortality was high. Both VKA and NOACs were similarly associated with a lower risk of the composite outcome of Any TE/ACS/CV death when compared with no treatment. All antithrombotic treatments are associated to a lower risk of CV death and all-cause death, comprising antiplatelet drugs alone or in association with OAC (despite with a lower magnitude than only VKA and only NOACs), in patients with prominent cardiac disease.
Acknowledgements
Executive Committees and Steering Committees (National Coordinators) of the EURObservational Research Programme (EORP)-Atrial Fibrillation (EORP-AF) General Pilot Registry of the European Society of Cardiology (ESC), reported in Supplementary material online, Appendix. Data collection was conducted by the EORP department by Patti-Ann McNeill as Project Officer, Viviane Missiamenou as Data Manager. Statistical analyses were performed by Cécile Laroche. Overall activities were coordinated and supervised by Doctor Aldo P. Maggioni (EORP Scientific Coordinator). All EORP-AF Long-Term Registry investigators listed in the Supplementary material online, Appendix.
Funding
Since the start of EORP, the following companies have supported the programme: Abbott Vascular Int. (2011–2014), Amgen Cardiovascular (2009–2018), AstraZeneca (2014–2017), Bayer AG (2009–2018), Boehringer Ingelheim (2009–2019), Boston Scientific (2009–2012), The Bristol Myers Squibb and Pfizer Alliance (2011–2016), The Alliance Daiichi Sankyo Europe GmbH and Eli Lilly and Company (2011–2017), Edwards (2016–2019), Gedeon Richter Plc. (2014–2017), Menarini Int. Op. (2009–2012), MSD-Merck & Co. (2011–2014), Novartis Pharma AG (2014–2017), ResMed (2014–2016), Sanofi (2009–2011), SERVIER (2009–2018). The Atrial Fibrillation NETwork (AFNET), conducting the registry in Germany, received support from The Bristol Myers Squibb/Pfizer Alliance (2014–2018) and the German Centre for Cardiovascular Research (DZHK).
Conflict of interest: G.B. reported small speaker’s fee from Medtronic, Boston, Boehringer and Bayer, outside the submitted work; M.P. received a small consulting fee from Boehringer Ingelheim, outside the submitted work; L.F. reports personal fees from Bayer, Boehringer Ingelheim, BMS Pfizer, Medtronic, Novartis, outside the submitted work; F.M. reports personal fees from Boehringer Ingelheim, Bayer and Pfizer-BMS, outside the submitted work; M.N. reports grants from AFNET Germany, during the conduct of the study, lecture fees from Boehringer Ingelheim, Bristol-Myers Squibb Germany, Pfizer Germany, and Daichii-Sankyo Germany, outside the submitted work; T.P. reports personal fees from Pfizer and Bayer, during the conduct of the study; G.A.D. reports speaker’s fee from Boehringer Ingelheim, Bayer, Pfizer, Servier, outside the submitted work; Z.K. reports speaker’s fee from Boehringer Ingelheim; L.T. reports personal fees from Servier and CVIE Therapeutics, outside the submitted work; A.P.M. has received grants and non-financial support as a Steering Committee member from Novartis, Bayer, Cardiorentis, Fresenius, outside the submitted work; G.Y.H.L. has served as consultant for Bayer/Janssen, BMS/Pfizer, Medtronic, Boehringer Ingelheim, Novartis, Verseon and Daiichi-Sankyo. Speaker for Bayer, BMS/Pfizer, Medtronic, Boehringer Ingelheim and Daiichi-Sankyo. No fees are received personally, outside the submitted work. All other authors have declared no conflict of interest.
References
Author notes
Giuseppe Boriani and Marco Proietti authors contributed equally to the study.
Listed in Supplementary material online, Appendix.
