


Abstract
Randomized controlled trials have shown that cardiac resynchronization therapy (CRT) prolongs survival in patients with heart failure. No studies have explored survival after CRT in relation to individuals in the general population (relative survival, RS). We sought to determine observed and RS after CRT in a nationwide cohort undergoing CRT.
A national administrative database was used to quantify observed mortality for patients undergoing CRT. Relative survival (RS) was quantified using life tables. In 50 084 patients [age 72.1 ± 11.6 years (mean ± standard deviation)] undergoing CRT with (CRT-D) (n = 25 273) or without (CRT-P) defibrillation (n = 24 811) over 8.8 years (median follow-up 2.7 years, interquartile range 1.3–4.8), expected survival decreased with age. Device type, male sex, ischaemic heart disease, diabetes, and chronic kidney disease predicted excess mortality. In multivariate analyses, excess mortality (analogue of RS) was lower after CRT-D than after CRT-P in all patients [adjusted hazard ratio (aHR) 0.80, 95% confidence interval (CI) 0.76–0.84] as well as in subgroups with (aHR 0.79, 95% CI 0.74–0.84) or without (aHR 0.82, 95% CI 0.74–0.91) ischaemic heart disease. A Charlson Comorbidity Index (CCI) ≥3 portended a higher excess mortality (aHR 3.04, 95% CI 2.76–3.34). Relative survival was higher in 2015–2017 than in 2009–2011 (aHR 0.64, 95% CI 0.59–0.69).
Reference RS data after CRT is presented. Sex, ischaemic heart disease, diabetes, chronic kidney disease, and CCI were major determinants of RS after CRT. CRT-D was associated with a higher RS than CRT-P in patients with or without ischaemic heart disease. Relative survival after CRT improved from 2009 to 2017.
Randomized controlled trials have not explored how long a patient a patient is expected to live after undergoing cardiac resynchronization therapy (CRT), compared with an individual in the general population.
We provide reference data on relative survival (RS) for patients treated in real-world clinical practice.
Relative survival was higher in younger patients, in women and in patients without a history of ischaemic heart disease, diabetes, or chronic kidney disease.
CRT-D was associated with a higher RS than CRT-P in patients with or without ischaemic heart disease.
Comorbidity was associated with a markedly lower RS after CRT.
Relative survival after CRT improved from 2009 to 2017.
Introduction
Randomized controlled trials (RCTs) have shown that cardiac resynchronization therapy (CRT) prolongs survival and reduces morbidity in selected patients with heart failure (HF), impaired left ventricular (LV) function and a wide QRS complex. On this basis, CRT is now accepted as a standard treatment for HF.1
In RCTs, treatment effect is usually expressed in terms of relative or absolute risk reduction in adverse clinical outcomes in relation to a control group. Whilst these measures are useful for quantifying treatment effect, they perhaps lack meaning to a patient who wishes to know how long he or she will live after undergoing CRT, compared with an individual in the general population. To address this, we can consider relative survival (RS), which is defined as the observed survival divided by expected survival in the general population. The concept of RS is well developed in the field of cancer and is increasingly being used in cardiovascular disease.
Whilst RCTs are the cornerstone of modern medicine, there is an increasing recognition of the role of real world data in healthcare decision-making. The Food and Drug Administration (FDA), reinforced by the 2016 21st Century Cures Act, promotes the use of such data to make regulatory decisions. Whilst it considers RCTs as central in ‘establishing a baseline for device performance’, it also recognizes that RCTs generally have a narrow scope and that real world data can provide useful information on a wider patient population in the context of real-world clinical practice. In this study, we have explored RS after CRT in the total population of England over a period of 9 years.
Methods
Data sources
This is a non-randomized, retrospective study exploring total mortality after a first CRT device implantation. We have used the National Health Service Hospital Episode Statistics (HES), a data warehouse containing data on admissions to all public hospitals in England, made available by National Health Service Digital. Data from Wales and Scotland is not available in HES. Mortality data was cross-validated with the Office of National Statistics (ONS). These datasets are available to University Hospital Birmingham under a data sharing agreement (section 251 of the National Health Service Act 2006), which obviates the need for Ethical Committee approval. The study was approved by the Clinical Audit Department at the Queen Elizabeth Hospital and conforms to the Declaration of Helsinki.
Our sample included patients who had their first CRT device implantation in England between January 2009 and September 2017. This period was chosen because coding of CRT through the National Tariff was reliable since 2009, when coding procedures were standardized following implementation of the ‘Payment by Results’ initiative. Patients who had received a conventional pacemaker or an implantable cardioverter-defibrillator (ICD) without CRT were excluded. Records of patients undergoing both CRT-D and CRT-P were also excluded, as shown in Figure 1. All patients were censored on 1 October 2017. We used the earliest record of a CRT-P or CRT-D implantation for patients with multiple admissions.
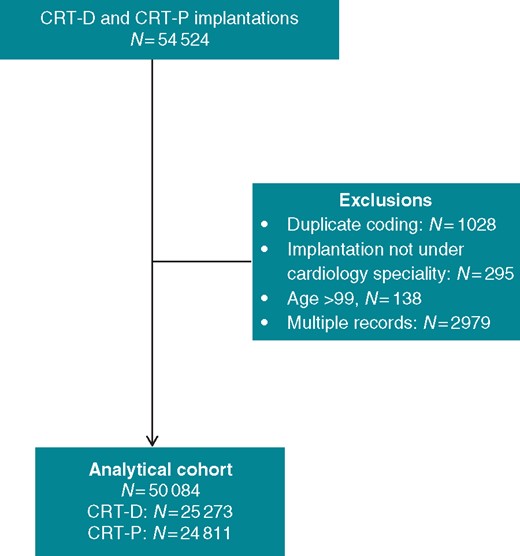
Study flowchart. CRT, cardiac resynchronization therapy.
The 2007 National Institute for Clinical and Care Excellence guidelines recommended CRT-P for patients with non-ischaemic cardiomyopathy (NICM). It was not until 2014 that a guideline change recommended CRT-D for patients with NICM.2 Consequently, England has a comparatively higher CRT-P implantation rate than the rest of Europe and the US. This has allowed us to compare outcomes after CRT-D and CRT-P.
Endpoints
The primary endpoint was total mortality. Survival time based on observed mortality was defined as the duration between the date of implant and date of death, or date of censoring. Expected survival and mortality rates were derived from national life tables in England, matched by age, sex, and calendar year, obtained from the Office of National Statistics.
The secondary endpoint was expected survival, which was calculated according to abridged life tables for national life expectancy based on 5-year age groups. Life expectancy at a given age is the average number of years a person would live, if the patient experienced age-specific mortality rates for that time period throughout life (ONS). We have followed the same template (Supplementary material online, Appendix) to calculate expected years of life after CRT implantation.
Comorbidities
Patients were regarded as having a history of hypertension, diabetes mellitus, chronic kidney disease, or myocardial infarction if these diagnoses appeared as primary or secondary diagnoses in any hospital spell at any time before device implantation, according to coding dating back to 2006. The Charlson Comorbidity Index (CCI) was used as a measure comorbidity, quantified at the same hospital spell as the device implant and categorized as: no comorbidity (CCI = 0); mild (CCI = 1); moderate, (CCI = 2); and severe (CCI ≥ 3).
Aetiology
The underlying aetiology of cardiomyopathy is not specifically coded in HES, so we broadly categorized aetiology as ischaemic if there was a previous coded diagnosis of angina pectoris, acute myocardial infarction, other acute ischaemic heart diseases, chronic ischaemic heart disease, coronary artery bypass grafting, or percutaneous coronary intervention. The codes used according to ICD10 and the Office of Population Censuses and Surveys Classification of Interventions and Procedures-4 (OPCS-4) are shown in the Supplementary material online, Appendix.
Statistical analysis
Continuous variables are expressed as mean (±standard deviation) and compared using the Student’s t-test. Categorical variables were compared using the χ2 statistic. Kaplan–Meier curves and the log-rank test were used to assess observed cumulative survival. Cox proportional hazard models were used to compare risks of observed mortality. Proportionality hypotheses were first verified by visual examination of log (survival) graphs to ensure parallel slopes, and by examining Schoenfeld residuals. A two-sided P-value ≤0.05 was considered statistically significant. Statistical analyses were undertaken using Stata 14 (StataCorp, TX, USA).
Relative survival
This is defined as the observed survival among CRT patients divided by expected survival in the age-, sex-, and year-matched population of England. Accordingly, excess mortality is the analogue of relative survival. It is, in effect, the Kaplan–Meier survivor function over the follow-up time, divided by the expected survival rate in the same time period. We used flexible parametric survival models to estimate excess mortality after CRT, associated with device type, sex, age, comorbidities, ischaemic aetiology, and year of implantation. The flexible parametric approach allowed the use of patient-level data and continuous time. We also used restricted cubic spline functions to estimate the baseline. Model fit was compared using log likelihood, the Bayesian and Akaike information criteria, respectively. The cumulative hazard scale was chosen for ease of comparison with the Cox model.
Results
Baseline characteristics
Over a study period of 8.8 years, a total of 50 084 patients underwent CRT implantation [CRT-D: 25 273 (50.5%), CRT-P: 24 811 (49.5%)] in 173 public hospitals in England (Figure 1 and Supplementary material online, Appendix). The nationwide numbers and distribution of implantations increased over time, as did the proportion of CRT-D implants, which exceeded CRT-P implants by 2014 (Figure 2). Because of the high numbers involved, statistically significant differences (P < 0.001) were observed with respect to all baseline characteristics, despite differences being numerically small (Table 1). Compared with CRT-P patients, CRT-D patients were more likely to have a history of ischaemic heart disease (67.2% vs. 56.0%), and less likely to have hypertension (57.6% vs. 58.8%) or chronic kidney disease (12.4% vs. 15.8%) (all P < 0.001).
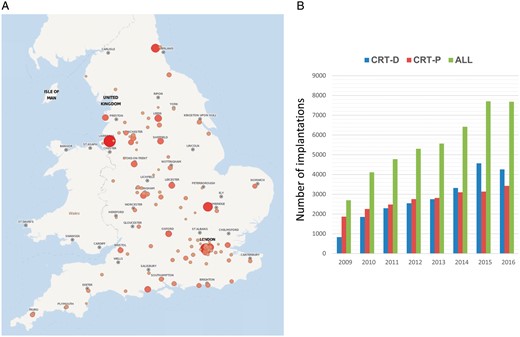
Implant rates in England. (A) The distribution of CRT implantations in England, in the period 2009–2017 is shown. Size and colour of circles are proportional to implant rates. (B) The number of CRT implantations over the study period is shown. Results are presented as number of implants per year. The year 2017 is not shown as data only extends to September. CRT, cardiac resynchronization therapy.
Baseline characteristics
| CRT-D | CRT-P | All | |
|---|---|---|---|
| N (50 084) | 25 273 | 24 811 | 50 084 |
| Sex (male) | 20 423 (80.81) | 17 088 (68.87) | 37 511 (74.90) |
| Age (years) | 68.1 ± 11.1 | 74.3 ± 11.3 | 71.2 ± 11.6 |
| <60 | 4950 (19.59) | 2336 (9.42) | 7286 (14.55) |
| 60–69 | 7184 (28.43) | 4202 (16.94) | 11 386 (22.73) |
| 70–79 | 10 079 (39.88) | 9150 (36.88) | 19 229 (38.39) |
| ≥80 | 3060 (12.11) | 9123 (36.77) | 12 183 (24.33) |
| Charlson Comorbidity Index | |||
| 0 | 5924 (23.44) | 7022 (28.30) | 12 946 (25.85) |
| 1 | 8270 (32.72) | 7549 (30.43) | 15 819 (31.58) |
| 2 | 5765 (22.81) | 4824 (19.44) | 10 589 (21.14) |
| ≥3 | 5314 (21.03) | 5416 (21.83) | 10 730 (21.42) |
| Ischaemic aetiology, n (%) | 16 971 (67.15) | 13 901 (56.03) | 30 872 (61.64) |
| History, n (%) | |||
| Hypertension | 14 565 (57.63) | 14 599 (58.84) | 29 164 (58.23) |
| Diabetes | 6905 (27.32) | 6056 (24.41) | 12 961 (25.88) |
| Chronic kidney disease | 3127 (12.37) | 3924 (15.82) | 7051 (14.08) |
| Myocardial infarction | 4092 (16.19) | 2466 (9.94) | 6558 (13.09) |
| CABG | 1354 (5.36) | 834 (3.36) | 2188 (4.37) |
All comparisons between CRT-D and CRT-P were significant (P < 0.001).
CABG, coronary artery bypass grafting; CRT, cardiac resynchronization therapy.
Observed mortality after CRT-D vs. CRT-P
Over a median follow-up of 2.7 years (interquartile range 1.3–4.8 years), 14 108 (28.1%) patients died, 5975 (23.6%, 8.2 per 100 person-years) after CRT-D, and 8133 (32.8%, 11.1 per 100 person-years) after CRT-P. In Kaplan–Meier survival analyses, CRT-D was associated with a lower observed mortality than CRT-P (log rank P < 0.001) (Supplementary material online, Appendix). All covariates that predicted observed mortality in univariate analyses (Supplementary material online, Appendix) were entered in multivariate models. In the latter, observed mortality was lower after CRT-D [adjusted hazard ratio (aHR) 0.85, 95% confidence interval (CI) 0.82–0.88], after adjustment for age, sex, history of comorbidities, CCI, history of ischaemic heart disease, and year of implantation (Table 2).
Multivariable analyses
| Observed mortality HR (95% CI) | Excess mortality EHR (95% CI) | |
|---|---|---|
| CRT-D | 0.85 (0.82–0.88) | 0.80 (0.76–0.84) |
| Sex (female) | 0.73 (0.70–0.76) | 0.75 (0.70–0.80) |
| Age | 1.04 (1.03–1.04) | 1.01 (1.01–1.01) |
| <60 | – | |
| 60–69 | 1.52 (1.41–1.64) | 1.24 (1.13–1.35) |
| 70–79 | 2.18 (2.04–2.34) | 1.37 (1.26–1.49) |
| ≥80 | 3.44 (3.20–3.70) | 1.38 (1.25–1.53) |
| Charlson Comorbidity Index | ||
| 0 | – | |
| 1 | 1.21 (1.15–1.27) | 1.44 (1.31–1.59) |
| 2 | 1.50 (1.43–1.59) | 2.06 (1.87–2.26) |
| ≥3 | 1.95 (1.84–2.05) | 3.04 (2.76–3.34) |
| Ischaemic aetiology | 1.08 (1.04–1.13) | 1.14 (1.07–1.22) |
| History | ||
| Hypertension | 1.01 (0.97–1.04) | 0.99 (0.94–1.05) |
| Diabetes | 1.14 (1.09–1.19) | 1.20 (1.13–1.27) |
| Chronic kidney disease | 1.67 (1.59–1.75) | 2.09 (1.96–2.23) |
| Myocardial infarction | 1.17 (1.12–1.23) | 1.27 (1.18–1.36) |
| CABG | 0.74 (0.67–0.81) | 0.66 (0.57–0.77) |
| Implant year | ||
| 2009–2011 | – | |
| 2012–2014 | 0.83 (0.80–0.87) | 0.77 (0.73–0.82) |
| 2015–2017 | 0.71 (0.67–0.75) | 0.64 (0.59–0.69) |
Analyses refer to observed mortality and excess mortality. Results are expressed as aHR and 95% CIs.
aHR, adjusted hazard ratio; CABG, coronary artery bypass grafting; CI, confidence interval; CRT, cardiac resynchronization therapy; EHR, excess hazard ratios; HR, hazard ratio.
Relative survival and excess mortality
When adjusting for survival in a matched population, observed survival was lower than survival in the reference population. In multivariable analyses, significant effects on excess mortality were observed for most baseline variables, except for a history of hypertension (Table 2). Excess mortality was lower in CRT-D than after CRT-P (aHR 0.80, 95% CI 0.76–0.84).
Age
CRT-P patients were older than CRT-D patients (74.3 ± 11.3 vs. 68.1 ± 11.1 years). In univariate analyses (Supplementary material online, Appendix), observed mortality increased with increasing age [≥80 years hazard ratio (HR) 4.37, 95% CI 4.07–4.68, compared with <60 years]. In multivariate analyses, age predicted both observed (HR 1.04, 95% CI 1.03–1.04) and excess (HR 1.01, 95% CI 1.01–1.01) mortality (Table 2). As shown in Table 3, the gap between expected survival after CRT and life expectancy in the general population generally decreased with age. In the case of women ≥80 years undergoing CRT-D in 2015–2017 (n = 256), however, expected survival was higher than life expectancy in the general population (Table 3, Figure 3).
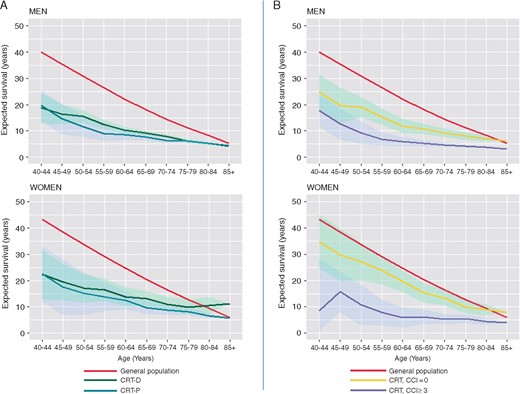
Expected survival after CRT compared with the general population. (A) Expected survival after CRT-D (solid green) or CRT-P (solid blue line) relative to the life expectancy in the general population in England (solid blue line), for the period 2015–2017 is shown. (B) The effect of comorbidity, defined in terms of the CCI is shown. For detailed calculations, see Supplementary material online, Appendix. CRT, cardiac resynchronization therapy.
Expected survival after CRT
| Women | Men | |||||
|---|---|---|---|---|---|---|
| General population | CRT-P | CRT-D | General population | CRT-P | CRT-D | |
| 2015–2017 | ||||||
| 40–44 | 43.07 | 22.40 | 22.20 | 39.95 | 19.58 | 18.71 |
| 45–49 | 38.31 | 17.40 | 19.37 | 35.30 | 14.58 | 16.32 |
| 50–54 | 33.63 | 15.01 | 17.10 | 30.77 | 11.73 | 15.50 |
| 55–59 | 29.07 | 13.88 | 16.33 | 26.35 | 9.08 | 12.58 |
| 60–64 | 24.68 | 12.56 | 13.88 | 22.17 | 8.58 | 10.31 |
| 65–69 | 20.43 | 9.77 | 13.08 | 18.20 | 7.80 | 9.19 |
| 70–74 | 16.43 | 8.81 | 11.07 | 14.49 | 6.35 | 7.98 |
| 75–79 | 12.74 | 8.22 | 9.98 | 11.18 | 6.11 | 6.23 |
| 80–84 | 9.47 | 6.69 | 10.50 | 8.35 | 5.33 | 5.33 |
| 85+ | 5.91 | 5.76 | 11.20 | 5.31 | 4.46 | 4.31 |
| 2012–2014 | ||||||
| 40–44 | 43.00 | 11.05 | 9.83 | 39.76 | 5.94 | 8.90 |
| 45–49 | 38.24 | 11.29 | 9.89 | 35.12 | 7.20 | 9.23 |
| 50–54 | 33.57 | 10.22 | 9.13 | 30.57 | 6.82 | 8.00 |
| 55–59 | 29.01 | 9.59 | 8.25 | 26.15 | 5.70 | 6.69 |
| 60–64 | 24.62 | 7.64 | 7.57 | 21.97 | 5.82 | 5.54 |
| 65–69 | 20.39 | 5.84 | 6.18 | 18.03 | 4.06 | 4.81 |
| 70–74 | 16.39 | 5.07 | 5.06 | 14.37 | 3.69 | 4.38 |
| 75–79 | 12.72 | 4.53 | 4.13 | 11.09 | 3.24 | 3.61 |
| 80–84 | 8.51 | 3.59 | 2.79 | 8.30 | 2.52 | 2.75 |
| 85+ | 5.01 | 2.98 | 2.21 | 5.33 | 2.10 | 2.58 |
| 2009–2011 | ||||||
| 40–44 | 42.69 | 14.10 | 9.09 | 39.26 | 4.98 | 10.45 |
| 45–49 | 37.95 | 9.10 | 9.74 | 34.63 | 4.74 | 7.36 |
| 50–54 | 33.29 | 7.06 | 7.76 | 30.09 | 5.61 | 6.72 |
| 55–59 | 28.77 | 6.74 | 7.27 | 25.73 | 5.39 | 6.98 |
| 60–64 | 24.39 | 8.11 | 5.32 | 21.58 | 4.48 | 6.08 |
| 65–69 | 20.19 | 5.65 | 5.27 | 17.68 | 3.91 | 4.38 |
| 70–74 | 16.24 | 4.68 | 4.75 | 14.09 | 3.28 | 3.86 |
| 75–79 | 12.62 | 3.90 | 3.79 | 10.91 | 2.83 | 3.32 |
| 80–84 | 8.49 | 3.29 | 3.30 | 8.19 | 2.54 | 2.87 |
| 85+ | 5.13 | 2.25 | 4.33 | 5.01 | 2 | 2.47 |
Data refers to expected survival in years after CRT-P and CRT-D and life expectancy in the general population in England, from 2015 to 2017, from 2012 to 2014, and from 2009 to 2011.
CRT, cardiac resynchronization therapy.
Sex
Most patients were men [37 511 (74.9%), P < 0.001] (Table 1). In univariate analyses, observed mortality was higher in men (HR 1.41, 95% CI 1.36–1.47) (Supplementary material online, Appendix). In multivariate analyses, both observed (HR 0.73, 95% CI 0.70–0.76) and excess mortality (HR 0.75, 95% CI 0.70–0.80) were lower in women than in men. A shown in Figure 3 and Table 3, expected survival after either CRT-D or CRT-P was consistently higher in women. Importantly, however, survival of women in the general population was also higher (Table 3, Figure 3).
Comorbidity
Differences in the CCI between the CRT-D and CRT-P groups were statistically significant, albeit numerically small (Table 1). Observed mortality increased with higher commodity (Table 3 and Supplementary material online, Appendix). For patients with a CCI ≥3, the risk of excess mortality was 3 times higher than those with a CCI = 0 (Table 2). As shown in Figure 3B, CCI had a profound influence on expected survival after CRT.
Aetiology
Most patients had ischaemic heart disease [30 872 (61.6%)] (Table 1). In univariate analyses, an ischaemic aetiology was associated with a higher observed mortality (HR 1.44, 95% CI 1.39–1.49) (Supplementary material online, Appendix). In multivariate analyses, an ischaemic aetiology was associated with a higher observed (HR 1.08, 95% CI 1.04–1.13) and excess (HR 1.14, 95% CI 1.07–1.22) mortality (Table 2).
In patients with ischaemic heart disease, CRT-D was associated with a lower observed (aHR 0.83, 95% CI 0.80–0.87) and excess (aHR 0.79, 95% CI 0.74–0.84) mortality than CRT-P after covariate adjustment. In patients without a history of ischaemic heart disease, CRT-D was also associated with a lower observed (aHR 0.88, 95% CI 0.83–0.94) and excess (aHR 0.82, 95% CI 0.74–0.91) mortality after covariate adjustment.
Year of implantation
Compared with 2009–2011, excess mortality was lower in the period 2012–2014 (HR 0.77, 95% CI 0.73–0.82) and in 2015–2017 (HR 0.64, 95% CI 0.59–0.69) (Table 2). The gap in expected survival for CRT patients and survival in the general population narrowed over the time period from 2009 to 2017 (Table 2 and Supplementary material online, Appendix).
Other variables
The influence of other variables on observed and excess mortality after CRT-D and CRT-P is shown in Figure 4.
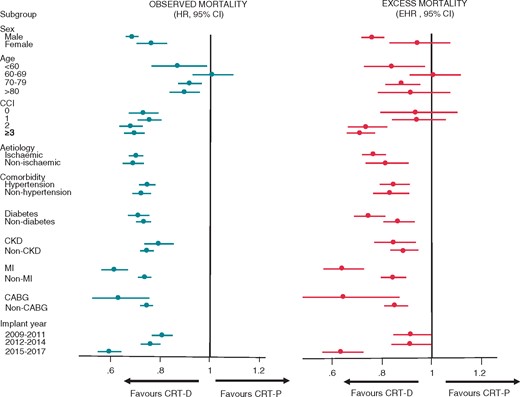
Observed and expected survival: subgroup analyses. Observed and excess mortality after CRT-D and CRT-P in subgroups, expressed in terms of HRs and EHRs, respectively. CCI, Charlson Comorbidity Index; CRT, cardiac resynchronization therapy; EHR, excess hazard ratios; HR, hazard ratio.
Discussion
This is the largest study on long-term outcomes of CRT of a real-world, nationwide population of patients undergoing CRT, in terms of patient numbers and length of follow-up. It has emerged in the context of the CRT survey II which, whilst comprehensively describing CRT implantation practice in Europe, does not provide follow-up data.3 An unique aspect of this study is the quantification of RS, which expresses how long a patient is expected to live after CRT compared with a matched individual in the general population. Several findings have emerged. First, survival after CRT was lower than in the general population at most ages. Second, RS after CRT was highest in younger patients. Third, male sex, history of ischaemic heart disease, diabetes, and chronic kidney disease were associated with a lower RS. Fourth, CRT-D was associated with a higher RS than CRT-P in the overall study sample, as well as in subgroups with or without ischaemic heart disease. Fifth, RS decreased with increasing comorbidities, assessed using the CCI. Sixth, RS after CRT decreased from 2009 to 2017.
Expected survival after CRT
Data on how long a CRT patient is expected to live has previously been based on modelling analyses from RCT data.4 Arguably, however, these data do not reflect the ‘real world’, insofar as they reflect a highly selected population with limited follow-up. In this study, we provide empirical data from real-world clinical practice to inform on how long a patient survives after CRT. For example, a male patient aged 40 years lived 18.7 years after CRT-D, which compares with 40.0 years for an individual of the same age in the general population. On the other hand, a male patient aged 85 years lived 4.3 years after CRT-D, which compares with 5.3 years for an individual of the same age in the general population.
Our findings indicate that, even if the treatment effect of CRT was similar at all ages, the ‘background’ mortality governs how long a patient will survive after CRT. In other words, CRT could be equally effective at all ages, but absolute survival is also influenced by sex and the ageing process. In this context, we should consider that RS is not a measure of treatment effect.
CRT-D vs. CRT-P
In the Comparison of Medical Therapy, Pacing and Defibrillation in Heart Failure (COMPANION) study, which included patients undergoing CRT-D, CRT-P or optimum medical therapy only, showed that CRT-D was associated with a lower mortality than optimum medical therapy. The study, however, was not designed to compare CRT-D with CRT-P. In the DANISH (Defibrillator Implantation in Patients with Nonischaemic Systolic Heart Failure) study, 1116 patients with NICM were randomized to ICDs or usual care, which included CRT-P.5 After a median follow-up period of 5.63 years, ICD did not reduce total mortality (HR 0.87, 95% CI 0.68–1.12; P = 0.28), despite a significant reduction in sudden cardiac death (HR 0.50, 95% CI 0.31–0.82; P = 0.005). Notwithstanding, several meta-analyses involving higher patient numbers have shown a benefit in total mortality from ICDs in patients with NICM.6 In an observational study of 1500 patients, we found that CRT-D was associated with a lower total mortality (HR 0.62) in patients with ischaemic cardiomyopathy (ICM) after propensity matching.7 In contrast, total mortality after CRT-D and CRT-P was similar in patients with NICM. Kutyifa et al.8 also showed no mortality benefit from CRT-D vs. CRT-P patients with NICM. In a recent multicentre, European cohort study of 5307 patients, Barra et al.9 found a superiority of CRT-D vs. CRT-P after propensity matching in ICM, but not in NICM. In the present study, which involves much higher patient numbers, we found a lower observed and excess mortality after CRT-D than after CRT-P in patients with or without ischaemic heart disease after covariate adjustment. In fact, CRT-D was superior to CRT-P in most subgroup analyses. Together, these findings suggest that only numbers as high as those presented herein are needed to show a superiority of CRT-D over CRT-P.
Sex
Sex-specific differences in survival were not observed in COMPANION (Comparison of Medical Therapy, Pacing and Defibrillation in Heart Failure)10 or CARE-HF (Cardiac Resynchronization in Heart Failure).11 However, a substudy of MADIT-CRT (Multicenter Automatic Defibrillator Implantation Trial with Cardiac Resynchronization Therapy) showed that survival from CRT-D vs ICD was better in women (25% of the study population).12 These findings are also consistent with data from the US National Cardiovascular Data Registry, in which benefit from CRT-D over ICD was greater in women than in men with a left bundle branch block.13 In a meta-analysis of 33 434 patients from 72 studies, women had approximately a 33% lower total mortality HF hospitalization after CRT.14 Better outcomes in women have also been reported by other observational studies.15,16 We found that CRT was associated with a higher RS in women. However, survival of women in the general population was also higher. This suggests that CRT may not necessarily be more effective in women, but that women may live longer after CRT simply because they are women. Differences in mortality between men and women in observational CRT studies may therefore reflect a difference in sex-specific ‘background’ survival rather than a difference in the effectiveness of CRT.
Comorbidity
Heart failure often associated with multiple comorbidities. The finding that co-morbidity did not alter the survival benefit of CRT-D over ICD in MADIT-CRT,17 is not unexpected, as RCTs tend to include highly selected patients. In contrast, several observational studies have shown that diabetes, renal failure, and chronic obstructive pulmonary disease have a negative impact on survival after cardiac electronic device implantation. In an observational study of 463 CRT-D patients, Theuns et al.18 showed that 81% of patients had at least three comorbid conditions and that an age-adjusted CCI ≥ 5 predicted mortality (HR 3.69, P < 0.001). Similarly, in a study of 697 CRT patients, Ioannou et al.19 found that each tertile of Charlson age comorbidity index was independently associated with a 37% higher total mortality. We too have found that CCI as well as diabetes and chronic kidney disease have a major impact on mortality after CRT. Compared with a CCI = 0, a CCI ≥ 3 was associated with three-fold higher excess mortality, independent of known confounders. These findings emphasize the importance of assessing comorbidity in risk stratification of patients undergoing CRT.
Date of implantation
Compared with the period 2009–2011, total mortality after CRT was 17% was lower in the period 2012–2014 and 29% lower in the period 2015–2017. Whilst the reasons for this cannot be ascertained by this study, this trend is not unexpected, given the increasing tendency to treat patients with mild HF. Advances in drug therapy, HF management, device optimization algorithms, and the increasing use of quadripolar leads20 may also contribute.
Limitations
This study has the typical limitations of an observational, retrospective study using data from administrative databases which, although rich in numbers, typically lack granularity. First, we do not have data on New York Heart Association (NYHA) class, the aetiology of the underlying cardiomyopathy, LV function, QRS duration or morphology, nor medication, all of which have been linked to response after CRT. Second, we have not included a control group on optimal medical therapy, and therefore, we cannot comment on the relative benefits of CRT vs. medical therapy. Third, in order to explore the relative benefits of CRT-D over CRT-P, we used history of coronary events leading to a hospitalization as a surrogate. This, however, does not equate to an underlying ischaemic aetiology, as patients who had never been hospitalized may also have ischaemic heart disease. Although a possible bias emerges from the fact that life tables also include CRT patients, this is likely to be negligible.
Conclusions
This study of a nationwide, real-world population of patients undergoing CRT provides reference data on RS after CRT, delivered in real-world clinical practice, from the perspective of a public national health service. RS was higher in younger patients, in women and in patients without a history of ischaemic heart disease, diabetes or chronic kidney disease. CRT-D was associated with a higher RS than CRT-P in patients with or without ischaemic heart disease. Comorbidity was associated with a worse outcome.
Funding
This study was funded by an unrestricted educational grant from Boston Scientific.
Conflict of interest: F.L. is a consultant and has received research support from Medtronic Inc, Abbott, Boston Scientific and Microport. All other authors report no conflicts of interest.
References
National Institute of Health and Care Excellence. NICE Technology Appraisal [TA 314]: Implantable Cardioverter Defibrillators and Cardiac Resynchronisation Therapy for Arrhythmias and Heart Failure (review of TA95 and TA120). http://www.nice.org.uk/Guidance/TA314 (1 August 2018, date last accessed).
4.
9.
12.
13.
15.
16.
17.
19.
