


The purpose of the this study was to evaluate a possible genotype–phenotype correlation in BrS patients and to analyze possible associations with clinical events in affected patients. SCN5A gene encodes the alpha-subunit of the voltage-gated sodium channel NaV1.5. Its mutations are associated with a broad spectrum of hereditary arrhythmias such as long-QT syndrome, cardiac conduction diseases, and Brugada syndrome (BrS). Experimental studies have shown an interaction between SCN5A and cellular cytoskeleton, explaining its functional role in cellular integrity of heart cells.
Cardiovascular magnetic resonance was performed on 81 consecutive genetically screened BrS patients and 30 healthy controls. Left ventricular (LV) and right ventricular (RV) volumes and dimensions were assessed and compared with respect to the genotype. Brugada syndrome patients with an SCN5A mutation (16 patients; 20%) revealed significantly larger RV volumes, along with lower RV ejection fraction, than patients without a mutation or controls, indicating a more severe phenotype in patients with a mutation. Furthermore, patients with an SCN5A mutation showed significantly more often a spontaneous type 1 BrS-electrocardiogram (ECG). In multivariate analysis, the presence of a spontaneous type 1 BrS-ECG showed the strongest association with cardiac events. Receiver-operating characteristic curve analysis indicated good predictive performance of RV end-diastolic volume, RV end-systolic, and LV cardiac output (area under the curve = 0.81, 0.81, and 0.2), with respect to the presence of an SCN5A mutation.
Brugada syndrome patients with an SCN5A mutation reveal distinct changes in RV volumes and function when compared with those without an SCN5A mutation. Furthermore, mutation-positive patients have a higher likelihood of a spontaneous type 1 BrS-ECG, which is associated with a higher incidence of clinical events. Cardiovascular magnetic resonance may provide additional insight to distinguish between SCN5A mutation-positive and -negative BrS patients.
Mutations in the SCN5A gene lead to larger RV volume and decreased RV ejection fraction.
Brugada patients positive for an SCN5A mutation have a higher likelihood of diagnostic type 1 ECG than mutation-negative patients.
The presence of an SCN5A mutation was not associated with clinical events in logistic regression analysis.
Introduction
Brugada syndrome (BrS) is a hereditary cardiac disorder characterized by ventricular tachyarrhythmias, associated with a high risk for sudden cardiac arrest (SCA) in young and otherwise healthy adults. Genetic abnormalities causing BrS have been linked to mutations in several cardiac ion channel genes and can be found in up to one-third of genotyped BrS patients.1 The inheritance of BrS occurs via an autosomal-dominant mode of transmission. First gene linked to BrS was SCN5A, yet so far 12 responsible genes have been reported. In all 12 genotypes, either a decrease in the inward sodium or calcium current, or an increase in one of the outward potassium currents has been shown to be associated with the BrS phenotype. Loss of function of the INa channel resulting from changes in the functional properties (gating) of the mutant Na+ channels or failure of expression in the sarcolemma (trafficking) is the major effect of these mutations. Also, decreased activity of cardiac L-type calcium channels (CACNA1C and CACNB2) can be causes of both short-QT interval and a coved-type electrocardiogram (ECG) pattern. More than 80 mutations in SCN5A have been linked to the syndrome since 2001. A reduction of sodium currents, either by a reduction of Na+ channel expression or via alteration in channel gating properties, has impact on conduction properties and presents the proposed disease causing mechanism in BrS. In our previous studies, we have identified subtle structural alterations, involving the right ventricular (RV) diameter, its function, and RV outflow tract (RVOT) in a cohort of Brugada patients.2 Experimental studies have shown an interaction between SCN5A and cellular cytoskeleton, explaining its functional role in cellular integrity of heart cells. The purpose of the following study was to elucidate a possible genotype–phenotype correlation in BrS patients and to analyse possible associations with clinical events in affected patients.
Methods
Between March 2002 and September 2012, 119 patients were newly diagnosed with BrS at our centre. Out of 119 patients, 17 patients have not undergone cardiovascular magnetic resonance (CMR) and 21 patients rejected genetic screening. Overall, a cohort of 81 Brugada patients was available for the current study (56 males and 25 females; mean age 43 ± 12 years). Diagnosis of BrS was based on the criteria of the BrS consensus report.3 All patients have undergone diagnostic workup, including serial resting ECG, standardized echocardiography, and CMR imaging. Arrhythmogenic RV cardiomyopathy (ARVC) was excluded in accordance with the task force criteria for diagnosis of ARVC. Genetic screening for known Brugada-associated mutations included the genes SCN5A, GPD-1L, CACNA1C, CACNB2, KCNE3, and SCN1B. Complete electrophysiological studies were performed and available in 78 patients (98%). During programmed ventricular stimulation, two extrastimuli at basis cycle length (CL) (500, 430, and 370 ms) and three extrastimuli at CL 500 ms were applied to the RV apex and RVOT.
Cardiovascular magnetic resonance images were analysed both qualitatively and quantitatively, blinded to clinical and electrocardiographic characteristics. Study cohort was compared with a control population. Controls were matched to the cases based on their age (±5 years) and gender in a frequency matching fashion. After institutional review board approval, 30 healthy volunteers without medical history (21 men and 9 women, mean age 45 ± 8 years) were recruited from our hospital staff. All volunteers showed no contraindications for magnetic resonance imaging and fulfilled the following criteria: normal physical examination, normal blood pressure (<120 and <80 mmHg), normal ECG findings, no history of chest pain or dyspnoea, no diabetes, and normal two-dimensional echocardiography. None of the controls was taking any medication. Exclusion criteria were the symptoms of cardiac diseases, hypertension, diabetes, smoking, or participation in competitive or excessive sports. All control subjects underwent CMR examination using the same protocol. The study was approved by the local ethics committee (Medizinische Ethik-Kommission II, Medizinische Fakultät Mannheim der Ruprecht-Karls-Universität Heidelberg) and written informed consent was obtained from all subjects, participating in the study.
Image acquisition and analysis
All studies were performed using a 1.5 T whole body imaging system (Magnetom Avanto and Sonata, Siemens Medical Systems, Healthcare Sector, Erlangen, Germany) using a four-element (Sonata) or a six-element (Avanto), phased-array body coil. Images were acquired during repeated end-expiratory breath-holds. Scout images (coronal, sagittal, and axial planes) were obtained for planning of the final double-oblique long-axis and short-axis views. To evaluate functional parameters, ECG-gated cine images were then acquired using a segmented true fast imaging steady-state free-precession (FISP) sequence [echo time (TE)/repetition time (TR) 1.2/3.2 ms, temporal resolution 35 ms, in-plane spatial resolution 1.4 × 1.8 mm2, slice thickness 6 mm, interslice gap 4 mm]. Seven to 12 short-axis views covering the whole left and right ventricle were obtained.
For the evaluation of the RV anatomy and morphology, a dark blood prepared T1-weighted multi-slice turbo spin-echo pulse sequence was used to obtain axial images from the diaphragm to the level of the right coronary artery (i.e. to include the pulmonary outflow tract). Imaging parameters were as follows: TR = 800 ms, TE = 24 ms, slice thickness = 4 mm, interslice gap = 2 mm, and field of view = 24–28 cm.
In 60 of 81 patients, late gadolinium enhancement (LGE) imaging was performed. The LGE images were obtained 10–15 min after intravenous administration of 0.2 mmol/kg bodyweight of a gadolinium-based contrast agent (gadoterate meglumine) using an inversion recovery turbo fast low-angle shot 2D sequence or a phase-sensitive inversion recovery true FISP sequence with a slice thickness of 6 mm at the same plane position as the long- and short-axis cines in end diastole. Inversion time was adjusted individually to optimally null signal from normal myocardium and ranged typically between 250 and 300 ms. The presence of LGE was assessed visually after the consensus of two experienced readers.
Left ventricular (LV) end-diastolic (ED) volumes, LV end-systolic (ES) volumes, LV stroke volume, LV ejection fraction (EF), LV cardiac output (CO), and LV myocardial mass were assessed offline from the serial short-axis true FISP cine loops using dedicated commercially available software (ARGUS, Siemens, Erlangen, Germany). In addition to volumetric measurements, one-dimensional measurements of LV ED dimensions (LVEDDs), posterior wall thickness (PWT), and maximum interventricular septum wall thickness were measured from ED short-axis views. The area of the RVOT was measured on axial spin-echo images as described previously.2 Cardiovascular magnetic resonance parameters and dimensions were measured by consensus of two experienced readers, blinded to all clinical patient details.
Genetic analysis
Genetic testing and mutation analysis was performed by the Masonic Medical Research Laboratory (Utica, NY, USA). In brief, genomic DNA was prepared from peripheral blood lymphocytes of the patient.4 Genomic DNA was extracted from peripheral blood leukocytes using a commercial kit. All known exons of the Brugada-susceptibility genes (SCN5A, SCN1B, CACNB2B, CACNA1C, KCNE3, and GDP1L) were amplified with intronic primers and sequenced in both directions to probe for mutations, with the use of an automated DNA sequencer. In order to avoid bias, Brugada patients with genetic variations and polymorphisms were not included. Mutations were considered when disrupting either the open reading frame or the splice site. All reported mutations were previously published in the compendium of SCN5A mutations.5
Statistical analysis
Data are presented as mean ± SD. Continuous variables were checked for normality using the Shapiro–Wilk test (W > 0.95) and compared using two-tailed Student's t-test for parametric and Mann–Whitney U test for non-parametric variables. Categorical variables were compared with the χ2 test. A P value <0.05 was considered statistically significant.
Area under the curve (AUC) analysis was performed to evaluate whether increased indexed RV ED volume (RVEDVi) and ES volume (RVESVi) and decreased indexed LV cardiac output (LVCOi), indexed RV cardiac output (RVCOi), and RV ejection fraction (RVEF) would increase the likelihood of having an SCN5A mutation. Receiver-operating characteristic (ROC) analysis was used to determine the optimal cut-off value of RVEDVi, RVEDVi, LVCOi, and RVEF to discriminate SCN5A mutation-positive from mutation-negative patients.
Multivariate analysis was performed with logistic regression analysis using block entry of the following variables: SCN5A mutation, spontaneous diagnostic type 1-BrS-ECG, family history of SCA, inducibility in electrophysiologic study (EPS), RVEDVi, RVESVi, RVOTi, RVEF, and LV ejection fraction (LVEF) to evaluate if these variables were independent predictors of cardiac events, provided to have a P < 0.10 in univariate analysis. The SPSS software package (Chicago, IL, USA; version 20) was used for analysis.
Results
Baseline characteristics and clinical data of BrS patients and healthy controls are presented in Table 1. Demographic data were comparable between cases and healthy controls. A total of 23 BrS patients presented with syncope and another 2 with history of SCA (overall event rate 31%). Familial history of unexplained SCA was documented in nine patients (11%). In 40 patients (50%), ventricular tachycardia/fibrillation (VT/VF) was inducible during programmed ventricular stimulation. A diagnostic type 1 ECG was present in 37 patients (46%). In 44 patients, a diagnostic type 1 ECG was revealed after a drug provocation test with a sodium channel blocker (ajmaline, up to 1 mg/kg body weight). Quantitative CMR parameters of BrS patients and healthy controls are displayed in Table 2. Patients with BrS revealed significantly larger RVOT diameters when compared with matched controls. Additionally, significantly increased RVESV and decreased RVEF were observed in BrS patients (P < 0.01). Furthermore, BrS patients had slightly decreased LVEF values when compared with controls, however, not statistically significant (P = 0.07).
Characteristics of BrS patients and matched controls
| BrS patients | Controls | P-value | |
|---|---|---|---|
| Included, n (%) | 81 (100%) | 30 (100%) | |
| Age, year | 43 ± 12 | 46 ± 8 | 0.2 |
| Male sex, n (%) | 56 (69%) | 21 (70%) | 0.9 |
| Spontaneous type 1-ECG, n (%) | 37 (46%) | n.a. | |
| Syncope or SCD at presentation, n (%) | 25 (31%) | n.a. | |
| Family history for SCD, n (%) | 9 (11%) | n.a. | |
| Inducibility during EPS, n (%) | 40 (50%) | n.a. | |
| Presence of SCN5A mutation, n (%) | 16 (20%) | n.a. | |
| Presence of CACNA1C mutation, n (%) | 3 (4%) | n.a. | |
| Presence of CACNB2 mutation, n (%) | 2 (3%) | n.a. |
Comparison of CMR data between BrS patients and controls
| BrS patients (n = 81) | Controls (n = 30) | P-value | |
|---|---|---|---|
| LVEF (%) | 58 ± 5 | 60 ± 5 | 0.07 |
| EDMi (g/m²) | 62.6 ± 13.9 | 61.5 ± 14.5 | 0.74 |
| LVEDVi (mL/m²) | 74.6 ± 13.6 | 74.4 ± 12.0 | 0.94 |
| LVESVi (mL/m²) | 31.5 ± 7.8 | 30.1 ± 5.7 | 0.84 |
| LVSVi (mL/m²) | 43.1 ± 7.9 | 44.2 ± 8.8 | 0.52 |
| LVCOi (L/min m²) | 3.0 ± 0.6 | 3.0 ± 0.7 | 0.71 |
| Septal wall thickness (mm) | 9.9 ± 5.2 | 8.9 ± 2.4 | 0.34 |
| PWT (mm) | 8.2 ± 1.8 | 7.6 ± 2.0 | 0.13 |
| LVEDD (mm) | 52.0 ± 7.3 | 51.2 ± 4.4 | 0.51 |
| RVEF (%) | 55 ± 6 | 60 ± 5 | <0.01 |
| RVEDVi (mL/m²) | 74.2 ± 12.6 | 69.2 ± 12.7 | 0.07 |
| RVESVi (mL/m²) | 33.4 ± 8.7 | 27.1 ± 6.9 | <0.01 |
| RVSVi (mL/m²) | 40.0 ± 7.6 | 41.7 ± 7.8 | 0.35 |
| RVCOi (L/min m²) | 2.8 ± 0.6 | 2.9 ± 0.6 | 0.58 |
| RVEDD (mm) | 42.5 ± 6.6 | 42.0 ± 5.1 | 0.72 |
| RVOTi | 5.3 ± 1.1 | 4.6 ± 0.8 | <0.01 |
One of 60 patients that received contrast agent showed subepicardial LGE in the LV myocardium indicative of a myocarditis and compatible with the clinical history of the patient.
All reported BrS patients have undergone genetic screening. A mutation in the SCN5A gene was present in 16 of 81 patients (20%). Among 16 mutations, truncating/splice error mutation was present in 3 patients; 13 patients had missense mutations in the SCN5A gene. Five BrS patients had mutations in calcium channel coding genes (three patients with CACNA1C and two patients with CACNB2 mutation). Comparison of the small subgroup of five patients with mutations in calcium channel coding genes with mutation-negative patients did not show any significant differences in the CMR measurements.
Demographic and clinical data of 16 SCN5A mutation-positive, 60 mutation-negative Brugada patients and 30 healthy, age- and sex-matched controls are displayed in Table 3. Patients positive for an SCN5A mutation were more likely to have a spontaneous type 1-ECG than patients without mutation (69 vs. 38%; P = 0.04). History of cardiac events (syncope and/or survived cardiac arrest) at the time of evaluation was not different among patients with and without SCN5A mutation. Noteworthy, history of syncope or SCA was more frequent among patients with spontaneous type 1-ECG than in those without (46 vs. 18%; P = 0.009).
Clinical characteristics of SCN5A mutation-positive and -negative BrS patients
| SCN5A mutation-positive | SCN5A mutation-negative | Controls | P-value* | |
|---|---|---|---|---|
| Included, n | 16 | 60 | 30 | |
| Age, year | 43 ± 11 | 43 ± 12 | 46 ± 8 | 0.92 |
| Male sex, n (%) | 10 (63%) | 41 (68%) | 21 (70%) | 0.77 |
| Spontaneous type 1-ECG, n (%) | 11 (69%) | 23 (38%) | 0.04 | |
| Cardiac events at first presentation, n (%) | 3 (19%) | 20 (33%) | 0.36 | |
| Family history of SCD, n (%) | 2 (13%) | 6 (10%) | 0.67 | |
| Inducibility during EPS, n (%) | 30 (50%) | 8 (50%) | 1.0 |
*SCN5A positive vs. negative.
Comparison of CMR findings of mutation-positive and -negative BrS patients and healthy controls
| SCN5A mutation-positive | SCN5A mutation-negative | Controls | P-value* | P-value** | P-value*** | |
|---|---|---|---|---|---|---|
| LVEF (%) | 57.9 ± 4.8 | 58.3 ± 5.4 | 60.2 ± 4.5 | 0.80 | 0.12 | 0.10 |
| EDMi (g/m²) | 64.1 ± 14.8 | 62.4 ± 14.3 | 61.5 ± 14.5 | 0.72 | 0.61 | 0.78 |
| LVEDVi (mL/m²) | 74.9 ± 14.2 | 74.4 ± 13.6 | 74.4 ± 12.0 | 0.91 | 0.90 | 1.00 |
| LVESVi (mL/m²) | 32.6 ± 7.8 | 31.2 ± 7.8 | 30.1 ± 5.7 | 0.58 | 0.27 | 0.52 |
| LVSVi (mL/m²) | 41.4 ± 8.1 | 43.4 ± 8.2 | 44.2 ± 8.8 | 0.45 | 0.34 | 0.66 |
| LVCOi (L/min m²) | 2.7 ± 0.6 | 3.0 ± 0.5 | 3.0 ± 0.7 | 0.05 | 0.05 | 0.80 |
| Septal wall thickness (mm) | 8.9 ± 2.5 | 10.2 ± 5.9 | 8.9 ± 2.4 | 0.43 | 0.96 | 0.26 |
| PWT (mm) | 7.7 ± 1.6 | 8.3 ± 1.9 | 7.6 ± 2.0 | 0.26 | 0.85 | 0.10 |
| LVEDD (mm) | 53.7 ± 4.3 | 51.3 ± 7.9 | 51.2 ± 4.4 | 0.25 | 0.07 | 0.96 |
| RVEF (%) | 51.7 ± 6.1 | 55.5 ± 5.4 | 59.8 ± 4.9 | 0.03 | <0.01 | <0.01 |
| RVEDVi (mL/m²) | 80.2 ± 5.5 | 73.6 ± 13.4 | 69.2 ± 12.7 | 0.01 | 0.02 | 0.16 |
| RVESVi (mL/m²) | 38.1 ± 3.7 | 32.7 ± 9.3 | 27.1 ± 6.9 | <0.01 | <0.01 | 0.01 |
| RVSVi (mL/m²) | 37.5 ± 7.5 | 40.9 ± 7.7 | 41.7 ± 7.8 | 0.17 | 0.13 | 0.69 |
| RVCOi (L/min m²) | 2.3 ± 0.5 | 2.9 ± 0.6 | 2.9 ± 0.6 | 0.01 | 0.01 | 0.81 |
| RVEDD (mm) | 42.0 ± 4.4 | 42.5 ± 7.6 | 42.0 ± 5.1 | 0.81 | 0.98 | 0.74 |
| Right atrial diameter (mm) | 45.3 ± 5.4 | 44.2 ± 7.5 | 43.6 ± 5.5 | 0.58 | 0.33 | 0.73 |
| RVOTi | 5.7 ± 1.3 | 5.3 ± 1.1 | 4.6 ± 0.8 | 0.25 | 0.01 | 0.03 |
*SCN5A positive vs. negative.
**SCN5A positive vs. controls.
***SCN5A negative vs. controls.
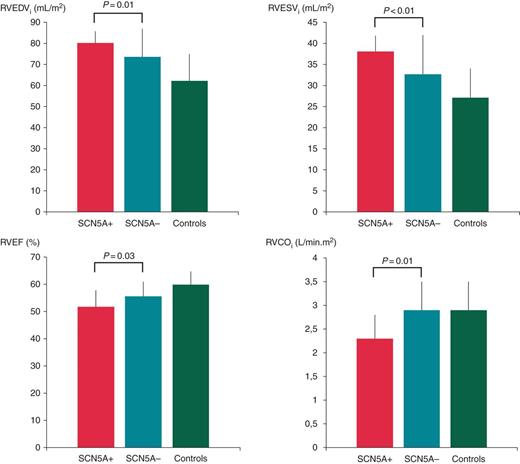
Comparison of RV CMR measurements between SCN5A mutation-positive and -negative BrS patients. RVEF, right ventricular ejection fraction; RVEDVi, indexed right ventricular end-diastolic volume; RVESVi, indexed right ventricular end-systolic volume; RVCOi, indexed right ventricular cardiac output.
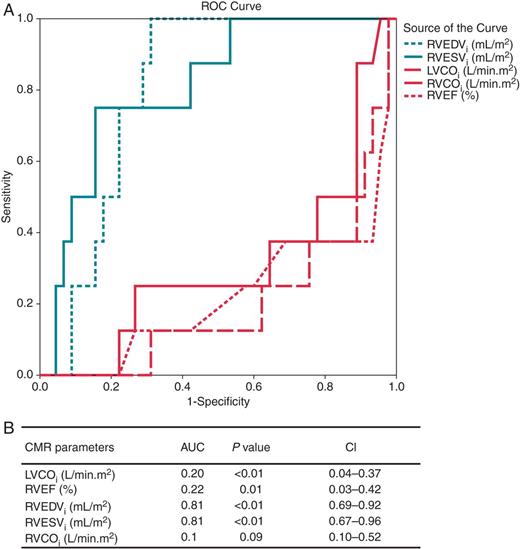
Receiver-operating characteristic curve analysis of RVEDVi, RVESVi, RVEF, LVCOi, and RVCOi as predictors of SCN5A mutation-positive patients. (A) Mean AUC with 95% CIs are presented. (B) The corresponding ROC curves. AUC, area under the curve; CIs, confidence intervals; LVCOi, indexed left ventricular cardiac output; RVEF, right ventricular ejection fraction; RVEDVi, indexed right ventricular end-diastolic volume; RVESVi, indexed right ventricular end-systolic volume; RVCOi, indexed right ventricular cardiac output.
The ROC curve indicates that the cut-off value for RVEDVi of 75.9 mL/m2 has optimal discriminative power to predict the presence of an SCN5A mutation, yielding a sensitivity of 87.5% and specificity of 68.9%. The optimal cut-off value for RVESVi was calculated to 33.5 mL/m2 showing a sensitivity of 87.6% and specificity of 60.7%.
Univariate analysis showed among available clinical data an association between spontaneous type 1-ECG and history of syncope or SCA [odds ratio: 3.8, confidence interval (CI) = 1.4–10.4]. In this context, analysis of CMR parameters showed a significant association with reduced RVEF (r = −0.2). Additionally, there was a notable trend between increased RVOT areas and increased RVED volumes and history of syncope or SCA. Multivariate logistic regression analysis revealed that the presence of a spontaneous type 1-ECG, RVEDVi, and RVEF was independently associated with aborted SCA, or syncope at the time of diagnosis (Table 5).
Parameters related to history of syncope or survived cardiac arrest in univariate and multivariate analysis
| Univariate analysis | Multivariate analysis | |||||
|---|---|---|---|---|---|---|
| OR/r | CI | P-Value | OR | CI | P-value | |
| SCN5A mutation | 1.0 | 0.3–3.3 | 1.0 | |||
| Type 1-ECG | 3.8 | 1.4–10.4 | 0.007 | 18.3 | 3.8–88.5 | 0.009 |
| Family history of SCD | 0.3 | 0.03–2.1 | 0.3 | |||
| Inducibility in EPS | 1.2 | 0.5–3.1 | 0.9 | |||
| RVEDVi | 0.17 | – | 0.09 | 1.23 | 1.1–1.4 | 0.03 |
| RVESVi | 0.16 | – | 0.1 | |||
| RVOTi | 0.19 | – | 0.07 | ns | ns | ns |
| RVEF | −0.21 | – | 0.03 | 0.8 | 0.6–0.9 | 0.03 |
| LVEF | 0.13 | – | 0.19 | |||
OR, odds ratio; r, Pearson's correlation coefficient; CI, confidence interval; ns, non-significant.
Follow-up (FUP) was available in 97% of patients. Median FUP duration was 105 months (interquartile range 69–125). No patient died; however, six patients were lost to FUP. Relevant cardiac symptoms occurred in eight patients (Table 6). One patient had adequate implantable cardioverter-defibrillator (ICD) shock due to VT/VF. Three patients experienced syncope, which was after careful examination presumed to be of arrhythmic nature and consequently led to an ICD implantation. Two patients had vasovagal syncope. This was evidenced by the presence of typical clinical prodromes and in one patient lack of documented arrhythmias in the ICD memory. One patient suffered from acute myocardial infarction requiring coronary intervention. One patient experienced episodes of paroxysmal atrial fibrillation that was temporarily treated with quinidine, however, discontinued due to poor tolerance. There were no correlations between CMR parameters, clinical characteristics or demographics and the occurrence of arrhythmic events during FUP.
Overview of cardiac symptoms during follow-up
| Case | Sex | Age at diagnosis | Symptom | FUP month | Age at symptom | Mutation | RVOT (cm) | RVEF (%) | LVEF (%) |
|---|---|---|---|---|---|---|---|---|---|
| 1 | M | 35 | VF with ICD shock | 35 | 38 | SCN5A (truncating) | 11.7 | 47 | 61 |
| 2 | F | 55 | Syncope caused by arrhythmia | 29 | 57 | SCN5A (compound heterozygotic, missense) | 6.8 | 48 | 59 |
| 3 | M | 59 | Syncope caused by arrhythmia | 7 | 60 | Negative | 12.0 | 57 | 66 |
| 4 | F | 42 | Syncope caused by arrhythmia | 55 | 47 | SCN5A (missense) | 9.2 | 53 | 54 |
| 5 | F | 29 | Syncope not caused by arrhythmia | 17 | 30 | Negative | 9.0 | 51 | 58 |
| 6 | M | 44 | Syncope not caused by arrhythmia | 18 | 45 | Negative | 11.8 | 61 | 62 |
| 7 | M | 40 | Myocardial infarction (STEMI) | 34 | 43 | Negative | 11.0 | 56 | 61 |
FUP, follow-up.
Discussion
The main findings of the present study are (i) there is an evident structural difference between patients with BrS and healthy controls, involving the RVOT, the right ventricle, and its function. (ii) Patients with BrS and a proven mutation in the sodium channel gene SCN5A showed significantly larger RV volumes as well as lower RVEF and lower LVCO than BrS patients without SCN5A mutation and healthy controls. Additionally, the RVOT area was significantly larger in SCN5A mutation-positive patients compared with healthy controls. The RVOT area was comparable between BrS patients with and without an SCN5A mutation. (iii) BrS patients positive for an SCN5A mutation revealed significantly more often a spontaneous diagnostic type 1-ECG when compared with patients without a mutation. (iv) The presence of spontaneous type 1-ECG, reduced RVEF, and increased RVEDVi was independently associated with history of syncope or SCA at the time of diagnosis. Other clinical and CMR parameters were not associated with clinical events. Especially, the presence of SCN5A mutation was not associated clinical events, neither at the time of the diagnosis nor during FUP.
Brugada syndrome has been considered as a primary electrical disease. However, recent reports suggest the presence of functional and morphological alterations in both left and right ventricle and specifically in the RVOT.6 Similar to previous results from our group7 and other investigators,8,9 the present study showed significant differences in several measurements of the RV and LV parameters between patients with BrS and healthy controls as obtained by CMR. Brugada syndrome patients had significantly larger RVOT areas and significantly lower RVEF as well as indexed ES volumes and stroke volumes when compared with healthy controls, suggesting a measurable structural derangement as well as deterioration of the RV function. There was a trend towards lower LVEF in BrS patients when compared with healthy controls, which did not reach statistical significance (P = 0.07). However, all differences except for the RVOT area measurements were within normal limits, pointing to subclinical alterations of the myocardium in patients affected by BrS. The potential overlap between BrS and ARVC has been subject of heated debate; clinical features of BrS and ARVC coincide frequently in patients. Histological findings consistent with ARVC have been demonstrated at autopsy series of patients with the Brugada ECG. Remarkably, in the largest series presented by Corrado et al.,10 12 of 13 young sudden cardiac death (SCD) victims had a Brugada ECG pattern on their last recorded ECG, along with structural heart disease consistent with ARVC at autopsy. Moreover, similar to BrS patients, most of these patients died at night or at rest.11 However, so far no correlations between SCN5A mutations and ARVC could be proved. Furthermore, in our cohort, we ruled out ARVC according to established task force criteria.12
Using a transgenic mouse model, Martin et al.13 examined electrophysiologic properties in mice with heterozygotic SCN5A mutation. When compared with wild type, SCN5A+/− mice had increased heterogeneities in action potential duration, effective refractory periods, electrogram duration, and higher repolarization gradients, predominantly located in the RVOT.13 These spatial heterogeneities act as substrate and may lead to re-entrant ventricular arrhythmias. Currently, three pathophysiological mechanisms are under discussion: the ‘depolarization’ hypothesis, the ‘repolarization’ hypothesis, and ‘congenital’ hypothesis.14 While the discussion is still not settled, pioneer work by Nademanee et al.15 in Brugada patients undergoing ablation has identified the RVOT as substrate for induction and maintenance of ventricular tachyarrhythmias. It remains, however, unclear why depolarization and repolarization abnormalities seen in BrS are localized to the RVOT. Further experimental studies suggested a lower expression of Na+ channels in the RVOT when compared with LV myocardium, which exacerbates the effect of Na+ channel loss of function in BrS, at least in the 30% of patients who reveal a Na+ channel mutation.16 Veeraraghavan and Poelzing17 demonstrated a lower NaV1.5 density in RV when compared with LV. They concluded that the LV might have an increased depolarization reserve compared with the RV and that the heterogeneity in NaV1.5 expression may become a significant determinant of conduction heterogeneities.17
In the subgroup analysis, BrS patients with a proven mutation in the SCN5A gene had significantly larger RV dimensions (ES and ED) and lower RV ejection than BrS patients without SCN5A mutation. Interestingly, RVOT area measurements were comparable between the two patients groups. These results are supported by similar findings, reported from van Hoorn et al.8 and underline the aspect that the RVOT enlargement is common in BrS patients, irrespective of their genotype. Additionally, our findings showed that patients positive for an SCN5A mutation had significantly lower RVEF and RVCOi and increased RVEDVi and RVESVi than healthy controls. However, between mutation-negative patients and controls, there were only significant differences in the measurements for RVEF and RVESVi. Based on these findings, one could assume that the RV impairment is more severe in BrS patients with a proven SCN5A mutation.
Regarding LV CMR parameters, we could find a trend to higher LVED diameter and lower LVEF in BrS patients positive for an SCN5A mutation compared with healthy controls. This difference was not present between SCN5A-negative patients and controls. Additionally, patients with an SCN5A mutation had lower LVCO compared with mutation-negative patients and controls. Thus, we hypothesize that the presence of an SCN5A mutation might also have an impact on the left ventricle, as discussed by previous work of our team and other investigators as well.7,8 However, larger cohorts of SCN5A mutation-positive BrS patients are needed to further investigate this finding.
In the present CMR study, the ROC analysis showed that RVEDVi and RVESVi cut-off values of 75.9 mL/m2 and 33.5 mL/m2, respectively, had acceptable discriminative power to distinguish patients with an SCN5A from patients without an SCN5A mutation (sensitivity of 87.5 and 87.6% and specificity of 68.9 and 60.7%, respectively).
Brugada syndrome is a genetically heterogeneous condition. Nevertheless, SCN5A remains the main gene linked to BrS, found in up to 30% of clinically affected patients. Le Scouarnec et al.18 reported that among the arrhythmia-susceptibility genes only SCN5A accounts for a significant proportion of cases with BrS, with rare coding variants altering this gene in ∼20% of cases vs. <3% of individuals from a reference population. Regarding the clinical presentation at the time of diagnosis, our results showed that BrS patients positive for an SCN5A mutation presented more often with a spontaneous type 1-ECG than patients without a mutation (69 vs. 40%). This suggests that a loss of function of the sodium voltage channel NaV1.5 is resulting in decreased inward sodium current during early action potential phase, which induces typical phenotypic changes in precordial ECG leads.
Finally, we analysed which parameters were associated with syncope or SCA at the time of diagnosis. Spontaneous type 1-ECG, lower RVEF, and larger RVEDVi were independently associated with history of syncope or SCA at the time of diagnosis. Other parameters, such as SCN5A mutation, RVOT, and indexed RVESV, were not associated with clinical events. This corresponds to findings of Nishii et al.,19 who reported that SCN5A mutations were not associated with initial VF episodes. Also in other studies, the presence of an SCN5A mutation was not predictive of arrhythmic events.9,20 Our findings are limited by the fact that the overall occurrence rate of arrhythmic events during FUP was low. Therefore, a predictive clinical implication of the observed alterations involving the right ventricle and its function cannot be assessed. Inconclusive consensus exists on predictors that identify asymptomatic patients at risk of SCA. Genetic screening of patients with hereditary arrhythmogenic diseases and their relatives is important, but the grade of the clinical information obtained by genetic testing strongly varies among different hereditary diseases such as long-QT syndrome and BrS. One of the explanations for the low diagnostic yield of genetic testing in BrS patients is attributed to a low penetrance of this mutation in diagnosed patients. Determination of whether environmental modifiers, genetic modifiers, or posttranslational effects account for the different clinical manifestations, seen in family members, remains a challenge for clinicians. Therefore, a careful interpretation of the genetic screening results and individualized therapeutic approach is mandatory in all BrS patients. Our study shows subtle, yet significant changes in the RV morphology and RV function among patients with a proven SCN5A mutation. Albeit still in normal ranges, there is a trend towards RV dysfunction, expressed by decreased RVEF, and larger RV volumes in BrS patients diagnosed with an SCN5A mutation. Additionally, SCN5A mutation also seems to affect the left ventricle. However, at the time of diagnosis, besides enlarged RVOT areas irrespective of the genotype, there were no pathological dimensions or functional abnormalities in both ventricles. Serial imaging of affected patients is needed to obtain information if there is a morphological progression of the disease.
Limitations
The small sample size did not allow statistical evaluation for patients with a CACNA mutation. In the small number of affected patients, there were no significant differences in the CMR parameters between BrS patients with and without a CACNA mutation. A subgroup analysis between different mutation types (truncating vs. missense) and clinical outcome was not possible, due to a low sample size. Similarly, the overall rate of arrhythmic events during FUP was too low to allow assessment of risk factors obtained with CMR.
Probands included in our study were not prospectively tested for a mutation in the SCN5A gene. Therefore, it is theoretically possible that bias could occur in case that controls also had a genetic abnormality in the SCN5A gene. This is, based on the absence of any medical history of included probands, very unlikely. Furthermore, controls have not undergone any pharmacological provocation test to unveil a BrS-ECG pattern. Therefore, it is possible that the control sets are not devoid of such cases. All controls, however, received ECGs, also recorded at higher intercostal space, which did not show any suspicious patterns warranting further evaluation.
Conclusion
Brugada syndrome patients with an SCN5A mutation reveal distinct changes in RV volumes and function when compared with those without an SCN5A mutation and healthy controls. Furthermore, SCN5A mutation-positive patients have a higher likelihood of a spontaneous type 1 BrS-ECG, which is associated with a higher incidence of clinical events. Cardiovascular magnetic resonance may provide additional insight to distinguish between SCN5A mutation-positive and SCN5A- mutation-negative BrS patients.
Funding
This study was in part funded by a grant from the DZHK (German Centre for Cardiovascular Research).
Conflict of interest: none declared.
