


Abstract
Patients with atrial fibrillation (AF) are encountered and treated in different healthcare settings, which may affect the quality of care. We investigated the use of oral anticoagulant (OAC) therapy and the risk of thrombo-embolism (TE) and bleeding, according to the healthcare setting.
Using national Danish registers, we categorized non-valvular AF patients (2002–11) according to the setting of their first-time AF contact: hospitalization (inpatients), ambulatory (outpatients), or emergency department (ED). Event rates and hazard ratios (HRs), calculated using Cox regression analysis, were estimated for outcomes of TE and bleeding. We included 116 051 non-valvular AF patients [mean age 71.9 years (standard deviation 14.1), 51.3% males], of whom 55.2% were inpatients, 41.9% outpatients, and 2.9% ED patients. OAC therapy 180 days after AF diagnosis among patients with a CHADS2 ≥ 2 was 42.1, 63.0, and 32.4%, respectively. Initiation of OAC therapy was only modestly influenced by CHADS2 and HAS-BLED scores, regardless of the healthcare setting. The rate of TE was 4.30 [95% confidence interval (CI) 4.21–4.40] per 100 person-years for inpatients, 2.28 (95% CI 2.22–2.36) for outpatients, and 2.30 (95% CI 2.05–2.59) for ED patients. The adjusted HR of TE, with inpatients as reference, was 0.74 (95% CI 0.71–0.77) for outpatients and 0.89 (95% CI 0.79–1.01) for ED patients.
In a nationwide cohort of non-valvular AF patients, outpatients were much more likely to receive OAC therapy and had a significantly lower risk of stroke/TE compared with inpatients and ED patients. However, across all settings investigated, OAC therapy was far from optimal.
Atrial fibrillation (AF) patients with a high risk of thrombo-embolic (TE) events (CHADS2 ≥ 2), first treated in an outpatient clinic (outpatients), are much more likely to be treated with oral anticoagulation (OAC) therapy, compared with those first treated during a hospitalization (inpatients) or in an emergency department (ED patients) (63.0, 42.1, and 32.4%, respectively).
Furthermore, outpatients have a lower risk of TE, including stroke, compared with inpatients (adjusted hazard ratio 0.74, 95% confidence interval 0.71–0.77).
In the settings investigated, the most frequent use of OAC therapy is provided by outpatient clinics. However, across all healthcare settings investigated, the use of OAC therapy is far from optimal.
Introduction
Patients with atrial fibrillation (AF) have a markedly increased risk of thrombo-embolism (TE), including stroke. This increased risk is not homogeneous but depends on certain risk factors described in risk stratification scores such as the CHADS2 score introduced in 2001 and the CHA2DS2-VASc score introduced in 2010.1,2 Oral anticoagulant (OAC) therapy can effectively reduce the risk of TE; however, careful risk stratification is essential as bleeding can be a serious complication.3
Non-valvular AF patients are encountered and treated in various parts of the healthcare system, such as during hospitalizations, in outpatient clinics, and in emergency departments (EDs), but little is known about the quality of care across different settings. General practitioners (GPs) also treat and manage AF patients, and this setting has previously been investigated and OAC therapy was, in general, found to be quite well performed but with the possibility to be improved further.4 To our knowledge, no guidelines exist on where AF patients should be followed up, nor are there any general policies stating which patients should be seen by a cardiologist.
Previous studies have shown that an inadequate proportion of non-valvular AF patients is treated with OAC therapy; however, studies have mainly focused on hospitalized patients, and results may not be therefore generalizable to all AF patients.5,6 Guideline-based AF clinics have been proposed and have been shown to be superior to standard AF treatment with regard to cardiovascular hospitalizations and cardiovascular mortality in a randomized controlled trial.7
We examined patient characteristics and assessed choices of pharmacotherapy and the risk of TE and bleeding in a nationwide cohort according to healthcare setting. As outpatient clinics, in general, have the possibility to follow patients over time, we believed that outpatients were more closely monitored and therefore had a higher probability of being initiated in OAC therapy, compared with patients treated during a hospitalization or in an ED. We therefore hypothesized that patients in the outpatient clinics would have a lower risk of TE, with only a minimal increase in risk of bleeding.
Methods
Registries
In Denmark, all residents are given a unique and permanent civil registration number that enables individual-level linkage between administrative registers. This study was based on the following four nationwide registers: (i) the National Patient Registry, containing hospital diagnoses since 1978 coded using International Classification of Diseases (ICD) 8th and 10th revisions and surgical classification codes since 1996 coded using the Nordic Medico-Statistical Committee Classification of Surgical Procedures (NCSP); (ii) the Danish Registry of Medicinal Product Statistics, containing information on prescriptions dispensed from Danish pharmacies since 1995, classified using the Anatomical Therapeutically Chemical (ATC) system; (iii) the Danish Register of Causes of Death, which holds information on primary and contributing causes of death; and (iv) the Civil Registration System, which contains information on date of birth and death. All ICD-8, ICD-10, NCSP, and ATC codes used in this study can be found in Supplementary material online, Table S1.
Study population
We identified all Danish residents 18 years or older with a first-time non-valvular primary or secondary AF diagnosis between 1 January 2002 and 31 December 2011 (Figure 1). First-time non-valvular AF was defined as a patient's first appearance with a non-valvular AF diagnosis in the National Patient Registry. We then classified these patients according to the setting of their first-time diagnosis: (i) inpatients admitted with AF; (ii) outpatients managed in an outpatient clinic/ambulatory; and (iii) AF patients seen in an ED. Outpatients and ED patients were included on the day of their first ambulatory/ED contact, and inpatients were included on the day of discharge. Patients directly hospitalized after their ED diagnosis were considered inpatients.
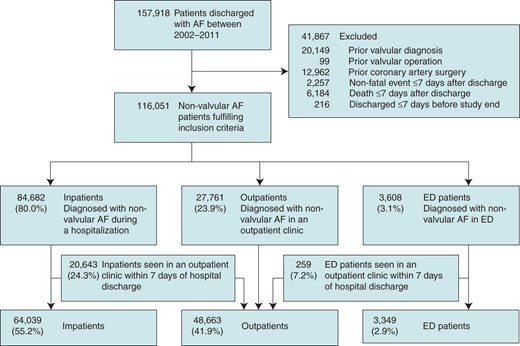
Selection of our study population. Patients were stratified according to the healthcare setting first diagnosing AF. ED patients admitted directly to a hospital were considered inpatients. Inpatients and ED patients seen in an outpatient clinic within 7 days of inclusion were considered outpatients. AF, atrial fibrillation; ED, emergency department.
We excluded patients with a prior valvular diagnosis, coronary artery surgery, or if they experienced an event (TE or bleeding) or died during a 7-day quarantine period after inclusion. Follow-up was commenced after this 7-day period, to minimize unmeasured confounders during hospitalization (e.g. drug treatment may be changed and intensified during hospital admission) and to allow patients to collect prescription medicines following discharge. Inpatients and ED patients could change to the outpatient group in the 7 days following the index date if they were seen in an outpatient clinic.
Organization of the Danish healthcare system
The first setting a patient is typically seen by a doctor in Denmark will often be at their GP, who acts as a ‘gatekeeper’ to the rest of the healthcare system, examining and treating some diseases and referring others to specialist treatment (e.g. hospital outpatient clinics and hospital admission). With a referral from a doctor, the patient can freely choose between different hospitals, but normally cannot choose the level of specialization. General rules for GPs regarding referral of patients with first-time AF do not exist, but some GP recommendations state that the patient should be seen by a specialist for a cardiac evaluation and in the case of symptomatic AF, hospital admission may be required.
OAC and other pharmacotherapies
Warfarin (ATC: B01AA03) and phenprocoumon (B01AA04) were the only OACs available during the period, until the non-vitamin K OAC (NOAC) dabigatran etexilat was approved in Denmark in August 2011. As NOAC treatment was only just being introduced towards the end of the study period, we did not examine it further. Warfarin was, by far, the drug predominantly used during the study period (Table 1) and was therefore the focus of our analyses. All concomitant pharmacotherapies were determined on the basis of prescriptions claimed between 180 days prior to inclusion and until 7 days after, where follow-up commenced. Prior medication was defined as medication claimed up to 180 days before inclusion.
Baseline characteristics of patients stratified according to the healthcare setting first diagnosing AF
| Inpatients (n = 64 039) | Outpatients (n = 48 663) | ED patients (n = 3349) | |
|---|---|---|---|
| Males (%) | 30 679 (47.9) | 27 140 (55.8) | 1669 (49.8) |
| Age, mean (SD) | 74.5 (13.9) | 68.8 (13.4) | 66.9 (16.6) |
| Age males, mean | 70.9 (14.4) | 66.9 (12.9) | 63.6 (16.8) |
| Age females, mean | 77.9 (12.5) | 71.3 (13.5) | 70.2 (15.8) |
| CHADS2 score | |||
| Mean (SD) | 1.7 (1.3) | 1.3 (1.2) | 1.0 (1.1) |
| 0 (%) | 13 247 (20.7) | 15 489 (31.8) | 1439 (43.0) |
| 1 (%) | 18 281 (28.6) | 14 564 (29.9) | 1017 (30.4) |
| ≥2 (%) | 32 511 (50.8) | 18 610 (38.2) | 893 (26.7) |
| CHA2DS2-VASc | |||
| Mean (SD) | 3.1 (1.8) | 2.5 (1.7) | 2.2 (1.7) |
| 0 (%) | 5288 (8.3) | 6102 (12.5) | 622 (18.6) |
| 1 (%) | 7400 (11.6) | 9490 (19.5) | 737 (22.0) |
| >2 (%) | 51 351 (80.2) | 33 071 (68.0) | 1990 (59.4) |
| HAS-BLED score | |||
| Mean (SD) | 1.6 (1.1) | 1.6 (1.0) | 1.4 (1.0) |
| 0–1 (%) | 31 392 (49,0) | 24 814 (51.0) | 2002 |
| 2 (%) | 20 129 (31.4) | 15 482 (31.8) | 886 (26.5) |
| ≥3 (%) | 12 518 (19.6) | 8367 (17.2) | 461 (13.8) |
| Comorbidity (%) | |||
| Previous stroke/thrombo-embolism | 12 251 (19.1) | 5958 (12.2) | 324 (9.7) |
| Previous bleeding | 10 206 (15.9) | 5302 (10.9) | 368 (11.0) |
| Vascular disease | 8926 (13.9) | 4335 (8.9) | 300 (9.0) |
| Myocardial infarction | 6036 (9.4) | 2835 (5.8) | 229 (6.8) |
| Hypertension | 28 150 (44.0) | 21 626 (44.4) | 970 (29.0) |
| Heart failure | 12 863 (20.1) | 7413 (15.2) | 301 (9.0) |
| Chronic kidney disease | 3239 (5.1) | 1492 (3.1) | 80 (2.4) |
| Diabetes mellitus | 6807 (10.6) | 4546 (9.3) | 222 (6.6) |
| Concomitant medicationa (%) | |||
| Warfarin | 18 693 (29.2) | 21 328 (43.8) | 463 (13.8) |
| Warfarin or phenprocoumon | 18 919 (29.5) | 21 459 (44.1) | 466 (13.9) |
| Aspirin | 29 040 (45.4) | 18 951 (38.9) | 1028 (30.7) |
| Clopidogrel | 1832 (2.9) | 1070 (2.2) | 56 (1.7) |
| Digoxin | 21 796 (34.0) | 13 386 (27.5) | 354 (10.6) |
| Beta-blocker | 30 636 (47.8) | 24 889 (51.2) | 1203 (35.9) |
| Calcium channel blocker | 15 921 (24.9) | 12 343 (25.4) | 578 (17.3) |
| Other anti-arrhythmic drugs | 2820 (4.4) | 2432 (5.0) | 60 (1.8) |
| Statin | 12 000 (18.7) | 10 681 (22.0) | 491 (14.7) |
| RAS inhibitor | 22 188 (34.7) | 17 649 (36.3) | 775 (23.1) |
| Loop diuretic | 21 890 (34.2) | 11 487 (23.6) | 424 (12.7) |
| Steroid | 7513 (11.7) | 3621 (7.4) | 233 (7.0) |
| Protein pump inhibitors | 13 939 (21.8) | 7373 (15.2) | 457 (13.7) |
| NSAID | 14 279 (22.3) | 10 331 (21.2) | 648 (19.4) |
| Pre-medicationb (%) | |||
| Warfarin | 6727 (10.5) | 8611 (17.7) | 179 (5.3) |
| Aspirin | 20 883 (32.6) | 14 996 (30.8) | 755 (22.5) |
AF, atrial fibrillation; CHADS2, see text; aspirin, acetylsalicylic acid; NSAID, non-steroidal anti-inflammatory drug; SD, standard deviation; RAS, renin–angiotensin system. Other anti-arrhythmic drugs include sotalol, amiodarone, and class 1c drugs. P-value for all baseline characteristics was less than 0.001.
aConcomitant medication was defined as medication claimed from 180 days before first AF contact until 7 days after inclusion.
bPre-medication was defined as medication claimed from 180 days before first AF contact until the day before.
Comorbidities
Vascular disease was defined as hospitalization due to myocardial infarction (MI), peripheral artery disease, or aortic plaque. Hypertension was considered to be present, when two or more antihypertensive drugs were used at baseline, as validated previously.8 Heart failure was defined as any admission for heart failure plus treatment with a loop diuretic. Diabetes mellitus was defined as claiming a prescription with glucose-lowering medication. Valvular surgery and coronary artery surgery were identified using NCSP definitions. All other comorbidities were defined using discharge diagnoses. Definitions can be seen in the Supplementary material online, Table S1 and have been used in previous publications.9,10
Using known comorbidities and treatments, we calculated the CHADS2 (0–6), the CHA2DS2-VASc (0–9), and the HAS-BLED [Hypertension, Abnormal renal/liver function, Stroke, Bleeding history or predisposition, Labile international normalized ratio (INR), Elderly, Drugs/alcohol concomitantly] scores for each patient. For the HAS-BLED score, the labile INR component of the score was not included, as this information was not available (revised score 0–8). The scores have been shown to accurately predict TE and bleeding risk.8,11
Outcome
TE was defined as hospitalization or death from ischaemic stroke, transient ischaemic attack, or systemic arterial embolism. Bleeding included hospitalization or death from intracranial bleeding, urinary tract bleeding, bleeding in the gastrointestinal system or airways, or anaemia caused by bleeding, as performed previously.9,10 Bleeding diagnoses used have shown a positive predictive value of 89–99% in hospital databases.12 Patients were followed until death or end of the study period (31 December 2011), and we defined both a 1-year and a 10-year follow-up in the main analyses.
Statistical analysis
Continuous variables were presented as mean with standard deviation (SD) and categorical variables were presented as number with percentage. The typical time to event was displayed as a median and interquartile range. Risk stratification scores were presented as continuous variables and some also as categorical variables.
The proportion of patients in each group with a CHADS2 score ≥2 claiming a warfarin prescription during follow-up was determined (Figure 2). Furthermore, we assessed OAC and aspirin therapy 180 days after inclusion, stratified according to predicted TE (CHADS2) and bleeding risks (HAS-BLED) (Figure 3). We chose 180 days to assess the patients’ initial treatment after their first AF hospital contact and to be sure patients had time to claim a prescription at a pharmacy after hospital discharge. Only patients alive after 180 days were included in these analyses to ensure that non-users were not falsely overestimated.
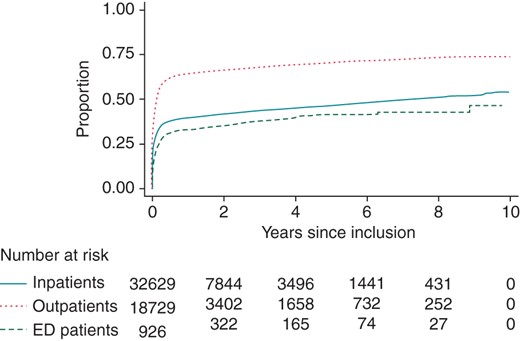
Proportion of patients with a CHADS2 score ≥2 claiming a warfarin prescription during follow-up. Patients with a CHADS2 score <2 were not included in this analysis. ED, emergency department. For CHADS2, see text.
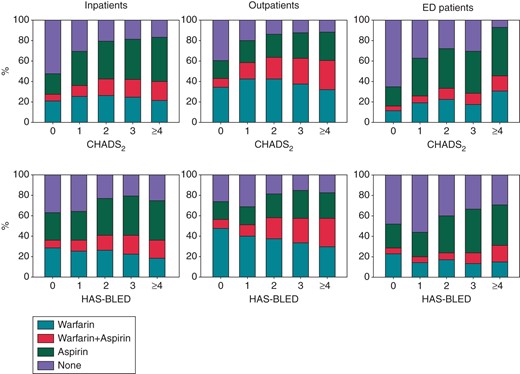
Warfarin and aspirin treatment according to the CHADS2 and HAS-BLED scores. The proportion of warfarin and aspirin prescriptions claimed in the 180 days following inclusion in our study was stratified according to the CHADS2 and HAS-BLED scores. Patients who died in this time period were not included in this analysis. ED, emergency department. For CHADS2 and HAS-BLED, see text.
P-values were calculated using Pearson's χ2 test. Event rates were calculated per 100 person-years. To compare the risk of TE and bleeding across patient groups, we calculated hazard ratios (HRs) using the Cox proportional hazards models adjusted for age, gender, year of inclusion, and either CHA2DS2-VASc or HAS-BLED score for the TE and bleeding outcome, respectively.
For sensitivity, we created four analyses: (i) we calculated the rate of events and risk of TE and bleeding for inpatients and ED patients who were and were not seen in an outpatient clinic during follow-up, in a time-dependent analysis; (ii) a figure was constructed to illustrate the proportion seen in an outpatient clinic during follow-up; (iii) to investigate the effect of OAC treatment, we created an analysis in which we stratified patients in ‘warfarin non-users’ and ‘warfarin users’ and calculated event rates and risk of TE and bleeding in a time-dependent analysis; and (iv) we assessed the rate of events and risk of TE and bleeding for patients in the three groups after they were stratified according to the risk score.
We tested for clinically relevant interactions, validity of the proportional hazard assumption, and linearity of continuous variables. There were no violations of assumptions. A two-sided P-value of less than 0.05 was considered statistical significant. Data management and statistical analyses were performed using SAS version 9.2 (SAS Institute, Cary, NC, USA) and Stata version 11.0 (StataCorp, College Station, TX, USA).
Ethics
The study complies with the Declaration of Helsinki and was approved by the Danish Data Protection Agency (ref.: 2007-58-0015, int. ref.: GEH-2010-001). The civil registration number of each patient was encrypted; therefore individuals could not be identified. Retrospective register-based studies do not require ethical approval in Denmark.
Results
Population
We included 116 051 non-valvular AF patients with a mean age of 71.9 years (SD 14.1) and 51.3% were male. The mean CHADS2 score was 1.5 (SD 1.3) and the mean CHA2DS2-VASc score was 2.8 (1.8). Population selection and baseline characteristics are shown in Figure 1 and Table 1, respectively. We categorized a total of 64 039 (55.2%) as inpatients, 48 663 (41.9%) as outpatients, and 3349 (2.9%) as ED patients. Inpatients were approximately 6–7 years older, and their mean CHADS2, CHA2DS2-VASc, and HAS-BLED scores were higher, compared with those in outpatients and ED patients (P < 0.001).
Warfarin treatment
The proportion of patients claiming a warfarin prescription up to 180 days prior to their first non-valvular AF diagnosis was 10.5% among inpatients, compared with 17.7 and 5.3% among outpatients and ED patients, respectively (P < 0.001). This proportion increased to 37.2, 55.0, and 23.0%, respectively (P < 0.001), 180 days after inclusion. When only considering patients with a CHADS2 ≥ 2, the corresponding proportions were 42.1, 63.0, and 32.4% (P < 0.001) (Figure 2).
As seen in Figure 3, the proportion claiming warfarin [monotherapy or dual therapy (warfarin and aspirin)] within 180 days of inclusion, stratified according to the CHADS2 score 0, 1, 2, 3, and ≥4, was 27.8, 36.4, 42.8, 42.1, and 40.2% for inpatients and 43.3, 57.9, 63.8, 62.4, and 60.4% for outpatients, respectively. The proportion claiming aspirin generally increased with higher CHADS2 scores in all groups. The proportion claiming warfarin was generally stable across HAS-BLED scores, whereas aspirin usage tended to increase.
Risk of TE and bleeding
During the entire follow-up period, 12.3% of the inpatients experienced a TE event compared with 8.3 and 8.5% of the outpatients and ED patients, respectively. Furthermore, 10.1% of the inpatients experienced a bleeding event compared with 8.7% of the outpatients and 7.9% of the ED patients.
The rates of both TE and bleeding were lower for outpatients, compared with those for inpatients at both the 1-year and 10-year follow-up (Table 2). The adjusted HR of TE was 0.60 [95% confidence interval (CI): 0.56–0.64], whereas the HR of bleeding was 0.76 (95% CI 0.71–0.81) within the first year of follow-up. Compared with inpatients, ED patients were not associated with a significantly different risk of either outcome.
Event rate and risk of TE and bleeding of patients stratified according to the healthcare setting first diagnosing AF
| 1-year follow-up (maximum) | 10-year follow-up (maximum) | |||||||||||
|---|---|---|---|---|---|---|---|---|---|---|---|---|
| Events (% fatal) | Person-years | Event rate (CI) | Mean follow-up time (years) | Median time to event, years (IQR) | Hazard ratio (CI) | Events (% fatal) | Person- years | Event rate (CI) | Mean follow-up time (years) | Median time to event, years (IQR) | Hazard ratio (CI) | |
| TE | ||||||||||||
| Inpatients | 3497 (58.0) | 49 643 | 7.04 (6.81–7.28) | 0.78 | 0.23 (0.46) | 1 | 7890 (53.4) | 183 476 | 4.30 (4.21–4.40) | 2.87 | 1.27 (2.77) | 1 |
| Outpatients | 1265 (30.8) | 42 259 | 2.98 (2.82–3.15) | 0.87 | 0.35 (0.50) | 0.60 (0.56–0.64) | 4027 (33.3) | 176 261 | 2.28 (2.22–2.36) | 3.62 | 1.94 (3.26) | 0.74 (0.71–0.77) |
| ED patients | 107 (40.2) | 2850 | 3.75 (3.11–4.54) | 0.85 | 0.28 (0.46) | 0.88 (0.72–1.07) | 284 (39.4) | 12 336 | 2.30 (2.05–2.59) | 3.68 | 1.67 (3.07) | 0.89 (0.79–1.01) |
| Bleeding | ||||||||||||
| Inpatients | 2596 (22.7) | 49 625 | 5.23 (5.03–5.44) | 0.77 | 0.27 (0.48) | 1 | 6447 (19.9) | 183 110 | 3.52 (3.44–3.61) | 2.86 | 1.48 (2.87) | 1 |
| Outpatients | 1297 (15.2) | 42 448 | 3.06 (2.89–3.22) | 0.87 | 0.39 (0.49) | 0.76 (0.71–0.81) | 4255 (16.5) | 175 756 | 2.42 (2.35–2.50) | 3.61 | 2.06 (3.32) | 0.87 (0.84–0.91) |
| ED patients | 88 (22.7) | 2856 | 3.08 (2.50–3.80) | 0.88 | 0.36 (0.53) | 0.84 (0.68–1.04) | 264 (16.3) | 12 341 | 2.14 (1.90–2.41) | 3.68 | 1.87 (3.33) | 0.89 (0.79–1.01) |
Event rates are unadjusted and displayed per 100 person-years. HRs calculated using Cox regression analysis adjusted for sex, age, and year of inclusion. TE and bleeding outcomes were adjusted for CHA2DS2-VASc and HAS-BLED scores, respectively. Inpatients were used as reference. AF, atrial fibrillation; CI, confidence interval; IQR, interquartile range; TE, thrombo-embolism; ED, emergency department.
Sensitivity analysis
Inpatients seen in an outpatient clinic during follow-up had lower rates of TE, compared with those who were not (Supplementary material online, Table S2), and a larger proportion of inpatients was seen in an outpatient clinic during follow-up, compared with ED patients (Supplementary material online, Figure S1). Outpatient and ED patient warfarin non-users had a lower risk of TE and bleeding, compared with inpatient warfarin non-users. Furthermore, outpatient warfarin users had a lower risk of TE and bleeding, compared with inpatient warfarin users (Supplementary material online, Table S3). With increasing CHADS2 score, the risk of TE increased among all patient groups (Supplementary material online, Table S4).
Discussion
In this study of ‘real-life’ non-valvular AF patients, outpatients had fewer TE risk factors than inpatients (i.e. lower CHADS2 score), but were treated much more frequently with OAC therapy. Outpatients had a significantly lower risk of TE and bleeding, compared with inpatients. However, regardless of the healthcare setting (inpatients, outpatients, or ED patients), there was a low level of accordance between OAC treatment and CHADS2 score as well as predicted bleeding risk (HAS-BLED score).
In a Danish cross-sectional survey from 2013, Brandes et al.4 investigated the risk profile and guideline adherence of 60 different GPs treating 1743 AF patients enrolled in 2011. These patients were not necessarily newly diagnosed AF patients as in our study. The mean age was 74.8 (SD 11.2) years, the mean CHADS2 score was 1.9 (SD 1.3), the mean CHA2DS2-VASc score was 3.5 (SD 1.8), and 66.3% of the patients were treated with OAC therapy and 18.7% with antiplatelet drugs. The study found that when using the CHADS2 score, 75.7% were treated according to the guidelines, 16.0% were undertreated, and 8.4% were overtreated. When using the CHA2DS2-VASc score, the corresponding proportions were 75.4, 22.7, and 1.8%. The study states that OAC therapy in primary care in Denmark is quite well performed.
In our study, we found a higher degree of overtreatment compared with the Brandes study; 27.8% of the inpatients and 43.3% of the outpatients claimed warfarin or dual therapy (warfarin and aspirin) prescription(s), with a CHADS2 score of 0 (Figure 3). The reason for this could be a higher degree of overtreatment in our population, but it is also likely that risk factors in our study were underestimated, as they may not be included in the register, e.g. patients with a low degree of hypertension.
We also found a high frequency of undertreatment in our study, especially among inpatients and ED patients. When considering patients with a CHADS2 score ≥2, only 42.1% of the inpatients and 32.4% of the ED patients claimed a warfarin prescription within 6 months of AF diagnosis, compared with 63.0% of the outpatients. Even considering that some of the patients who were not treated could have a legitimate reason (e.g. patient compliance issues and perceived bleeding hazard), these numbers reflect a relatively high degree of undertreatment in both inpatient and ED settings and possibly also in the outpatient group.
Undertreatment of AF patients with OAC therapy is well known and has been discussed extensively.13 Guideline non-adherence and undertreatment have been associated with increased risks of stroke and death.14,15 Our study indicates that adherence to AF guidelines on OAC therapy is not satisfactory, although both risk factors for TE and bleeding are well characterized and the beneficial effect of OAC therapy is scientifically well proven and recommended in guidelines.8,16 We hereby confirm previous studies that have reported undertreatment of AF patients according to known risk factors,5,6 and our study adds that varying degrees of both over- and undertreatment are present across healthcare settings.
AF patients treated in an outpatient care setting had a significantly lower risk of TE and bleeding events, compared with inpatients. It seemed that the relatively higher proportion of patients treated with OAC therapy in the outpatient group could be a factor reducing TE events. It is also plausible that outpatients were monitored regularly by the outpatient clinic, and anticoagulation dosage could be adjusted more frequently, which could partly explain the lower risk of both TE events and bleeding. In a sensitivity analysis, we further saw that inpatients seen in an outpatient clinic during follow-up had a lower risk of TE events compared with those who were not (Supplementary material online, Table S2). The relatively low degree of OAC therapy among non-ambulatory AF patients warrants further investigation.
Studies addressing a possible difference in quality of OAC treatment for AF patients in various hospital settings are scarce. A survey-based study among Swiss physicians found that the proportion of guideline-adherent OAC treatment of AF patients was higher among hospital physicians than among physicians in ambulatory care, which is not in accordance to our findings in Denmark.17 A recent randomized clinical trial showed that guideline-based care for AF patients led by nurses (and supervised by cardiologists) was superior to care by a cardiologist in an outpatient clinic, in terms of cardiovascular hospitalizations and cardiovascular mortality. This study called for AF treatment to adopt disease management known from other chronic diseases such as diabetes and heart failure.7 Specialized AF clinics could be an interesting perspective for the future, to achieve a higher degree of guideline-adherent OAC therapy for AF patients.
Implications of findings
There are currently no guidelines advising in which hospital setting a non-valvular AF patient should be treated or whether the patient should be seen by a cardiologist. This observational study finds that AF outpatients more often receive OAC therapy and have a better prognosis when compared with AF inpatients. Our findings suggest that many AF patients could benefit from being treated in an outpatient clinic. However, treatment in an outpatient clinic does not necessarily lead to a high adherence to guidelines, as reported here. Specific recommendations for AF treatment and higher adherence to guidelines for both cardiologists and other physicians are therefore still warranted. Future research should consider outpatient clinics as the best current hospital setting to reduce the risk of TE without increasing the risk of bleeding.
Strengths and limitations
This study was created using data from a nationwide population (Denmark), thereby minimizing risk of selection bias. The diagnoses used have either been validated previously in the registries used, such as AF (verification rate of 99%),18 MI (predictive value of 93.6% and sensitivity of 77.6%),19 stroke (positive predictive value from 74 to 97%),20 and hypertension (positive predictive value of 80.0% and specificity of 94.7%),8 or been used in previous studies, e.g. bleeding and chronic kidney disease.9,10
The main limitations were inherited in the observational design of the study, i.e. we only had the information provided by the registers and lacked more detailed clinical information. We could not exclude the potential effect of unmeasured confounders such as INR, body mass index, smoking status, specific blood pressure, or creatinine level.
In Denmark, aspirin can be bought as an over-the-counter medication, so aspirin treatment was likely underestimated; however, only prescribed medicine is subsidized. Therefore, chronically ill patients will likely claim a prescription rather than buying over-the-counter medication for long-term treatment of their illness.
As in many observational studies, confounding by indication was a potential problem, as we did not have information on the specific prognostic factors or contraindications influencing physician decision on whether a patient should or should not receive OAC therapy. We tried to minimize this by our study design and by adjusting our analysis for a range of known risk factors.
We did not have access to data from GPs, which is another healthcare setting attending to AF patients in Denmark. This was, however, not seen as a major limitation as we believed that most of these patients are referred to a hospital setting at some time point to have a cardiac evaluation and treatment recommendations. Furthermore, this setting was investigated in a recent study.4 Another limitation was that we did not have information on the AF subtype (paroxysmal, persistent, or permanent).
We investigated whether hospitalized inpatients, compared with outpatients, may reflect patients with a more severe disease burden, and we found that outpatients had a lower risk of TE, compared with inpatients, regardless of OAC therapy (Supplementary material online, Table S3). This may explain a part of the decreased risk of TE in the outpatient group compared with the inpatient group found in our main analysis (Table 2). In a similar manner, event rates were consistently lower in the outpatient group when patients were stratified according to the CHADS2 and HAS-BLED scores, although increased HRs were seen with accumulated number of risk factors across all settings (Supplementary material online, Table S4).
We did not have access to the level of training or medical speciality of the treating doctor. How generalizable our findings are to other countries depends on the similarity of the healthcare system and if the management of AF patients is structured in a similar manner.
Conclusion
In a large nationwide cohort of non-valvular AF patients, we found that patients treated in an outpatient clinic were more likely to be treated with OAC therapy and had a significantly lower risk of TE/stroke, compared with patients treated during a hospitalization or in an ED. Increased focus on adequate risk stratification and appropriate use of OAC therapy in AF patients, independent of healthcare setting, are warranted.
Supplementary material
Supplementary material is available at Europace online.
Funding
This work was supported by a research grant from Bristol-Myers Squibb (BMS) and Pfizer. BMS and Pfizer had no influence on the study design, data collection, presentation of data, conclusions drawn, or the decision to submit for publication.
Acknowledgements
A.P.M. made primary contributions to data collection and analysis, interpretation of results, and writing of the manuscript. M.L.H., J.B.O., M.W.H., D.K., S.H., S.P.J., A.B., G.G., C.T.-P., and M.L. contributed to the study conception and design. All authors contributed to interpretation of results; all revised the manuscript critically for important intellectual content; and all approved the final manuscript. A.P.M. is the guarantor.
Conflict of interest: A.P.M. reports speaker fees from Bristol-Myers Squibb (BMS)/Pfizer and Boehringer Ingelheim during the conduct of the study; G.G. reports grants from BMS during the conduct of the study; J.B.O. has received speaker fees from BMS and Boehringer Ingelheim and funding for research from the Lundbeck Foundation, BMS, and The Capital Region of Denmark, Foundation for Health Research; S.H. reports grants from AstraZeneca, BMS, Pfizer, and GSK and personal fees from Bayer, AstraZeneca, Boehringer Ingelheim, and Pfizer, outside the submitted work; S.P.J. reports grants from BMS/Pfizer during the conduct of the study and personal fees from Boehringer Ingelheim, Bayer, and BMS/Pfizer, outside the submitted work; M.L.H. reports grants from BMS/Pfizer during the conduct of the study; and M.W.H., D.K., A.B., and C.T.-P. have nothing to disclose.
References
