


Abstract
To investigate trends in the prescription of oral anticoagulants (OACs) and antiplatelet agents for atrial fibrillation (AF).
Prescription data for 450 518 patients with AF from 3352 General Practices in England, was obtained from the GRASP-AF registry, 2009–2018. Annualized temporal trends for OAC and antiplatelet prescription were reported according to eligibility based on stroke risk (CHADS2 or CHA2DS2-VASc scores ≥1 or >2, respectively). From 2009 to 2018, the prevalence of AF increased from 1.6% [95% confidence interval (CI) 1.5–1.7%] to 2.4% (2.3–2.5%), and for those with AF the proportion prescribed OAC increased from 47.6% to 75.0% (P-trend < 0.001; relative risk 1.57, 95% CI 1.55–1.60) and for antiplatelet decreased from 37.4% to 9.2% (P-trend < 0.001). In early-years (2009–2013), eligible patients aged ≥80 years were less likely to be prescribed OAC than patients aged <80 years [odds ratio (OR) 0.55, 95% CI 0.51–0.59 for CHADS2≥1 in 2009] (all P-trends < 0.001). This ‘OAC prescription gap’ reduced over the study period (OR 0.93, 0.90–0.96 in 2018). Whilst the prescription of direct oral anticoagulant (DOAC) as a proportion of all OAC increased from 0.1% (95% CI 0.0–0.2%) in 2011 to 58.8% (58.4–59.2%) in 2018, it was inversely associated with patient age (P-trend < 0.001) and their risk of stroke.
Between 2009 and 2018, in England, the use of OAC for stroke prophylaxis in AF increased, with DOAC accounting for over half of OAC uptake in 2018. Despite a reduction in the OAC-prescription gap, a new paradox exists relating to DOAC prescription for the elderly and those at higher risk of stroke.
This contemporary population-wide 10-year study provides good evidence for system-wide improvements in the use of oral anticoagulants (OAC) for stroke prophylaxis in atrial fibrillation (AF).
Between 2009 and 2018, in England, the use of OAC for stroke prophylaxis in AF increased, with direct oral anticoagulant (DOAC) accounting for over half of OAC uptake in 2018.
Despite a reduction in the OAC-prescription gap, a new paradox exists relating to DOAC prescription for the elderly and those at higher risk of stroke.
Introduction
Approximately one-third of ischaemic strokes are associated with atrial fibrillation (AF).1 Such strokes are of importance because they are largely preventable with oral anticoagulation (OAC).2 To that end, recent international guidelines for clinical practice have lowered the threshold for the use of OAC in stroke prophylaxis among patients with AF, and have emphasized their use in preference to antiplatelet drugs (AP).3,4
With the advent of direct oral anticoagulants (DOACs), which when compared with warfarin reduce the frequency of cerebral haemorrhage and intracranial bleeding, there has been a progressive increase in the use of OAC for stroke prophylaxis in AF.5–7 Our earlier research reported the temporal decline in hospitalized AF-related stroke in England (that occurred in the face of an increasing prevalence of AF), and postulated that this may be due to the uptake of OAC.7 We have also noted a system-wide risk-treatment paradox, whereby older patients with AF less frequently were prescribed OAC (and more frequently offered APs).8 This is resonated in the international literature,9,10 and of concern given the increasing prevalence of AF associated with an ageing population.3,11
In the UK, evidence for the underutilization of OAC has led to national quality improvement initiatives to improve their uptake.8,12 The Guidance on Risk Assessment and Stroke Prevention in Atrial Fibrillation (GRASP-AF) was implemented as a national service improvement tool and accompanying registry in 2009 to improve OAC uptake, and in 2012 changes to the national Quality and Outcomes Framework (QOF)13 incentivized General Practitioners to use OAC in preference to APs. In addition, the National Institute for Health and Care Excellence (NICE) has emphasized the importance of patient choice with respect to type of OAC for stroke prophylaxis in AF in patients with a CHA2DS2-VASc score ≥2.14 Given this and the paucity of population-based information about the use of DOACs and, in particular, their use among the elderly, we used the nationwide GRASP-AF registry of 3352 General Practices in England between 2009 and 2018 to study changes in OAC and AP prescription for stroke prophylaxis in AF.
Methods
The GRASP-AF registry
The GRASP-AF tool, launched in 2009, was developed to help General Practitioner’s assess the risk of AF-related stroke and guide the effective management of patients with AF.8 The tool is based on the use of Morbidity Information Query and Export SynTax (MIQUEST), a common query process integrated by all of the primary care computer systems in England. Originally, the GRASP-AF tool was parameterized around the CHADS2 risk evaluation system but further updated from 2011 to fit the CHA2DS2-VASc score which gives a better stratification of lower-risk patients. Participating General Practices voluntarily upload their prospective GRASP-AF data onto the central server registry. Each upload contains a snapshot of all eligible patients with AF and their prescription at that practice at that time. The GRASP-AF registry was set up and is managed by PRIMIS (Primary Care Information Services) at the University of Nottingham.
Patients with atrial fibrillation
Patients with current, or history of, AF or atrial flutter were identified through a comprehensive set of Read codes (Supplementary material online, Table S1) from the GRASP-AF registry, 1 January 2009 to 31 December 2018.8,14 For each patient, the risk of stroke was estimated from the components and associated coefficients of the CHADS2 score, namely each patient’s age, history of heart failure, hypertension, diabetes, and stroke or transient ischaemic attack (see Read codes in Supplementary material online, Table S1).15 From 2011, the CHA2DS2-VASc score was also incorporated into the GRASP-AF tool by including vascular disease as well as the CHADS2 score’s revised coefficients.16,17
Each General Practice recorded patient-level data using the GRASP-AF tool that included information about the prescription of OAC and AP therapy by CHADS2 and CHA2DS2-VASc scores. Data are summarized at the level of the General Practice and uploaded onto a central server by participating practices. For this study, the uploaded data were aggregated by age bands (<30, 30–49, 50–64, 65–79, and ≥80 years), prescription of OAC or AP, and the data extracted separately by CHADS2 or CHA2DS2-VASc score (according to period of study). Patient data from the risk scores were then aggregated at four levels of stroke risk: 0, 1, 2, and >2.7 Based on European Society of Cardiology (ESC) Clinical Practice Guidelines for AF,4 OAC therapy is recommended for men with a stroke CHA2DS2-VASc risk ≥1 and women with a stroke risk ≥2. Population data relating to each General Practice were aggregated by the same age bands. Although General Practices may upload data multiple times in any given year, only the first upload of the year for each practice was extracted for this study.
Oral anticoagulation and antiplatelet therapy
Patients with AF within the last 6 months were identified through Read codes (Supplementary material online, Table S2). Their anticoagulant uptake was determined and included both vitamin K antagonists (VKAs) (warfarin, acenocoumarol, and phenindione) and non-VKA including dabigatran and rivaroxaban (both first introduced in the UK in 2008), apixaban (first introduced in the UK in 2011) and edoxaban (first introduced in the UK in 2015). Data for AP prescription (aspirin, clopidogrel, and dipyridamole) was similarly extracted (Supplementary material online, Table S2). Patients issued AP therapy were counted only if they were not co-prescribed OAC.
Statistical analysis
The prevalence of AF was calculated by year and age using the total number of patients with AF as a proportion of the total number of patients registered at each General Practices. The use of OAC and AP therapy was derived from the number of patients with AF prescribed OAC or AP therapy divided by the number of patients with AF across each CHADS2 or CHA2DS2-VASc score.
To determine the temporal trends of OAC and AP prescription, we used generalized linear models with a logit link and binomial distribution and plotted results using cubic splines. Sequential models were fitted which regressed the proportion of patients with AF prescribed OAC or AP therapy on age band and year as well as an age by year interaction to model the effect of aged-related temporal changes in prescription and compared with the null model. Each model was weighted by the size of the General Practice. Separate models were applied to patients with AF stratified by their respective stroke risk score. Analyses were performed for patients with the CHADS2 scores across 2009–2018 and patients with the CHA2DS2-VASc score across 2011–2018.
A permutation test was performed to assess differences between the growth of the prescription curves of a DOAC and VKA among patients with a recorded CHA2DS2-VASc score.18 The growth differences were compared according to CHA2DS2-VASc scores and age bands. Analyses were undertaken using R version 3.6.0 (http://www.r-project.org/). In line with National Health Service (NHS) research governance arrangements, ethical approval was not required for this analysis.
Results
Between 2009 and 2018, 3352 individual General Practices provided a total of 5968 uploads into the GRASP-AF database (the median number of uploads each year 501, interquartile range 407–568). From the first upload per General Practice, there were an estimated 450 518 patients with AF from a total of 24 644 210 people, and over the study period the prevalence of AF was 1.8% [95% confidence interval (CI) 1.7–1.9%], which increased from 1.6% (1.5–1.7%) in 2009 to 2.4% (2.3–2.5%) in 2018 (P-trend < 0.001, Figure 1). The prevalence of AF was stable for people aged <65 years (P-trends not significant), but increased over time for those aged 65–79 and ≥80 years (P-trend, both <0.001) (Figure 1, Supplementary material online, Table S3).
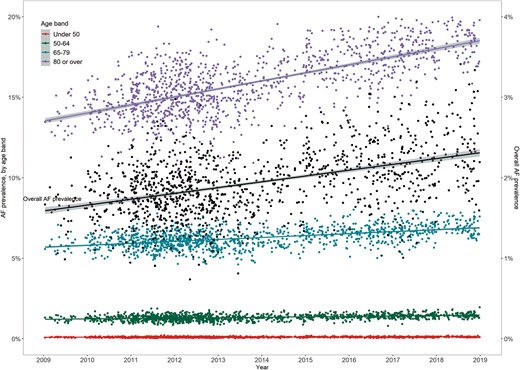
The temporal prevalence of AF, 2009–2018. AF, atrial fibrillation.
Temporal trends in oral anticoagulant and antiplatelet prescription: CHADS2, 2009–2018
Overall, the proportion of patients with AF who were prescribed OAC or AP was 59.4% and 25.3%, respectively, with proportions varying across practices. Over the study period, the variability (interquartile range) across practices in the proportion of AF prescribed OAC and AP therapy decreased from 17.6% to 10.5% and from 15.0% to 4.0% for OAC and AP therapy, respectively (Supplementary material online, Table S4). In the earlier years (2009–2013), the prescribing variation was wider by CHADS2 score, however, this variation reduced to similar level across the CHADS2 scores from 2015 onwards (Supplementary material online, Table S4).
In total, 58.5% of the AF population had a CHADS2 score of ≥2 and 84.2% ≥1. There was a year-on-year increase in the prescription of OAC with increasing CHADS2 score (Table 1). For all patients with AF, the proportion prescribed an OAC increased from 47.6% in 2009 to 75.0% in 2018 (P-trend < 0.001; relative risk 1.57, 95% CI 1.55–1.60), whereas the proportion prescribed an AP decreased from 37.4% to 9.2% over the same period (P-trend < 0.001). Moreover, a pattern of an increase in OAC and decrease in AP prescription was evident across each of the CHADS2 scores (Table 1).
Temporal trends of the prescription of oral anticoagulants and antiplatelets for patients with AF by CHADS2 score, 2009–2018
| Year | Number of patients with AF (prevalence, %)a | Oral anticoagulant, n (%)b | Antiplatelet, n (%)b | ||||||||
|---|---|---|---|---|---|---|---|---|---|---|---|
| CHADS2 score | CHADS2 score | ||||||||||
| 0 | 1 | 2 | >2 | Total | 0 | 1 | 2 | >2 | Total | ||
| 2009 | 16 158 (1.6) | 999 (36.2) | 2138 (47.5) | 2330 (50.8) | 2231 (51.8) | 7698 (47.6) | 791 (28.7) | 1710 (38.0) | 1796 (39.1) | 1752 (40.6) | 6049 (37.4) |
| 2010 | 58 256 (1.7) | 3543 (34.6) | 7426 (46.7) | 8392 (51.0) | 8599 (54.9) | 27 960 (48.0) | 3118 (30.5) | 6026 (37.9) | 6333 (38.5) | 5876 (37.5) | 21 353 (36.7) |
| 2011 | 163 101 (1.8) | 8768 (33.9) | 20 487 (47.3) | 25 562 (53.5) | 26 777 (57.9) | 81 594 (50.0) | 7840 (30.3) | 16 023 (37.0) | 17 183 (36.0) | 16 089 (34.8) | 57 135 (35.0) |
| 2012 | 161 747 (1.8) | 8432 (33.4) | 20 389 (48.3) | 26 484 (55.4) | 28 030 (60.4) | 83 335 (51.5) | 7739 (30.6) | 15 526 (36.8) | 16 555 (34.6) | 15 275 (32.9) | 55 095 (34.1) |
| 2013 | 61 055 (1.8) | 3142 (33.3) | 7827 (51.5) | 10 651 (58.8) | 11 571 (63.1) | 33 191 (54.4) | 2660 (28.2) | 5186 (34.1) | 5669 (31.3) | 5565 (30.4) | 19 080 (31.3) |
| 2014 | 52 102 (2.0) | 2897 (35.4) | 7442 (56.9) | 9946 (64.3) | 10 435 (67.9) | 30 720 (59.0) | 1855 (22.7) | 3686 (28.2) | 3874 (25.1) | 3896 (25.4) | 13 311 (25.5) |
| 2015 | 82 403 (2.2) | 5289 (39.8) | 13 185 (63.4) | 16 994 (70.3) | 17 981 (74.4) | 53 449 (64.9) | 2194 (16.5) | 4354 (20.9) | 4693 (19.4) | 4640 (19.2) | 15 881 (19.3) |
| 2016 | 96 063 (2.1) | 6469 (43.0) | 16 047 (67.1) | 20 647 (73.4) | 22 460 (77.6) | 65 623 (68.3) | 1895 (12.6) | 3904 (16.3) | 4454 (15.8) | 4587 (15.8) | 14 840 (15.4) |
| 2017 | 106 037 (2.1) | 7382 (44.3) | 18 637 (70.7) | 23 885 (77.0) | 25 850 (80.8) | 75 754 (71.4) | 1582 (9.5) | 3233 (12.3) | 3798 (12.2) | 4093 (12.8) | 12 706 (12.0) |
| 2018 | 88 016 (2.4) | 6237 (46.4) | 16 374 (74.7) | 20 951 (80.6) | 22 420 (84.0) | 65 982 (75.0) | 1020 (7.6) | 2089 (9.5) | 2463 (9.5) | 2551 (9.6) | 8123 (9.2) |
AF, atrial fibrillation.
Number (%) represents AF prevalence in overall population.
n (%) represents the proportion of oral anticoagulant/antiplatelet prescribing amongst patients with AF and corresponding CHADS2 score.
Although OAC prescription increased over time, in the earlier years (2009–2013) patients aged ≥80 years were less likely to be prescribed OAC than patients aged <80 years, for all CHADS2 scores ≥1 (Figure 2). However, results from general linear models stratified by CHADS2 score found that, each year, the ‘OAC prescription gap’ between patients aged ≥80 and <80 years reduced annually by 1.2% (95% CI 0.2–2.2%) for CHADS2 = 1, 1.6% (95% CI 0.9–2.3%) for CHADS2 = 2, and 1.8% (95% CI 1.3–2.4%) for CHADS2 >2. In parallel, the ‘AP prescription gap’ for the same age bands reduced by a similar magnitude (Figure 2). At the end of the study in 2018, there was an OAC-prescription gap between age ≥80 years and age <80 years for CHADS2 >2 [odds ratio (OR) 0.63, 95% CI 0.58–0.67] and CHADS2 = 2 (OR 0.79, 95% CI 0.74–0.84), but not for CHADS2 = 1 (OR 0.95, 95% CI 0.89–1.02).
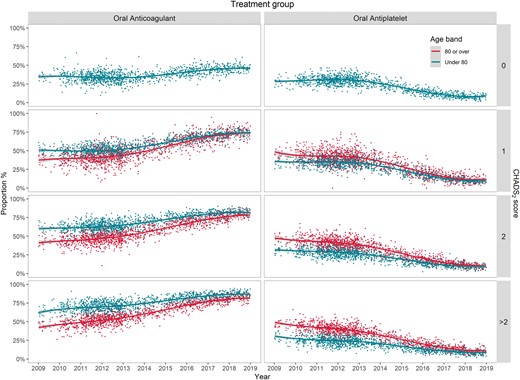
The temporal trend of oral anticoagulant and antiplatelet prescriptionfor patients with AF by age band and CHADS2 score, 2009–2018. AF, atrial fibrillation.
Temporal trends in oral anticoagulant and antiplatelet prescription: CHA2DS2-VASc, 2011–2018
Overall, 62.5% of patients with AF were prescribed OAC (45.8% VKA and 16.5% DOAC), and 21.9% of patients with AF were prescribed AP therapy (Table 2 and Supplementary material online, Table S5).
Temporal trend of the prescription of DOACs and VKA for patients with AF by CHA2DS2VASc score, 2011–2018
| Year | Number of AF patients prescribed with OAC (%) | DOAC | VKA | ||||||||
|---|---|---|---|---|---|---|---|---|---|---|---|
| CHA2DS2-VASc score | CHA2DS2-VASc score | ||||||||||
| 0 | 1 | 2 | >2 | Total | 0 | 1 | 2 | >2 | Total | ||
| 2011 | 20 575 (49.6) | 1 (0.2) | 3 (0.2) | 3 (0.1) | 15 (0.1) | 22 (0.1) | 614 (99.2) | 1543 (99.5) | 3267 (99.5) | 15 062 (99.6) | 20 486 (99.6) |
| 2012 | 72 253 (51.3) | 7 (0.4) | 48 (0.9) | 79 (0.7) | 273 (0.5) | 407 (0.6) | 1858 (98.5) | 5227 (97.8) | 10 925 (98.4) | 53 165 (98.6) | 71 175 (98.5) |
| 2013 | 33 177 (54.4) | 36 (4.5) | 92 (4.0) | 164 (3.3) | 697 (2.8) | 989 (3.0) | 756 (95.3) | 2222 (95.4) | 4832 (96.2) | 24 227 (96.8) | 32 037 (96.6) |
| 2014 | 30 720 (59.0) | 84 (12.9) | 238 (12.0) | 501 (10.6) | 2087 (8.9) | 2910 (9.5) | 566 (86.8) | 1737 (87.8) | 4205 (89.1) | 21 233 (90.9) | 27 741 (90.3) |
| 2015 | 53 449 (64.9) | 264 (25.5) | 845 (23.8) | 1636 (19.3) | 7380 (18.3) | 10 125 (18.9) | 769 (74.3) | 2704 (76.0) | 6808 (80.3) | 32 885 (81.4) | 43 166 (80.8) |
| 2016 | 65 623 (68.3) | 618 (47.7) | 1753 (39.5) | 3666 (35.7) | 15 556 (31.4) | 21 593 (32.9) | 677 (52.3) | 2680 (60.3) | 6595 (64.2) | 33 977 (68.5) | 43 929 (66.9) |
| 2017 | 75 754 (71.4) | 929 (63.9) | 2779 (54.9) | 5933 (49.4) | 25 688 (44.9) | 35 329 (46.6) | 524 (36.0) | 2264 (44.7) | 6044 (50.4) | 31 477 (55.0) | 40 309 (53.2) |
| 2018 | 65 865 (75.0) | 871 (74.9) | 2881 (66.5) | 6357 (61.6) | 28 635 (57.2) | 38 744 (58.8) | 289 (24.8) | 1446 (33.4) | 3944 (38.2) | 21 370 (42.7) | 27 049 (41.1) |
AF, atrial fibrillation; DOAC, non-vitamin K antagonist oral anticoagulant; OAC, oral anticoagulant; VKA, vitamin K antagonist.
In total, 84.7% of the AF population had a CHA2DS2-VASc score ≥2 and 94.5% ≥1. There was a year-on-year increase in the prescription of OACs with increasing CHA2DS2-VASc score (Table 2). For all patients with AF, the proportion prescribed OAC increased from 49.6% in 2011 to 75.0% in 2018 (P-trend < 0.001, Table 2), whereas the proportion prescribed an AP decreased from 34.6% to 9.2% over the same period (P-trend < 0.001, Supplementary material online, Table S5). Even so, at the end of 2018 <10% of General Practices achieved levels of 80% OAC prescription for eligible patients with a CHA2DS2-VASc score ≥2 and age ≥80 years.
Although OAC prescription did increase over time, for the earlier years (2009–2013) patients aged ≥80 years were less likely to be prescribed OAC than patients aged <80 years, for all CHA2DS2-VASc scores >2 (Figure 3). Nonetheless, analyses stratified by CHA2DS2-VASc score found that, each year, the ‘OAC prescription gap’ between patients aged ≥80 and <80 years reduced annually by 1.7% (95% CI 1.2–2.3%) for CHA2DS2-VASc score >2, with a corresponding reduction in the magnitude of the ‘AP prescription gap’ for the same age bands (Figure 3). At the end of the study in 2018, there was an OAC-prescription gap between age ≥80 years and age <80 years for CHA2DS2-VASc >2 (OR 0.74, 95% CI 0.71–0.77), but not for CHA2DS2-VASc = 2 (OR 0.90, 95% CI 0.81–1.00).

The temporal trend of oral anticoagulant and antiplatelet prescription for patients with AF by age band and CHA2DS2-VASc score, 2011–2018. AF, atrial fibrillation.
Prescription of direct oral anticoagulants
Overall, 26.4% of patients prescribed OAC received a DOAC. Direct OAC prescription increased from 0.1% in 2011 to 58.8% of all OAC in 2018 (P-trend < 0.001, Table 2), while VKA prescription decreased from 99.6% to 41.1% over the same period (P-trend < 0.001, Table 2).
The prescription of DOACs increased at a faster rate among patients with a lower CHA2DS2-VASc score (pairwise comparisons after adjustment for multiple comparison, all P-values <0.001 Figure 4). Furthermore, for patients with the same CHA2DS2-VASc score, patients aged <65 years were more likely to be prescribed a DOAC than patients in older age bands (all P-values < 0.01 after adjustment for multiple comparison, Figure 5). At the end of the study in 2018, there was a DOAC-prescription gap between age <65 and 65–79 years for CHA2DS2-VASc score =1 (OR 0.79, 95% CI 0.72–0.87); a DOAC-prescription gap for CHA2DS2-VASc score ≥2 (OR 0.74, 95% CI 0.69–0.80 for age 65–79 years; OR 0.70, 95% CI 0.65–0.75 for age ≥80 years) compared with prescription for patients age <65 years.
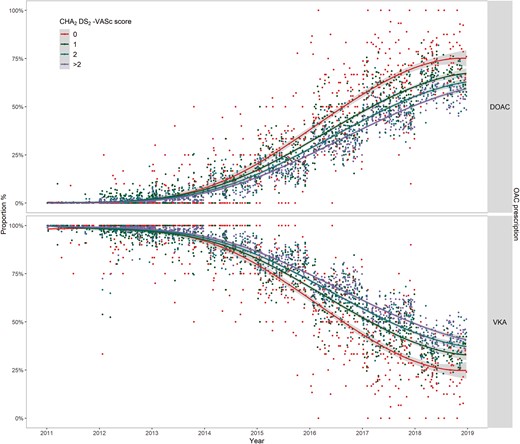
Temporals trend of the prescription of DOACs and VKA for patients with AF by CHA2DS2-VASc score, 2011–2018. AF, atrial fibrillation; DOAC, direct OAC; OAC, oral anticoagulants; VKA, vitamin K antagonists.

Temporal trends of the prescription of DOACs for patients with AF by age band, 2011–2018. AF, atrial fibrillation; DOAC, direct oral anticoagulants; VKA, vitamin K antagonists.
Discussion
This population-based, multicentre, 10-year study of the use of OAC for stroke prophylaxis for patients with AF found that the prescription of OAC for patients with AF at high risk of stroke increased by nearly 60%. By 2018, about three quarters of all patients recorded in primary care in England with AF and a CHADS2 or CHA2DS2-VASc score ≥2 were receiving OAC. This increase in OAC prescription occurred at a time of a dramatic rise in the prescription of DOACs. Beyond the decline in the use of AP therapy, however, there was evidence for General Practice level variation in the use of OAC for stroke prophylaxis, which although decreased over the study period was still evident in 2018 and suggests that the potential to reduce the risk of AF-related stroke has not been fully realized. In addition, there was a clear ‘OAC prescription gap’ among the elderly, which was evident for the prescription of DOAC.
Overall, the prescription of OAC for patients with AF increased by nearly 30% over 10 years; in the UK before 2011 <50% of patients with AF were prescribed OAC. The use of OAC for stroke prophylaxis in AF increased from circa the publication of the 2010 ESC Clinical Practice Guidelines for the management of AF, which recommended the use of OAC for all patients at moderate to high risk of stroke (CHA2DS2-VASc score ≥ 1),3 and a 2012 recommendation that the prescription of AP drugs was no longer suitable for stroke prophylaxis in low-risk patients with AF, unless patients refused or were ineligible for any type of OAC.19 Yet, other factors may have contributed to the change in prescribing habits including quality improvement initiatives such as deployment of the nationwide GRASP-AF tool, heightened physician awareness and familiarity with the CHADS2 and CHA2DS2-VASc scores, and the availability from 2011 of alternatives to VKA in the form of DOACs.
Specifically, we found that the age-dependent ‘OAC prescription gap’ reduced by nearly 20%—a reduction which was consistent across the moderate to high risk of stroke patients (determined either by CHADS2 or CHA2DS2-VASc score), and by the end of the study in 2018 OAC prescribing was less age-dependent. However, there remained inequalities in the delivery of care, evidenced by variation in the use of OAC across General Practices.20–22 Such variation suggests that the opportunity to improve the uptake of OAC for stroke prophylaxis among patients with AF has not been accomplished. In contrast, we found that the prescription of OAC among patients with a CHA2DS2-VASc of 0 increased over the study period, suggesting that in addition to the underuse of OAC among higher-risk patients, there is evidence for overuse of OAC for stroke prophylaxis in AF for those in whom it may not be appropriate. We can only speculate as to why this may be the case, and that it relates to a misperception of the balance of benefit and harm in this low-risk group. That is, patients with AF who are at low risk of stroke may be inappropriately prescribed OAC because they are felt to be at low risk of bleeding events associated with OAC and the risk of stroke if they do not receive OAC when in fact their relative gain from stroke prophylaxes is negligible.
We found that the prescription of DOACs increased substantially over the 10 years of study, to account for nearly 60% of all OAC prescription at the end of 2018. Direct OACs have been shown to be superior to VKA in stroke prevention, and carry similar overall bleeding risk.23–26 Despite this, we found that for all higher stroke risk categories, the uptake of DOACs was inversely associated with age and estimated risk of stroke, and at the end of the study there was a reduced, but persisting ‘DOAC prescription gap’. That is, there is good evidence to support the notion of an on-going risk-treatment paradox for the use of DOACs in the elderly, with higher stroke risk patients over the age of 80 years less frequently prescribed DOACs than VKA overall. It is plausible that for DOACs there remains risk-adverse strategy among healthcare professionals, again because of the misperception that OAC is associated with bleeding events is the elderly and that this outweighs the perceived benefit of stroke prevention.
Limitations
For this study, the GRASP-AF registry included 3352 individual General Practices, which represents about half of all General Practices in England. Despite this large sample size, data are uploaded voluntarily at each General Practice, and therefore may not be fully representative of the population as a whole.8 The proportion of patients aged ≥65 years in the analytical cohort, is slightly higher than that reported by the Office for National Statistics estimate for England (17.4% vs. 16.5%), again highlighting potential limitations in generalizability. The prevalence of AF was calculated according to the diagnostic code in the GRASP-AF tool, and in doing so may incur an improper estimation. Furthermore, some information such as sex and history of bleeding or other contra-indications to OAC is not separately available in the GRASP-AF data extraction, which prevents any inference about the justification for prescribing patterns. This registry data did not specify whether the prescription was for patients with newly diagnosed AF, we were unable to investigate whether the reducing prescription gap was due to therapy switching, but recognize that there is likely to be a legacy effect of chronic VKA prescription and that this might affect age bands differently. We acknowledge the limitations of the ecological study design, and given the observational nature of the study that causation is not implied.
Conclusion
This contemporary population-wide 10-year study provides good evidence for system-wide improvements in the use of OAC for stroke prophylaxis in AF. The pronounced uptake in the use of DOACs in this population is likely to have been a driver in improvement in overall OAC uptake and to have contributed, moreover, to a marked reduction in the historical age-related OAC risk-treatment paradox. Nonetheless, this study suggests that a new paradox, relating to DOAC for the elderly and higher stroke risk, exists. Local and national strategies are now required to eliminate such inequity in care so that reductions in potentially preventable AF-related strokes may be achieved.
Funding
M Hall is funded by the Wellcome Trust (Grant Reference: 206470/Z/17/Z). J Wu is supported by the National Institute for Health Research (NIHR) infrastructure at Leeds. The views expressed are those of the authors(s) and not necessarily those of the NHS, the NIHR or the Department of Health.
Conflict of interest: none declared.
Data availability
The data would be available to access upon ethical approval.
References
National Institute for Health and Care Excellence. Atrial fibrillation: management. Clinical guideline [CG180]. 2014. https://www.nice.org.uk/guidance/cg180.
Author notes
Jianhua Wu and Eman S. Alsaeed contributed equally to the study.
