


Abstract
We investigated the applicability of the Ventricular Capture Control (VCC) and Atrial Capture Control (ACC) algorithms for automatic management of cardiac stimulation featured by Biotronik pacemakers in a broad, unselected population of pacemaker recipients.
Ventricular Capture Control and Atrial Capture Control were programmed to work at a maximum adapted output voltage as 4.8 V in consecutive recipients of Biotronik pacemakers. Ambulatory threshold measurements were made 1 and 12 months after pacemaker implant/replacement in all possible pacing/sensing configurations, and were compared with manual measurements. Among 542 patients aged 80 (73–85) years, 382 had a pacemaker implant and 160 a pacemaker replacement. Ventricular Capture Control could work at long term in 97% of patients irrespectively of pacing indication, lead type, and lead service life, performance being superior with discordant pacing/sensing configurations. Atrial Capture Control could work in 93% of patients at 4.8 V maximum adapted voltage and at any pulse width, regardless of pacing indication, lead type, and service life. At 12-month follow-up, a ventricular threshold increase ≥1.5 V had occurred in 4.4% of patients uneventfully owing to VCC functioning. Projected pacemaker longevity at 1 month was strongly correlated with the 12-month estimate, and exceeded 13 years in >60% of patients.
These algorithms for automatic management of pacing output ensure patient safety in the event of a huge increase of pacing threshold, while enabling maximization of battery longevity. Their applicability is quite broad in an unselected pacemaker population irrespectively of lead choice and service of life.
• The beat-to-beat capture verification algorithm for the automatic management of ventricular output by Biotronik can reliably work in 97% of unselected pacemaker recipients, particularly at a 4.8 V maximum adapted voltage in 90% of patients, irrespectively of lead choice and lead service life.
• Biotronik's auto-threshold algorithm for atrial stimulation can reliably work at long term in 93% of patients using any pulse width at a maximum adapted voltage as 4.8 V regardless of pacing indication and lead type.
• Owing to increased safety, a small safety margin is used, thereby battery life was maximized to achieve a 13-year median projected longevity.
Introduction
The introduction of automatic algorithms for the management of atrial and ventricular stimulation has increased the knowledge about the behaviour of cardiac pacing threshold at long term.1–7 Owing to technological improvements in pacing leads manufacturing, truly modest circadian or day-to-day fluctuations of the pacing threshold have been reported for all cardiac chambers,2–5 whereas long-term studies have highlighted that right ventricular pacing threshold (RVPT) may rise, posing a safety issue when a fixed output was programmed: >13% of patients have a >1.5 V at 0.4 ms RVPT at follow-up (FU), with >2% exceeding a 3.5 V at 0.4 ms.8,9 These observations make Automatic Management of pacing output with Verification of Capture (AVC) the preferred stimulation modality in modern cardiac pacing to ensure patients safety while maximizing device longevity,8,10,11 which is of key importance to minimize device-related complications at long term.12,13 To fulfil these two pivotal clinical needs, algorithms for AVC are expected to meet two specific requirements: (i) capability to reliably detect capture at high pacing voltage and (ii) maintain constant capture by adding a small safety margin to the measured pacing threshold, thus minimizing battery drain in the presence of high pacing thresholds.11 The former requirement has historically been the greater challenge in the development of such algorithms, and is the cornerstone for the second task.11
In this study, we aimed to investigate the efficacy of the Atrial Capture Control (ACC) and Ventricular Capture Control (VCC) algorithms from Biotronik to work according to the above-mentioned very specific requirements.
Methods
Patients implanted at 11 Italian hospitals with Biotronik pacemakers equipped with algorithms for the automatic management of atrial (ACC) or ventricular (VCC) stimulation were asked to participate into the ESSENTIAL Registry by signing an informed consent as approved by each Hospital Ethics Committee.
Based on the above-mentioned observations,8–11 the algorithms were programmed to work at the maximum voltage that allowed automatic output adaptation to increase the patients' safety in the event of a pacing threshold increase. In Biotronik pacemakers, the maximum adapted voltage is 4.8 V both for the atrium and for the ventricle. This voltage is superior to nominal settings and to all available algorithms from competitors, but has never been tested in clinical practice.
Atrial Capture Control functioning
The algorithm for automatic atrial output management works as an auto-threshold algorithm: the threshold is measured periodically and the pacing output is adapted according to the programmed safety margin11; capture verification occurs only at threshold measurements.
Atrial threshold is based on detection of atrial sensed events during a step-down threshold test that runs in DDI mode with a short atrioventricular (AV) delay and post-ventricular atrial blanking (PVAB) of 150 ms. This modality enables the detection of sensed atrial events (evidence of loss of atrial capture) while preventing triggering of endless loop tachycardia. Atrial threshold occurs at the average rate +20% (or at lower rate +20%) if the intrinsic atrial rate is slower than 108 b.p.m.
Atrial threshold measurement starts at the programmed ‘test start amplitude’ (shipment programming: 3.0 V), by delivering sequences of paced beats until two atrial intrinsic events are sensed within a window of five pulses (two out of five criterion). At the firstly detected loss of capture (two sensed atrial events out of five), the device resumes the voltage without loss of capture formerly tested, and scans with smaller voltage steps. Voltage decreases in 0.1 V steps until another loss of atrial capture (two out of five) is detected again. This declares the end of the threshold search, and threshold is measured as the voltage having no capture loss detected after confirmation. Then atrial output is automatically set as measured threshold + programmed safety margin (shipment = 1 V).
In the ESSENTIAL Registry, pacemakers were programmed to start the atrial threshold test at 4.8 V, and the safety margin was programmed as threshold +0.5 V. Atrial threshold was measured at every FU visit in all the pacing/sensing configurations available with the implanted atrial lead, both at 0.4 ms and at 1 ms pulse width. Automatic threshold measurement was left at 24 h interval as per the shipment setting.
Ventricular Capture Control functioning
The VCC algorithm is a beat-to-beat verification of capture algorithm based on detection of the evoked response (ER) at each delivered ventricular pulse.11
The threshold measurement cannot run when the ventricular rate is faster than 110 b.p.m.; in DDD/R mode, the test occurs with a paced AV delay of 50 ms and with a sensed AV delay of 15 ms, whereas in VVI/R mode, the test rate is increased by 20% above the average intrinsic rate or above the basic rate when resting. The first phase is signal analysis, to ensure that the ER can be reliably detected with respect to the post-pacing artefact, and ventricular capture can be automatically assessed. In the event that ER cannot be reliably identified during the signal analysis phase, the pacing output reverts to the test start amplitude for patient safety. When signal analysis is successful, voltage step-down occurs at every elicited beat, firstly in large (0.6 V) and secondly in smaller (0.1 V) steps, until an ineffective stimulus is delivered. The last effective pulse is defined as the ventricular threshold, and the programmed safety margin (shipment = 0.5 V) is added to determine the current ventricular output. Ventricular Capture Control works at 0.4 ms pulse width only. Every paced beat is checked for ER detection, and a back-up pulse at 1 ms width is delivered in the instance of loss of capture. In the event three consecutive beats require delivery of the back-up pulse, signal analysis occurs again, and a new threshold measurement is triggered to update the current pacing output; if test start amplitude equals the current threshold, VCC reverts to a safety output as test start voltage +1.2 V. The test start amplitude is then the maximum threshold that the algorithm can manage in the AVC modality. Temporary inability to measure the pacing threshold may occur during mode switching due to atrial arrhythmias, or at a ventricular rate >110 b.p.m.: in these situations, the test is postponed and the output stays at the current value.
In the ESSENTIAL Registry, VCC was tested at 4.8 V at 0.4 ms starting voltage in all the pacing/sensing configurations available with the implanted lead: in the event the signal analysis denied the feasibility of the threshold test, 4.2, 3.6, 3, and 2.4 V were successively tested, and the maximum adapted voltage (test starting voltage) was programmed accordingly. In the event VCC could not work, the ventricular output was set following the centre's practice. This test to evaluate VCC applicability and reliability was repeated in all the patients at each device FU.
Atrial and ventricular threshold behaviour
Based on former observations, pacing threshold has little variability,1–5 the largest circadian and day-to-day fluctuations being less than or equal to actual pacing threshold +1 V in the majority of patients.1–5 However, unanticipated increase of RVPT >2 V at 0.4 ms in the presence of normally functioning pacing leads has been reported in the long term.8,9,14,15 Thus, we defined a clinically relevant pacing threshold increase as the individual average threshold +1.5 V: such an increase could cause loss of capture when a fixed pacing output at 2 or 2.5 V were used instead of automatic verification of capture, assuming an average pacing threshold between 0.5 and 1 V at 0.4 ms in the long term.
Longevity projection
According to the pacing output, the rate and the amount of pacing delivered, pacing impedance, and housekeeping drain, a projection of remaining longevity is made by the pacemaker. We collected this information at the 1-month FU visit after programming the pacemaker according to the ESSENTIAL settings, and then again at the last FU visit.
The study protocol required a first ambulatory FU within 1 month after implantation. Both manual and algorithm-operated threshold tests were measured in all the pacing/sensing configurations enabled by the implanted leads: the final output programming used the highest possible test start voltage proven to be effective during the tests. In the event ACC or VCC could not work, programming occurred following each centre practice. Repeated comparison of manual and algorithm-operated threshold measurements occurred again at 12-month FU; assessment of algorithm efficacy and reliability occurred at each visit by close inspection of the threshold tests outcome and of threshold trend along the FU time.
The main objective of the study was to evaluate the performance of the algorithms for automatic stimulation with capture verification by Biotronik, in terms of applicability (number of patients who were managed by the automatic algorithm along the FU period) and of reliability (maximum voltage and pulse width that could be effectively used in automatic adaptation by the algorithms).
The primary endpoint was the 12-month success rate of the VCC algorithm to measure the ventricular capture threshold in any given pacing/sensing configuration with a maximum tolerance of ±0.1 V at 0.4 ms with respect to manual measurement. Similarly, ACC threshold assessment with the same tolerance was the main secondary endpoint. Further secondary endpoint was to evaluate the impact of the algorithms on the projected pacemaker longevity as measured both at the first pacemaker FU and at the 12-month FU.
Statistics
The study was designed to achieve a 90% statistical power in rejecting the null hypothesis that the VCC success rate was equal or <80%, in at least one of the four available pacing/sensing configurations, with a union-intersection approach (type I error level = 0.0125), and with the additional assumption of an actually observed success rate of 86 and 10% loss during FU. Binary or categorical variables were reported as percentage along with 95% confidence interval (CI); and continuous variables as median (interquartile range). One-sample, one-sided test of proportion was used for the primary study hypotheses with a statistical significance level of P = 0.0125. All other secondary hypotheses were tested at P = 0.05, preferably by means of non-parametric tests (Wilcoxon signed-rank test, Mann–Whitney U test).
Correlation between manual and automatic threshold tests, as well as 1- and 12-month projected longevity, was linearly modelled with ordinary least squared estimations and Pearsons's coefficients, assuming normal distributions. Principal baseline clinical and pacing-system characteristics were included in uni- and multivariate logistic models to identify VCC failures.
Times to first investigator's detected VCC/ACC failure were analysed with the Kaplan–Meier approach. STATA/SE 11.1 version (StataCorp LP, College Station, TX, USA) was used for statistical analyses.
Results
From January 2012 to March 2013, 542 patients consecutively implanted with Biotronik pacemakers signed the written informed consent to participate in the ESSENTIAL Registry. The study population (Table 1) was representative of the population currently requiring cardiac stimulation, comprising both de novo implants (71%) and replacements (29%): 88% of patients received a DDD/R pacemaker. During 1-year FU, 20 patients (3.7%) died, 3 (0.5%) underwent pacing-system removal/replacement due to skin erosion, lead failure, and upgrade to cardiac resynchronization therapy, 55 (10.1%) with ACC/VCC working appropriately skipped the scheduled 12-month FU for any reason.
Patient characteristics
| All patients (n = 542) | De novo implants (n = 382) | Replacements (n = 160) | P-value | |
|---|---|---|---|---|
| Gender (male) | 328 (60%) | 229 (60%) | 99 (62%) | 0.50 |
| Age at implant (years) | 80 (73–85) | 79 (72–84) | 82 (76–86) | 0.0002 |
| Baseline characteristics | ||||
| CAD | 111 (20%) | 77 (20%) | 34 (21%) | 0.33 |
| Valvular disease | 116 (21%) | 84 (22%) | 32 (20%) | 0.59 |
| Hypertension | 357 (66%) | 250 (65%) | 107 (67%) | 0.09 |
| Diabetes | 98 (18%) | 69 (18%) | 29 (18%) | 0.48 |
| Prior AF | 146 (27%) | 108 (28%) | 38 (24%) | 0.37 |
| Heart failure | 56 (10%) | 41 (11%) | 15 (9%) | 0.86 |
| Renal insufficiency | 51 (9%) | 40 (10%) | 11 (7%) | 0.72 |
| Pacemaker indication | ||||
| Sick sinus syndrome | 123 (23%) | 90 (24%) | 33 (21%) | 0.52 |
| AV block | 410 (76%) | 290 (76%) | 120 (75%) | 0.99 |
| Neurally mediated syncope | 23 (4%) | 14 (4%) | 9 (6%) | 0.39 |
| Pacemaker | ||||
| VVI | 63 (12%) | 41 (11%) | 22 (14%) | 0.49 |
| DDD | 479 (88%) | 341 (89%) | 138 (86%) | |
| Ventricular lead | ||||
| Threshold at 0.4 ms (V)a | 0.4 (0.3–0.6) | 0.4 (0.3–0.6) | 0.4 (0.3–0.7) | 0.53 |
| Amplitude (mV)a | 12.0 (9.0–16.0) | 12.0 (8.7–16.0) | 12.0 (9.2–15.1) | 0.86 |
| Impedance (ohm)a | 700 (565–885) | 700 (570–885) | 690 (560–869) | 0.46 |
| Active fixation | 224 (41%) | 193 (51%) | 31 (19%) | <0.0001 |
| Bipolar | 513 (95%) | 382 (100%) | 131 (82%) | <0.0001 |
| Biotronik lead | 104 (19%) | 84 (22%) | 20 (13%) | 0.003 |
| Lead age (years) | 7 (3–10) | |||
| Lead position | ||||
| RV apex | 483 (89%) | 333 (87%) | 150 (94%) | 0.0001 |
| Other position | 59 (11%) | 49 (13%) | 10 (6%) | |
| Atrial lead | ||||
| Threshold at 0.4 ms (V)a | 0.5 (0.4–0.7) | 0.5 (0.4–0.7) | 0.5 (0.4–0.6) | 0.09 |
| Amplitude (mV)a | 3.5 (2.5–4.7) | 3.5 (2.5–4.7) | 3.4 (2.3–4.9) | 0.26 |
| Impedance (ohm)a | 507 (457–612) | 504 (450–600) | 560 (464–686) | 0.02 |
| Active fixation | 173 (36%) | 152 (44%) | 21 (15%) | <0.0001 |
| Bipolar | 450 (94%) | 328 (96%) | 122 (88%) | <0.0001 |
| Biotronik lead | 94 (20%) | 77 (22%) | 17 (12%) | 0.002 |
| Lead age | 7 (2–11) | |||
| Lead position | ||||
| Appendage | 455 (95%) | 326 (96%) | 129 (93%) | 0.25 |
| Other position | 24 (5%) | 15 (4%) | 9 (7%) | |
AF, atrial fibrillation; AV, atrioventricular; CAD, coronary artery disease.
aValues at baseline.
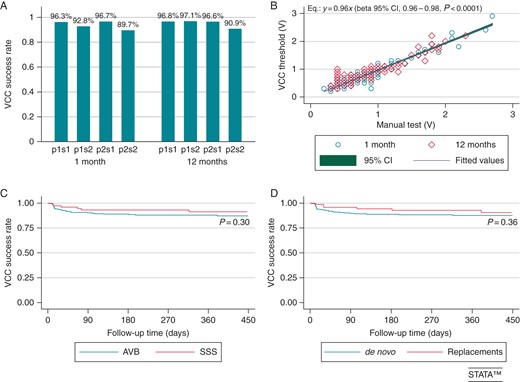
(A) Ventricular Capture Control success rates at the 1- and 12-month FUs in all the pacing/sensing configurations available and tested. sj and pj codes (j= 1,2) were used for unipolar/bipolar sensing and pacing, respectively. All configurations ensured high success rates. However, configurations with unipolar pacing/sensing performed slightly better than configuration with bipolar pacing/sensing: at 1 and 12 months, P = 0.008 and P < 0.0001, respectively, in favour of p1/sj configurations vs. p2sj; P < 0.0001, at both 1 and 12 months, in favour of pjs1 vs. pjs2 configurations. Also configurations with discordant pacing/sensing polarities (p1s2 and p2s1) were associated with a significantly higher success rates at both 1 month (P = 0.002) and 12 months (P = 0.04). (B) Linear (no-constant) regression between ventricular thresholds automatically measured by the VCC function and the corresponding manual tests. (C and D) Kaplan–Meier analysis of time to the first detected VCC failure in SSS vs. AVB and de novo vs. replacement implant subgroups. AVB, atrioventricular block; SSS, sick sinus syndrome; VCC, Ventricular Capture Control algorithm.
In order to identify baseline predictors of failure at both 1 and 12 months, uni- and multivariate logistic models were evaluated (Tables 2 and 3). None of the considered variables were associated with increased odds of VCC failure except for screw-in lead at 1 month [OR: 2.41 (1.02–5.69), P = 0.04] and R-wave amplitude at 12 month [OR: 0.85 (0.76–0.95), P = 0.003].
Predictors of VCC failure
| Odds of VCC failure | ||||
|---|---|---|---|---|
| Bipolar pacing, bipolar sensing | ||||
| 1 month | 12 months | |||
| OR (95% CI) | P-value | OR (95% CI) | P-value | |
| Clinical variables | ||||
| Male | 1.25 (0.70–2.27) | 0.45 | 1.06 (0.54–2.08) | 0.87 |
| Age | 1.01 (0.98–1.05) | 0.41 | 1.03 (0.99–1.08) | 0.09 |
| CAD | 0.55 (0.24–1.27) | 0.16 | 0.60 (0.23–1.59) | 0.31 |
| Valvular disease | 1.80 (0.95–3.40) | 0.07 | 1.07 (0.49–2.38) | 0.85 |
| Hypertension | 1.06 (0.57–1.97) | 0.86 | 0.90 (0.44–1.84) | 0.78 |
| Diabetes | 0.43 (0.16–1.11) | 0.08 | 0.12 (0.02–0.87) | 0.04 |
| AF history | 1.18 (0.63–2.21) | 0.60 | 1.08 (0.51–2.27) | 0.84 |
| HF history | 1.18 (0.50–2.93) | 0.71 | 0.76 (0.22–2.58) | 0.66 |
| CKD | 0.60 (0.18–2.00) | 0.41 | 0.34 (0.04–2.47) | 0.28 |
| SSS | 0.90 (0.50–1.83) | 0.78 | 1.21 (0.56–2.59) | 0.63 |
| AV block | 1.32 (0.64–2.73) | 0.45 | 0.70 (0.34–1.44) | 0.33 |
| Pacing variables | ||||
| Screw lead | 2.10 (1.16–3.81)a | 0.02 | 1.43 (0.73–2.79) | 0.29 |
| Capture threshold | 1.16 (0.68–1.98) | 0.58 | 0.60 (0.14–2.60) | 0.50 |
| R-wave amplitude | 0.95 (0.90–1.01) | 0.11 | 0.86 (0.78–0.93)a | <0.0001 |
| Impedance | 1.00 (0.99–1.01) | 0.90 | 1.00 (0.99–1.01) | 0.76 |
| Lead age | 1.00 (0.92–1.09) | 0.90 | 1.12 (1.03–1.20)a | 0.004 |
| Biotronik lead | 1.07 (0.53–2.16) | 0.86 | 0.76 (0.30–1.88) | 0.55 |
Results of univariate analyses are shown. Independent predictors at multivariate analyses are marked.
AF, atrial fibrillation; AV, atrioventricular; CAD, coronary artery disease; CKD, chronic kidney disease; HF, heart failure; SSS, sick sinus syndrome.
aIndependent predictor at a multivariate analysis including variables associated to P < 0.10 (valvular disease, diabetes mellitus, screw-in lead, age, R-wave amplitude, lead age).
Predictors of ACC failure
| Odds of ACC failure | ||||
|---|---|---|---|---|
| Pulse width 0.4 ms, unipolar pacing | ||||
| 1 month | 12 months | |||
| OR (95% CI) | P-value | OR (95% CI) | P-value | |
| Clinical variables | ||||
| Male | 0.46 (0.19–1.14) | 0.09 | 0.45 (0.17–1.18) | 0.10 |
| Age | 1.03 (0.99–1.08) | 0.16 | 0.98 (0.95–1.03) | 0.53 |
| CAD | 0.73 (0.27–1.97) | 0.54 | 1.36 (0.52–3.59) | 0.53 |
| Valvular disease | 0.45 (0.13–1.52) | 0.20 | 1.20 (0.46–3.15) | 0.71 |
| Hypertension | 1.03 (0.46–2.34) | 0.94 | 0.97 (0.40–2.34) | 0.94 |
| Diabetes | 1.34 (0.54–3.23) | 0.53 | 1.30 (0.46–3.66) | 0.61 |
| AF history | 0.63 (0.21–1.87) | 0.41 | 0.55 (0.16–1.90) | 0.34 |
| HF history | 1.68 (0.55–5.13) | 0.36 | 1.71 (0.47–6.18) | 0.41 |
| CKD | 1.13 (0.32–3.93) | 0.85 | 1.09 (0.24–4.93) | 0.91 |
| SSS | 1.19 (0.51–2.77) | 0.69 | 1.34 (0.54–3.38) | 0.53 |
| AV block | 0.68 (0.29–1.60) | 0.38 | 0.49 (0.20–1.19) | 0.11 |
| Pacing variables | ||||
| Screw lead | 0.49 (0.20–1.20) | 0.12 | 0.27 (0.09–0.83) | 0.02 |
| Capture threshold | 0.36 (0.04–3.02) | 0.34 | 1.12 (0.14–9.00) | 0.91 |
| P-wave amplitude | 0.65 (0.46–0.92) | 0.02a | 0.99 (0.95–1.04) | 0.83 |
| Impedance | 1.00 (0.99–1.01) | 0.48 | 1.00 (0.99–1.01) | 0.89 |
| Lead age | 1.09 (1.02–1.18) | 0.01a | 1.07 (0.99–1.16) | 0.09 |
| Biotronik lead | 1.42 (0.61–3.34) | 0.42 | 1.00 (0.36–2.79) | 0.99 |
Results of univariate analyses are shown. Independent predictors at multivariate analyses are marked.
AF, atrial fibrillation; AV, atrioventricular; CAD, coronary artery disease; CKD, chronic kidney disease; HF, heart failure; SSS, sick sinus syndrome.
aIndependent predictor at a multivariate analysis including variables associate to P < 0.10 (male, P-wave amplitude, screw-in lead, lead age).
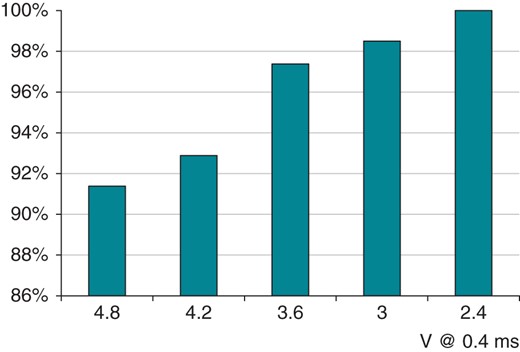
Ventricular Capture Control success rate: relationship with starting voltage (maximum adapted output).

Example of VCC reliability at very high pacing threshold over 12 months (ranging from 3.2 to 4.6 V) in a 82-year-old patient on anti-epilepsy medications.
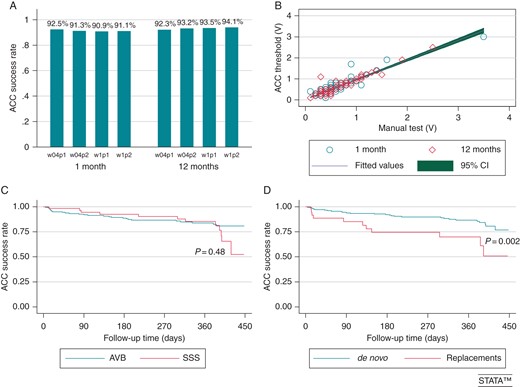
(A) Atrial Capture Control success rate in different pacing/sensing configurations (p1 = pacing unipolar; p2 = pacing bipolar; s1 = sensing unipolar; s2 = sensing bipolar) and at different pulse widths (w04 = pulse width 0.4 ms; w1 = pulse width 1 ms) at 1- and 12-month FU. (B) Correlation of automatic atrial threshold measurements with manual threshold measurements. (C) Atrial Capture Control success rate and pacing indications. (D) Atrial Capture Control success rate in first implants and pacemaker replacements.
Atrial fibrillation episodes >24-h occurred in 48/464 during 1-year FU. Patients with sick sinus syndrome or those undergoing pacemaker replacement were more likely to have recurrent atrial arrhythmias during FU (21/48), hence had a lower applicability of ACC (Figure 4C and D).
No clinical event potentially related to the functioning of ACC and VCC occurred during the study period. An increase of atrial or ventricular pacing threshold >1.5 V occurred in two and in eight patients, respectively: the 12-month product limit estimations were 0.6% (CI, 0.1–2.5%) in atrium and 4.4% (CI, 2.0–9.6%) in ventricle. No predictors of a threshold increase were found at multivariable analysis (Table 2).
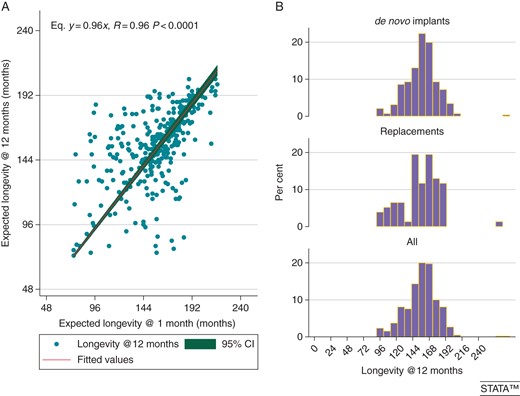
(A) Correlation of projected pacemaker longevity obtained at 1-month FU after VCC and ACC programming with the 12-month projected longevity. (B) Projected pacemaker longevity across the whole population.
Discussion
The use of AVC algorithms maximizes the safety of paced patients while enabling an increased device longevity8–10 that turns into increased patients' comfort, decreased replacement-related complications,12,13 and cost reduction thanks to matching of patients life expectancy with device span-of-life. We report here the first clinical experience with Biotronik atrial and ventricular AVC algorithms. We observed that ACC and VCC ensure a broad applicability to the general pacemaker population irrespectively of lead type and service of life, being able to perform adequately also with aged leads at pacemaker replacement. Their reliability enabled a remarkable device longevity also in patients with high pacing thresholds, where frequent replacements or new lead addition is associated with complications and infections.12,13,14
Ventricular Capture Control
Ventricular Capture Control worked appropriately in 97% of patients along the whole FU period (Figure 1A). The use of screw-in leads hindered VCC functioning in the early weeks after implantation possibly due to the inflammatory response around the lead tip; diabetes, which is associated with a low propensity at wound healing and scarring, was associated with a better VCC functioning at 12 months (Table 2). Aged leads yielding low-amplitude signals were associated with inferior VCC performance (Table 2). Ventricular Capture Control enabled a maximum adapted output as 4.8 V at 0.4 ms in 90% of this unselected population (Figure 2) implanted with leads of any type from all manufacturers. This characteristic of VCC makes it unique for the management of high pacing thresholds: a reliable beat-to-beat detection of capture at high voltage enables the use of a small safety margin, thereby ensuring safe cardiac stimulation over several years leading to an acceptable projected longevity (Figure 5). Unanticipated ventricular threshold increase >2.5 V at 0.4 ms at long term occurs in ∼4% of patients implanted with state-of-the-art pacing leads,8,9,15–17 and represents a relevant issue in cardiac stimulation; in fact, it triggers reversion to a high output setting (5 V at 1 ms) with auto-threshold algorithms11 causing a huge battery drain that impacts on longevity. Ventricular Capture Control has advantages compared with the Boston Scientific algorithm in terms of maximum adapted voltage (4.8 V vs. 3 V), and compared with St Jude (that can work at any pulse width) in terms of flexibility to the implanted lead (any vs. low polarization required).18,19 The management of patients with high pacing threshold approaching device replacement with a device featuring VCC should be considered as an alternative to a new lead addition, especially in the setting of the elderly or of high-risk patients to minimize complications.12,13,20 Indeed, our data highlight that VCC reliability is comparable in de novo implants as well as in replacements, where aged leads were in place (Figure 1D). In this study, we repeated multiple tests at FU visits to investigate what pacing/sensing configuration ensured the best detection of capture at 4.8 V: it appeared that unipolar sensing and discordant pacing/sensing configurations yielded a superior performance (Figure 1). This observation is consistent with previous research where a large-surface anode or independent pacing/sensing vectors decreased the post-pacing residual voltage, enhancing detection of the ER.21,22 Consistently with these observations, the newest Biotronik devices feature a dedicated unipolar ER detection channel. Similarly, automatic management of LV stimulation can be reliably assessed by independent pacing sensing vectors22,23 or by morphological detection of the ER in cardiac resynchronization therapy (CRT) devices.24,25 Automatic management of LV capture has proved feasible,5,26 and significantly enhances device longevity.4
Atrial Capture Control
The only predictor of ACC performance at long term was the use of screw-in leads, possibly owing to lead stability (Table 3). Limited data are available about the applicability and reliability of algorithms for atrial AVC, Medtronic algorithm being the most extensively investigated in <300 patients.2,27 Biotronik ACC worked at long-term FU in 93% of patients with a single daily attempt as per the shipment programming, and succeeded at threshold measurement during ambulatory FU in >90% of patients. Indeed, ACC is insensitive to the patient's underlying AV conduction, performs reliably in sinus node disease patients (Figure 4C), and was fooled by fast retrograde conduction equal or shorter than PVAB during the threshold test only in 0.2% of patients. On the contrary, Atrial Capture Management by Medtronic has been reported to return an ambulatory test in only 64% of patients,27 and needed to run multiple attempts to increase the chances to achieve at least one threshold update daily in an unselected patient population,2 thus requiring reprogramming from shipment settings. The 2/5 sensed atrial events criterion used to assess loss of atrial capture makes the Biotronik algorithm more sensitive than the Medtronic one in the assessment of loss of capture, hence in the measurement of atrial threshold.2,27 Unlike Boston Scientific and St Jude Medical algorithms,11 ACC is not based on detection of atrial ER, thus can work in any pacing/sensing configuration (Figure 4A). Moreover, ACC functioning allows the use of any pulse width at no trade-off with reliability owing to its specific functioning. Another important difference is the maximum adapted threshold, i.e. the threshold at which reversion to a high output setting occurs: we observed a correct algorithm performance in 100% tests at a starting test voltage as 4.8 V at any pulse width that enables output adaptation at very high threshold together with minimization of the safety margin. In Medtronic pacemakers, the output of 5 V at 1 ms is used whenever a threshold >2.5 V at 0.4 ms is detected, thereby causing a huge battery drain; in Boston Scientific and St Jude, a 2 V minimum pacing output and a non-programmable safety margin, respectively 2× threshold and 1.7× threshold, are used. Daily measurement of atrial threshold and safety margin minimization are key to ensure consistent atrial capture and longevity maximization, especially in the event of a high pacing threshold.2
Effect on pacemaker longevity
Atrial Capture Control and Ventricular Capture Control are active by shipment, and were programmed to work with a threshold +0.5 V safety margin: this turned into a projected longevity of 13–16 years for >60% of patients, which makes the management of bradyarrhythmias absolutely affordable from the economic standpoint and comparable to other chronic illnesses (hypertension, diabetes, and hypercholesterolemia). Projected longevity by cardiac implantable electronic device built-in algorithms has proved to be highly reliable, since the earliest pacemaker featuring Autocapture™8,10 up to recent implantable cardioverter defibrillator/CRT defibrillator releases.28–30
Conclusion
The algorithms for AVC by Biotronik proved to be applicable in the majority of pacemaker recipients, and to perform reliably irrespectively of (i) lead type and service of life; (ii) pulse width and pacing/sensing configuration for ACC; and (iii) patient indication to cardiac pacing. Ventricular Capture Control seems to perform better with unipolar ER detection, and allowed a very high maximum adapted output ensuring added safety in the event of an unanticipated threshold increase while maintaining an acceptable device longevity.
Acknowledgements
The authors thank Alessio Gargaro, Diego Grassini, Eros Rocchetto, and Daniele Giacopelli for their helpful cooperation in data collection.
Conflict of interest: M.B. reported educational activity and speakers' bureau on behalf of Biotronik, Boston Scientific, and Medtronic. G.B. reported speaker's fees from Boston Scientific, Medtronic, St Jude, and Boehringer Ingelheim.
