


Previous studies have reported the defibrillation testing during implantable cardioverter defibrillator (ICD) implantation is associated with elevated cardiac biomarkers and ST-segment electrocardiogram (ECG) changes suggesting that shocks during testing may cause harm. However, the effects of testing have not been isolated from the implant procedure itself, where lead deployment may cause myocardial damage. This prospective study examined high sensitivity troponin T (hs-TnT) levels and ECG changes during ICD implanting alone, ICD implantation with testing and device testing as a stand-alone procedure.
We examined hs-TnT at baseline, and 6–8 h post procedure and 12 lead ECG at baseline, and 30 s, 5 min, and 10 min post right ventricle lead deployment and post defibrillation. There was no significant change in hs-TnT levels in a group of patients (n = 11) undergoing defibrillation testing alone, while hs-TnT was significantly elevated in patients undergoing implantation alone (n = 13, median increase 96%, P = 0.005) and in patients undergoing implantation and testing (n = 13, median increase 161%, P = 0.005). There was a significant correlation between the number of lead deployments and the percentage change in hs-TnT (r = −0.51, P = 0.01), but no correlation between either the number of shocks (r = 0.26, P = 0.25) or the total delivered energy (r = 0.24, P = 0.30) and percentage change in hs-TnT.
Implantation of ICD leads was associated with release of troponin, but we did not observe any evidence that ICD shocks alone cause myocardial injury.
Implantable cardioverter defibrillator implantation and testing is associated with release of cardiac troponin that is correlated to the number of ventricular lead deployments during the procedure.
Implantable cardioverter defibrillator testing conducted as a stand-alone procedure does not result in the release of cardiac troponin.
Introduction
Implantable cardioverter defibrillators (ICDs) reduce mortality from life-threatening ventricular arrhythmias in both primary and secondary prevention settings. Despite the proven ability of ICDs to reduce mortality by delivery of appropriate defibrillation, there is increasing evidence that suggests that shocks from ICDs may also cause harm.1,2 However, in observational studies it is not possible to separate potential harm from shocks from confounding factors such as the effects of rhythm disturbances or the underlying cardiac condition that are associated with delivery of the therapy itself.1,3
A number of studies have demonstrated that elevations in cardiac enzymes4–7 and ST segments change on the electrocardiogram8 occur in patients undergoing device testing at the time of device implantation. These studies are frequently cited as evidence in support of the argument that shocks from ICDs are inherently harmful. The difficulty with the cardiac enzyme changes at the time of testing has been that the process of implantation of the device has not been separated from the process of device testing. Because lead deployment itself causes release of cardiac biomarkers,4,9,10 these studies have not directly demonstrated that defibrillation from an ICD is causing release of cardiac enzymes.
In this study, we examined high sensitivity troponin T (hs-TnT) levels and electrocardiogram (ECG) changes following ICD implantation alone (implant), ICD implantation with device testing (implant + testing) and device testing performed as a stand-alone procedure (testing) to determine whether there is evidence of myocardial injury associated with shocks alone as opposed to deployment of ICD or pacing leads.
Methods
Study population
This was a prospective observational study enrolling patients at Wellington Hospital, New Zealand undergoing ICD implantation or testing. We excluded any patients with an acute coronary syndrome within the preceding 3 months, unstable baseline hs-TnT values or if during testing transthoracic defibrillation was required due to failure to terminate VF with the ICD. All patients gave written informed consent, and the study had been reviewed and approved by the University of Otago Ethics Committee.
Patients underwent device implantation alone, device implantation plus testing or device testing alone. Whether a patient initially had device implantation alone or implantation plus testing was determined by the availability of anaesthetic services rather than by any clinical criteria. Those implanted without anaesthetic cover were bought back for device testing remotely when cover was available.
Implantable cardioverter defibrillators from four companies (Biotronik, Boston Scientific, Medtronic, St Jude Medical) were implanted in the study subjects. The corresponding companies' programmer was used for analysis with company standard electrical filters applied. Active fixation bipolar ventricular (defibrillation) electrodes were implanted in all cases. Active fixation atrial electrodes were implanted in selected cases at the operator's discretion. The number of times an electrode active fixation thread was fully deployed in an intracardiac position was recorded for each case. Passive testing with the active fixation mechanism retracted was not counted.
Where ICD implantation was performed without device testing during the same procedure all cases were performed under local anaesthesia with conscious sedation.
Device testing
Device testing was performed under general anaesthesia with ventricular fibrillation induced either by a synchronized T-wave shock or a 50 Hz burst. Implantable cardioverter defibrillator shocks were programmed starting at half full output and if successful at this energy no further tests were performed. If unsuccessful, further testing was performed with a 10J safety margin aiming for a minimum of two successful tests at this safety margin.
Data collection and definitions
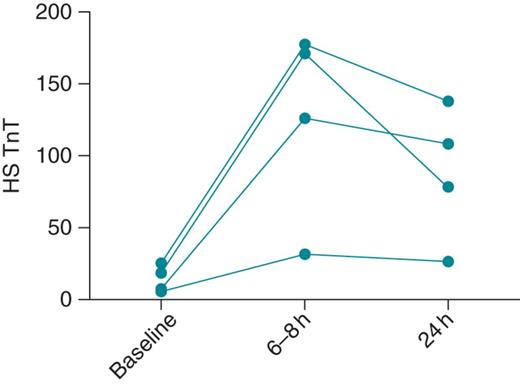
Pilot data showing change in high sensitivity troponin T (hs-TnT; ng/L) level in four patients after implantation and device testing. Values are shown prior to implantation (baseline), and 6–8 h and 24 h after completion of the implant and testing procedure. In all four subjects, there was a significant rise in hs-TnT at 6–8 h, with no further increase seen at 24 h.
A 12 lead ECG was recorded at the start of the procedure, and then repeated at 30 s, 5 min and 10 min intervals after both final right ventricle (RV) lead deployment and after device testing. We noted any new ST-segment deviation ≥ 0.1 mV compared with baseline measurements present in at least two ECG leads or T-wave inversion ≥ 0.1 mV in amplitude present in at least two ECG leads.
High-sensitivity troponin T assay
High sensitivity troponin T was measured in ethylenediaminetetraacetic acid plasma samples using the Cobas CE modular system (Roche Diagnostics); the level of detection is 5 ng/L and the 99th percentile 14 ng/L, with a 5% coefficient of variation at 13 ng/L.
Statistical analysis
Values given are median (interquartile range) unless stated otherwise. Change in hs-TnT was compared between baseline and 6–8 h post procedure for each group using Wilcoxon Signed Rank Test. Correlations between hs-TnT levels and number of lead deployments, number of tests, and energy delivered were examined using Spearmen correlation. Statistical tests were performed using SPSS 20.0 (IBM).
Results
The study population consisted of 32 patients who underwent a total of 34 procedures. Two patients undergoing device implantation alone also received subsequent device testing. There were 13 patients in the implant group, 10 in the implant and testing group, and 11 in the testing group. There were no significant differences in demographic characteristics between the three groups (Table 1). One patient in the implant and testing group was excluded from the study as test shocks failed, and transthoracic defibrillation was required.
Patient characteristics
| Implant (n = 13) | Implant and test (n = 10) | Test (n = 11) | P value | |
|---|---|---|---|---|
| Age | 60 (58–70) | 59 (47–70) | 56 (47–63) | 0.33 |
| Male gender | 11 (85%) | 7 (70%) | 8 (73%) | 0.98 |
| Secondary prevention | 8 (62%) | 6 (60%) | 7 (64%) | 0.79 |
| LVEF | 30 (25–52) | 33 (28–53) | 31(20–64) | 0.92 |
| LVEF <35% | 9 (70%) | 6 (60%) | 6 (55%) | 0.78 |
| Baseline hs-TnT | 16 (10–31) | 14 (6–22) | 26 (8–74) | 0.13 |
| Baseline hs-TnT >14 ng/L | 8 (62%) | 5 (50%) | 7 (64%) | 0.79 |
Hs-TnT, high sensitivity troponin T; LVEF, left ventricular ejection fraction.
Procedural characteristics are shown in Table 2. In the implant group, five patients had the ventricular lead deployed in more than one position, with a maximum of five different positions in one patient. In the implant and testing group, seven patients had more than one lead deployment, with a maximum of four positions in one patient. Three patients in the implant and testing group and two in the implant group also had atrial leads implanted. One patient in the implant and testing group had more than one shock, receiving three shocks in total. In the testing only group, two patients received two shocks each, with the remaining patients all receiving a single shock only. In the testing only group, testing was performed a median of 95 days (interquartile range 81–113 days) following implantation, and no patient underwent testing within 2 weeks of initial implantation.
Implant and testing details
| Implant (n = 13) | Implant and test (n = 10) | Test (n = 11) | P value | |
|---|---|---|---|---|
| Number of ventricular lead positions | 1 (1–2) | 2 (1–3) | – | 0.50 |
| Number of tests | – | 1 (1–1) | 1 (1–1) | 0.22 |
| Highest energy shock J | – | 20 (19–20) | 18 (18–21) | 0.72 |
| Cumulative energy J | – | 20 (19–20) | 18 (18–21) | 0.74 |
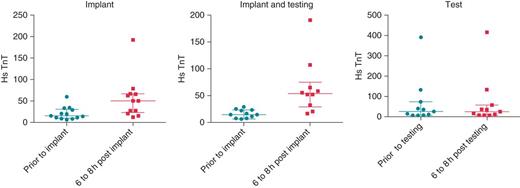
High sensitivity troponin T (hs-TnT; ng/L) levels at baseline and 6–8 h following the procedure are given from left to right for the implant only group, the implant and testing group and testing alone groups. The bars represent median and interquartile range. In the implant group, there was a 96% increase in median hs-TnT at 6–8 h (P = 0.002), in the implant and testing group there was a 161% increase in median hs-TnT at 6–8 h (P = 0.005), and in the testing only group there was no change in the median hs-TnT at 6–8 h (P = 0.90).
There was a significant correlation between the number of ventricular deployments and the percentage change in hs-TnT in the implant and implant plus testing groups combined (r = −0.51, P = 0.01), but no correlation between either the number of shocks (r = 0.26, P = 0.25) or the total delivered energy (r = 0.24, P = 0.30) and percentage change in hs-TnT in these two groups combined.
Only four patients showed ECG changes following testing. In one case, ST-segment elevation was seen 30 s post defibrillation. This was a patient in the testing only group, the ST-segment elevation resolved within 5 min and there was no change in hs-TnT at 6–8 h in this patient. New T-wave inversion was noted in two patients in the implant and testing group. In both cases, T-wave inversion occurred following RV lead deployment, and remained present following device testing. There were no ST-segment changes or T-wave changes observed in the implant group.
Discussion
This prospective observational study is the first to separate the effects of ICD testing from implantation. Implantation alone and implantation plus testing was associated with an increase in hs-TnT in almost all patients at 6–8 h. The proportionate increase in hs-TnT was correlated with the number of ventricular lead positions. In patients undergoing device testing alone there were no patients with an increase in hs-TnT levels at 6–8 h. ECG changes following implantation and testing were uncommon, and were not correlated with hs-TnT elevation.
Testing removed from implantation did not cause a change in hs-TnT levels in any of the subjects enrolled in our study. This is despite the fact that the fourth-generation hs-TnT assay used was far more sensitive than previous generations of cardiac troponin (cTn) assays,11 and was therefore sensitive to smaller levels of change than would previously have been detectable. It should be noted that most patients received only a single shock, and that this was between 17J and 21J, so lower than the maximum output of the ICDs. A study examining the effects of defibrillation shocks delivered with internal paddles following cardiac surgery found no difference in cTnI levels in those receiving shocks compared with those not undergoing defibrillation,12 consistent with our finding that isolated shocks themselves may not be causing cTn release.
Our finding is at odds with the widely held view that ICD testing does cause cTn release.13–15 This view is based on a small number of studies that have examined cTn levels following device implantation and defibrillation testing5,6,16,17 and studies demonstrating that spontaneous ICD shocks can be associated with cTn elevation.16,18 The difficulty with the previous studies of implantation is that they have not separated lead deployment from device testing. In our study, lead deployment alone was associated with an increase in hs-TnT in the majority of patients. Consistent with this observation, studies of pacemaker implantation have shown that lead deployment (particularly active fixation leads) was associated with cTn elevation.4,9,10
The largest previous study of ICD testing was conducted by Hurst et al.5 and reported that 7 of 49 patients had cTnI above their predefined threshold for elevation following implantation and testing. Patients with elevated cTnI in that study had received significantly more shocks (mean of 10) and more lead deployments (mean of 3) than those without cTnI elevation. We cannot exclude the possibility that multiple shocks produce a cumulative effect, but equally the number of lead deployments may explain these results as our data showed a correlation between lead deployment and hs-TnT levels.
Davoodi et al.4 have argued that ICD implantation and testing is associated with a greater rise in cTn than pacemaker implantation, attributing the difference to the delivery of shocks during testing. However, in this study the number of times leads were deployed was not reported, and there was also no attempt to correct for the significant differences in cardiac disease between the two groups.
We observed only one case of ST-segment elevation following an ICD shock in this study. In contrast, Gurevitz et al.8 in a study of 28 patients (average 4.4 shocks each), where ST deviation was reported following 39% of all shocks. There was no report of number of ventricular lead positions used or the time interval between lead deployment and testing in this study. This is the only study we are aware of to have previously report ECG changes following shock testing, although changes in intra-cardiac electrograms have been reported, and appear predictive of future heart failure events.19
While we have not seen evidence of cTn release following shocks, this does not exclude other forms of myocardial dysfunction following delivery of shocks. Transient decreases in mechanical performance have been reported in the absence of changes in cardiac biomarkers and new cardiac rhythm disturbances have been reported following induction of VF and shock delivery.20
Our study is a small observational study between three groups of patients. Because there was no randomization, we cannot exclude the possibility that there may have been confounding factors that contributed to our findings. However, the patient groups were well matched, and logistical (availability of anaesthetic cover) rather than clinical factors determined the population of each group. As discussed above, the number of shocks delivered was low, and they were not at maximum energy levels. Therefore, we cannot exclude the possibility that higher energy shocks or greater cumulative delivered energy may cause myocardial injury. This study has not evaluated the benefits of testing vs. not testing ICDs. There are two randomized controlled trials addressing this issue,21,22 and while neither has published full results, the data from the SIMPLE trial22 presented at Heart Rhythm Scientific Sessions 2014 as a late breaking clinical trial suggests that testing may not add any clinical benefit.
In conclusion, while implantation of ICD leads was associated with release of troponin, we did not find any evidence that ICD shocks alone cause myocardial injury. Our observation suggests that previous studies of concurrent implantation and testing should not be considered evidence that defibrillation shocks are causing myocardial damage.
