


Abstract
Absent left atrium (LA) mechanical contraction may occur following the modified Cox-maze operation, and was found to impose a potential risk for the occurrence of thrombo-embolic stroke. It is unknown whether certain morphological P-wave characteristics can surrogate absent LA mechanical activity. The aim of this study was to evaluate the morphological features of the P-waves on the surface electrocardiogram (ECG) of patients who underwent the maze operation and to relate them to the contractile profile of the LA.
Electrocardiogram tracings of 150 consecutive patients that were in sustained sinus rhythm following the maze operation were evaluated. P-waves were scrutinized for morphology, duration, axis, and amplitude. Clinical, surgery-related, and echocardiographic data were collected and analysed. Forty-seven patients (31%) had no evidence of LA contraction at 3 months after surgery (baseline assessment) and on follow-up echocardiography. Multivariate analysis showed that a positive-only P-wave deflection at lead V1 (P = 0.03), a negative-only deflection at aVL, and a P-wave amplitude of ≤0.05 mV at the septal-anterior leads (P < 0.001 for both) were associated with absent LA mechanical contraction. In a secondary analysis, a risk score involving the above three parameters was developed for the prediction of stroke occurrence. Patients at the high-risk score group had a 30% survival freedom of stroke compared with 70% for patients at intermediate risk (P < 0.001).
Absent LA mechanical contraction following the modified maze operation may be accompanied by a distinguished pattern of the P-waves on the surface ECG.
Left atrial standstill following the modified maze operation is not uncommon, and has been shown to be associated with occurrence of thrombo-embolic strokes. Left atrial contractile pattern can be evaluated by using standard echocardiographic techniques.
The P-waves on the surface electrocardiograms (ECGs) represent the pattern of atrial electrical activation. We report that lack of mechanical atrial contraction is associated with specific P-waves morphological features on the surface ECG.
These features include a positive-only deflection at V1, a negative-only deflection at aVL, and P-wave amplitude of ≤0.05 mV at the septal-anterior leads.
When combined together into a risk score, these parameters were also found to be associated with the occurrence of strokes of thrombo-embolic origin at follow-up.
These findings contribute to the understanding of the complex relationships between the mechanical and the electrical activation of the left atrium following the modified maze operation.
Introduction
The left atrial (LA) contractile function contributes to the overall left ventricular performance via its so called ‘booster’ effect during diastolic filling, a contribution that may be of high haemodynamic importance for patients with impaired diastolic function of the left ventricle. Several previous studies have shown that the LA may not regain its contractile function following the performance of the maze procedure for patients with atrial fibrillation (AF) undergoing cardiac surgery.1,2 As recently reported by our group, lack of LA mechanical contraction (LAMC), along with very large LA size following a ‘modified’ Cox maze III procedure as diagnosed during a routine echocardiography examination, may pose significant risk for subsequent cerebral thrombo-embolic events.3
The electrical activation patterns of both the right and LA are readily represented by the P-waves on the surface electrocardiogram (ECG), and may become modified following the maze operation, ablation procedures, or cardioversion of AF.4–7 However, a clear relation between the P-wave morphology and LAMC has not been previously established. The aim of this study was to determine whether lack of LAMC following the maze procedure may be characterized on the surface ECG by certain P-wave morphological features.
Methods
Study population and data collection
Data were collected from 236 consecutive patients who underwent the modified maze procedure in our institution, using a combination of radiofrequency and cryoablation lesions8 from February 2004 to November 2009. The lesion set utilized at the time of the operation was consistent in all study patients, and involved incision in the interatrial groove, isolation of the right pulmonary veins via a unilateral ablation line, encirclement of the left pulmonary veins and subsequent line connection between both islands of pulmonary veins, ablation lines from the ablation line isolating the left pulmonary vein to the base of the LA appendage amputation site and to the posterior MV annulus, and an ablation line drawn on the right-sided aspect of the interatrial septum up to the caudal aspect of the opening of the coronary sinus extended to the inferior vena. The procedures were performed using a combination of radiofrequency and cryoablation lesions. In 95% of the patients, the LA appendage was removed and the stump ligated.
Clinic-based outpatient follow-up included a complete physical examination, review of hospitalization records after the index surgery (if existed), 12-lead ECG, and a 24 h Holter monitoring. A detailed echocardiogram was obtained immediately following surgery, at 3 and 12 months after the surgery and annually thereafter. Electrocardiogram tracings were obtained immediately after surgery, every 3 months during the first post-operative year, and annually thereafter. Twenty four or 48 h Holter studies were obtained at 3- and 12-month period after the operation. All available clinical data from visits not performed in our institute, including ECG and Holter exams, were obtained.
Patients were included in this current analysis if: (i) sinus rhythm without conduction disorders that required pacemaker implantation was documented beginning in the first post-surgery clinic visit and throughout follow-up; (ii) at least one detailed pre-operative and two follow-up echocardiographic examinations, as well as three post-operative ECG tracings were available; (iii) there was no electrocardiographic or clinical evidence of AF or other atrial tachycardias in all follow-up ECG's, Holter exams, and patient interviews and (iv) all demographic and clinical data were available.
Of the entire maze-operated cohort, 158 (67%) patients had no evidence of AF or other atrial tachyarrhythmias throughout the follow-up period, while 33% developed atrial arrhythmias or AF during follow-up. Eight patients (all foreign countries residents) were lost to follow-up, leaving 150 patients to be included in the current analysis. Antiarrhythmic agents (exclusive beta blockers) were discontinued at the 3-month post-operative clinic visit and not renewed in all patients who maintained sinus rhythm. Of the 78 patients who developed atrial arrhythmia at follow-up, 28 had normal sinus rhythm at the baseline 3-month visit; of these 28 patients, 20 developed atrial arrhythmia in the 6-month post-surgical period, and the remaining 8 developed it during the 9-month post-surgical period. The median follow-up time for the entire study population was 18 months (range: 7–39 months).
The study was approved by the Institutional Review Board.
Electrocardiogram analysis and echocardiographic methods
All 150 patients that comprised the study cohort were at AF rhythm prior to surgery. At least three ECG tracings were performed during the follow-up period for the entire cohort. All available tracings were evaluated for the current analysis. Standard 12-lead ECG tracings were distinctly evaluated with the aid of an electronic magnifier by two independent readers (J.B. and A.G.). In case of disagreement between the readers, adjudication by a third reader was performed. The tracings were analysed to determine the cardiac rhythm and the following parameters: PR interval, P-wave duration, axis, amplitude, and morphology in all leads. Following the P-wave amplitude analysis in all leads, a subdivision into three anatomical regions was performed: the septal-anterior region (consisting of leadsV1–4), inferior region (leads II, III, aVF), and lateral region (leads I, aVL, V5–6). In each of these regions, the average P-wave amplitude was calculated and used for the analysis. In the case that the P-wave morphology consisted of a negative deflection only, this deflection was used for the calculation of the average value, and in the case of a biphasic deflection, the absolute sum of the deflections were added and used for the analysis.4,9 P-wave morphology was divided into four patterns: positive (+), negative (−), positive followed by a negative deflection (+, −), and a negative followed by a positive deflection (−, +). The investigators were not aware of the echocardiographic LAMC profile at the time of the readings. Echocardiography was performed using commercially available systems (Philips IE 33); VIVID 7 (General Electric); VIVID I (General Electric); or Sonos 7500 (Hewlett Packard) and revised by an experienced echocardiographist (R.K.). Measurements and evaluation of the LA size and function were made according to the American Society of Echocardiography recommendations for chamber quantification10 as previously reported.3 The absence of A wave on the tracings was considered as the absence of mechanical atrial contraction. All patients were in sinus rhythm during the echocardiographic examinations. Left atrial volume (LAV) was measured using the Simpson's method from the four chamber apical view, corrected for the body surface area (LAV index or LAVI), and divided into quartiles at the post-surgical measurements—≤21 mL/m2, 21.1 ≤ LAVI ≤ 27, 27.1 ≤ LAV ≤ 32.9, and ≥33 mL/m2.
Left atrial mechanical contraction assessment by P-wave characteristics
The electrocardiographic parameters that were examined were evaluated for their relationships with the LAMC profile on echocardiography. In a secondary analysis, P-wave parameters were also evaluated for relation with LAVI and with the clinical outcome of the occurrence of ischaemic stroke suspected to be of thrombo-embolic origin at any time during follow-up.
The P-wave parameters were consistent in all tracings obtained, beginning from the tracing obtained 3 months after the surgery (time 0), except for the amplitude in the three anatomical area. In the case of variability in the P-wave amplitudes, the tracing performed at the closest calendar proximity to the final echocardiographic examination was used for interpretation. Echocardiographic parameters used for analyses were obtained at the baseline time 0 studies and each study thereafter. The presence or absence of LAMC was consistent in all readings. P-wave amplitude in the three anatomical areas was dichotomized at the upper and at the lower quartile, and compared with the three lower and upper quartiles, respectively, for our primary analysis.
Statistical analysis
The clinical and electrocardiographic P-wave characteristics of study subjects stratified by the presence or absence of LAMC, by upper quartile LAVI, and by the occurrence of stroke were compared using χ2 tests for categorical variables and t-tests or Mann–Whitney–Wilcoxon tests for continuous variables.
Identification of electrocardiographic parameters associated with lack of left atrial mechanical contraction
We included 12 potential ECG risk factors (presented in Table 2) for the model that assessed the relation between ECG factors and lack of LAMC. Thresholds for categorization of numerical variables were pre-specified utilizing accepted ECG criteria. Univariate relationships between candidate covariates and lack of LAMC (as defined above) were assessed by t-tests (χ2 for binary responses). The covariates with P values <0.20 were further evaluated by carrying out a best-subset logistic regression analysis, examining the models created from all possible combinations of ECG predictor variables, and using a penalty of 3.84 on the likelihood ratio χ2 value for any additional factor included (corresponds to a P value of 5% for one df χ2 test).
Development of electrocardiogram score for lack of left atrial mechanical contraction
After selection of binary covariates, each was assigned a numerical value based on the relative value of its logistic regression coefficient in the multivariate logistic regression model (specifically, the ECG factor with the lowest logistic regression coefficient among the three factors in the model was assigned a numerical value of 1, and the other two factors were assigned numerical values based on the relative values of their logistic regression coefficients to that of the lowest value). An ECG score was constructed in each patient by adding the assigned numerical values of the factors identified in each patient, and the study population was categorized based on the distribution of the ECG score (assessed as an ordinal measure) among patients.
Relation of electrocardiogram score to clinical outcomes during follow-up
Kaplan–Meier estimates for stroke by ECG score counts were determined and statistically evaluated with the log-rank test. Cox proportional hazards regression analyses were carried out in the total population for the assessment of the risk of stroke by ECG score counts. The two additional covariates that were included in the model were the LA indexed volume and the CHA2Ds2-VASc score. Each covariate was first assessed separately using univariate analysis. All three had P values ≥0.10.
All P values were two-sided and a P value <0.05 was considered significant. Analyses were performed with the use of SAS software (version 9.20).
Results
Forty-seven patients (31%) had no evidence of LAMC at the echocardiographic assessment performed 3 months after the index surgery. Follow-up ECGs obtained at 12 months and yearly thereafter showed consistent findings. Similarly, consistent P-wave-related ECG findings existed for the patients in both groups (LAMC present/absent) in all the tracings that were obtained during follow-up, excluding the P-wave amplitudes as noted above.
Baseline characteristics of the study patients stratified by the presence of LAMC are presented in Table 1. Median follow-up periods were similar for the two groups. Left atrial maze was performed in 121 (81%) of the patients, whereas biatrial maze was performed in the remaining patients. Six cases (4%) were standalone maze. Both LAMC contractile profiles existed in a similar proportion among patients who underwent the biatrial maze procedure. P-wave parameters stratified by LAMC are presented in Table 2. The P-waves and the PR segments were more frequently prolonged (>120 and >200 ms, respectively) in the preserved LAMC group. There was a trend of P-wave duration shortening as time elapsed from the index procedure that did not reach statistical significance between the groups: median P-wave duration for the entire study population was 125 ms, and decreased to a median of 112 ms 6 months following the procedure (data not shown). Seventy-seven patients (51% of the entire study population) had a detectable variability in the amplitude of the P-waves at repeated assessment of the 6-month post-operative ECG tracings, 56 patients (36% of the entire study population) had a detectable variability detected at the 9-month post-operative ECG tracings, and 29 patients (19% of the entire study population) had a variability detected at the 12-month post-operative ECG tracings. Detectable variability was defined as a change of >0.01 mV in the P-wave amplitude. The median change in the P-wave amplitude at follow-up tracings was 0.02 mV at the tracings obtained 6 months after the procedure and 0.01 mV at the tracings obtained 9 months and 1 year after the procedure.
Baseline characteristics of the study patients by LAMC
| Variable | LAMC absent (n = 47) | LAMC present (n = 103) | P value |
|---|---|---|---|
| Age at surgery | 62 ± 12 | 63 ± 11 | 0.88 |
| Female | 30 (64%) | 41 (40%) | <0.01 |
| Body mass index | 27 ± 5 | 28 ± 5 | 0.67 |
| Clinical variables | |||
| CHA2DS2-VASc score ≥2 | 31 (66%) | 57 (55%) | 0.22 |
| Hypertension | 29 (61%) | 65 (64%) | 0.81 |
| Diabetes | 12 (25%) | 20 (19%) | 0.41 |
| Congestive heart failure | 0 | 5 (5%) | 0.09 |
| Peripheral arterial disease | 9 (19%) | 21 (20%) | 0.83 |
| Prior stroke | 2 (5%) | 4 (4%) | 0.91 |
| Atrial fibrillation type | 0.17 | ||
| Paroxysmal | 9 (19%) | 22 (21%) | |
| Persistent | 16 (34%) | 32 (31%) | |
| Permanent | 22 (47%) | 48 (47%) | |
| Beta-blocker treatment | 12 (25%) | 30 (29%) | 0.73 |
| Echocardiographic parameters | |||
| Post-surgery LA volume index | 29 ± 13 | 28 ± 10 | 0.40 |
| Post-surgery LA volume index ≥35 mL/m2 | 13 (27%) | 19 (18%) | 0.20 |
| LA diameter after surgery (cm) | 4.7 ± 0.6 | 4.5 ± 0.7 | 0.07 |
| LA appendage removed | 44 (93%) | 99 (96%) | 0.50 |
| Left ventricular ejection fraction (%) after surgery | 56 ± 7 | 56 ± 7 | 0.95 |
| Left ventricular ejection fraction ≤35% after surgery | 1 (2%) | 3 (3%) | 0.78 |
| Surgery-associated parameters | |||
| CABG during surgery, n | 9 (19%) | 21 (20%) | 0.86 |
| Mechanical prosthetic valve implantation | 11 (23%) | 30 (29%) | 0.85 |
| Bioprosthetic valve implantation | 27 (54%) | 46 (44%) | |
| Maze-only, n (%) | 0 | 6 (6%) | 0.09 |
| Left atrial maze only | 37 (78%) | 84 (81%) | 0.68 |
| Months from surgery to last echocardiogram | 12 (6–22) | 12 (5–26) | 0.81 |
| Total follow-up in months | 17 (10–37) | 19 (7–39) | 0.61 |
Values mean ± SD, n (%), or median (IQR). Percents may not total 100%, because of rounding.
AF, atrial fibrillation; CABG, coronary artery bypass grafting; CHA2DS2-VASc, congestive heart failure, hypertension, age ≥75 years, diabetes mellitus, stroke or transient ischaemic attack, vascular disease, age 65–74 years, and sex category (female); LA, left atrial; LAA, left atrial appendage; LAMC, left atrial mechanical contraction; LAVI, left atrial volume index.
P-wave parameters at surface ECGs by LAMC
| Variable | LAMC absent (n = 47) | LAMC present (n = 103) | P value |
|---|---|---|---|
| PR interval >200 ms | 26 (55) | 76 (74) | 0.02 |
| P-wave duration >120 ms | 25 (53) | 75 (73) | 0.02 |
| P-wave duration in ms, median (interquartile range) | 112 (95–132) | 125 (105–140) | 0.08 |
| Abnormal P-wave axisa | 18 (38) | 36 (35) | 0.72 |
| P-wave morphology at V1 | |||
| Positive | 37 (78) | 26 (25) | <0.001 |
| Negative | 1 (2) | 3 (3) | 0.78 |
| +, − | 9 (19) | 74 (72) | <0.001 |
| −, + | 0 | 0 | N/A |
| P-wave morphology at II | |||
| Positive | 28 (59) | 26 (25) | <0.001 |
| Negative | 0 | 0 | N/A |
| +, − | 19 (40) | 70 (68) | <0.001 |
| −, + | 0 | 7 (7) | 0.07 |
| P-wave morphology at III | |||
| Positive | 27 (58) | 24 (23) | <0.001 |
| Negative | 0 | 5 (5) | 0.09 |
| +, − | 18 (38) | 68 (66) | <0.001 |
| −, + | 2 (4) | 6 (6) | 0.52 |
| P-wave morphology at aVF | |||
| Positive | 28 (59) | 27 (26) | <0.001 |
| Negative | 1 (2) | 0 (0) | N/A |
| +, − | 27 (38) | 75 (73) | <0.001 |
| −, + | 1 (2) | 1 (1) | N/A |
| P-wave morphology at aVL | |||
| Positive | 5 (10) | 12 (12) | 0.87 |
| Negative | 33 (70) | 17 (16) | <0.001 |
| +, − | 0 | 0 | N/A |
| −, + | 9 (19) | 74 (72) | <0.001 |
| P-wave morphology at aVR | |||
| Positive | 6 (13) | 15 (15) | 0.86 |
| Negative | 19 (40) | 41 (40) | 1.0 |
| +, − | 0 | 0 | N/A |
| −, + | 22 (47) | 46 (45) | 0.89 |
| P-wave amplitude septal-anterior leadsb | |||
| Upper quartile: ≥0.25 mV | 6 (12) | 59 (57) | <0.001 |
| Lower quartile: ≤0.05 mV | 23 (50) | 8 (8) | <0.001 |
| P-wave amplitude inferior leadsb | |||
| Upper quartile: ≥0.15 mV | 3 (6) | 5 (5) | 0.90 |
| Lower quartile: ≤0.03 mV | 22 (48) | 15 (15) | 0.007 |
| P-wave amplitude lateral leadsb | |||
| Upper quartile: ≥0.10 mV | 3 (6) | 13 (12) | 0.25 |
| Lower quartile: ≤0.02 mV | 33 (70) | 46 (45) | 0.005 |
Values are n (%). Percents may not total 100%, because of rounding.
aDefined as <0°–75°.
bSeptal-antrior leads are V1–4, inferior leads are II, III, aVF, lateral leads are V5, 6, I, aVL, amplitude measurement was obtained by adding the positive and the negative components in leads with positive–negative P-wave morphology. (−, +), negative–positive morphology; (+, −), positive–negative morphology.
An abnormal P-wave axis (defined as either leftward or rightward of 0°–75°) existed to similar degree between patients in both groups. The median P-wave amplitude in the entire study cohort was largest in the anterior leads [0.1 mV, interquartile range (IQR) 0.05–0.25], followed by the inferior leads (median, 0.05 mV, IQR 0.03–0.15), and the lateral leads (median, 0.03 mV, IQR 0.02–0.1).
P-wave parameters, left atrial activity and left atrial volume
As shown in Table 2, significant differences existed between the groups in terms of both amplitude and morphology of the P-waves at the different pre-defined anatomical areas. Patients with absent LAMC more frequently had a positive-only deflection of the P-waves at V1 (78 vs. 25%, P < 0.001), as well as at leads II, II, and aVF (P < 0.001 for all three leads). In addition, a negative deflection-only morphology at aVL existed more frequently for this group (70 vs. 16%, P < 0.001). Conversely, patients with preserved LAMC more frequently had a negative–positive morphology at aVL (72 vs. 19%, P < 0.001) and a positive–negative morphology at V1 and II, III, aVF (P < 0.001 for all four leads, Table 2, Figure 1).
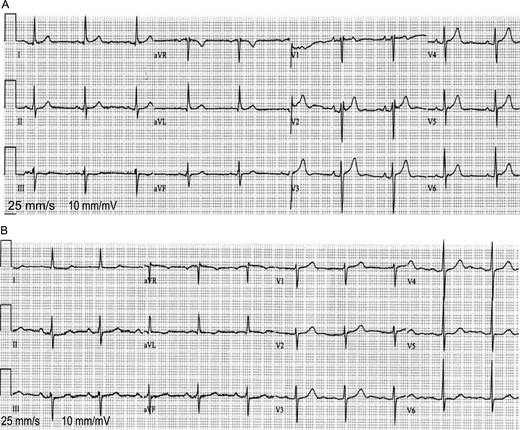
(A and B) ECG tracings from two of the study patients: a patient with absent LAMC (A) and a patient with intact LAMC (B). Patients with absent LAMC had more frequently small P-wave amplitude at V1–4, a positive-only deflection at V1, and a negative-only deflection at aVL compared with patients with intact LAMC.
Lower-quartile (i.e. ≤0.05 mV) average
P-wave amplitude at the septal-anterior leads was more frequent among patients with absent LAMC compared with the group of patients with preserved LAMC (50 vs. 8%, P < 0.001), as well as at the inferior (≤0.03 mV) and the lateral (≤0.02 mV) leads (P = 0.007 and P = 0.005, respectively). In a multivariate Cox analysis performed, three parameters were found to be independently associated with absent LAMC (Table 3): positive-only P-wave morphology at V1 [odds ratio (OR): 2.4; 95% confidence interval (CI): 1.21–5.60; P = 0.03), negative-only P-wave morphology at aVL (OR: 7.14; 95% CI: 2.50–18, P < 0.001), and average P-wave amplitude ≤0.05 mV (lower quartile value) amplitude at the septal-anterior leads (OR: 7.50; 95% CI: 3.12–19; P < 0.001). The sensitivity, specificity, and predictive values for each of these three parameters were evaluated, as well as the combination of all three (Table 4). A positive-only morphology at V1 showed the highest sensitivity and negative predictive value (NPV, 78.7 and 88.5%, respectively), while average P-wave amplitude ≤0.05 mV at the sepatal-anterior leads showed the highest specificity and positive predictive value (PPV, 94 and 74.2%, respectively). For the combination of the three parameters, the sensitivity was 75%, specificity 81.5%, PPV 67%, and the NPV was 87.5%.
Multivariate analysis: P-wave parameters on the surface ECG and absent LAMCa
| P-wave covariate | Odds ratio | 95% CI | P value |
|---|---|---|---|
| Positive-only at V1 | 2.40 | 1.21–5.60 | 0.03 |
| Negative-only at aVL | 7.14 | 2.50–18 | <0.001 |
| Lower-quartile amplitude septal-anterior leads | 7.50 | 3.12–19 | <0.001 |
| P-wave covariate | Odds ratio | 95% CI | P value |
|---|---|---|---|
| Positive-only at V1 | 2.40 | 1.21–5.60 | 0.03 |
| Negative-only at aVL | 7.14 | 2.50–18 | <0.001 |
| Lower-quartile amplitude septal-anterior leads | 7.50 | 3.12–19 | <0.001 |
aFurther adjusted for the P-wave duration >120 ms, performance of a biatrial maze operation, positive-only morphology at II, at III, at aVF, lower-quartile amplitude at the inferior leads and at the lateral leads.
CI, confidence interval.
Sensitivity, specificity, and predictive values of the independent P-wave parameters associated with absent LAMC
| Parameter | Sensitivity (%) | Specificity (%) | Positive predictive value (%) | Negative predictive value (%) |
|---|---|---|---|---|
| Positive-only at V1 | 78.7 | 74.7 | 58.7 | 88.5 |
| Amplitude ≥0.05 mV at septal-anterior leadsa | 50 | 92 | 74.2 | 80.5 |
| Negative-only at aVL | 70 | 84.5 | 67 | 86 |
| All three parameters | 74 | 81.5 | 67 | 87.5 |
aAmplitude measurement was obtained by adding the positive and the negative components in leads with positive–negative P-wave morphology.
In the analysis performed to evaluate for association between the various P-wave parameters and LAVI, no statistically significant associations were established (P> 0.1 for all parameters evaluated, data not shown). We also evaluated for an association between the type of maze procedure performed (i.e. biatrial vs. LA maze only) and of the various P-wave parameters. As compared with LA maze only, biatrial maze was associated with more frequent lower-quartile amplitude of the P-waves at all anatomical regions (P = 0.04 for the septal-anterior region, P = 0.02 for both inferior and lateral regions). In addition, a significantly lower proportion of patients who underwent a biatrial maze had a P-wave duration >120 ms and a PR interval >200 ms (P < 0.01 for both).
P-wave parameters and the occurrence of ischaemic stroke
Fifteen patients (10% of the entire study population) experienced ischaemic strokes during follow-up, while no haemorrhagic strokes occurred. Ten patients without LAMC (21%) had strokes, compared with five (5%) with preserved LAMC. As previously reported,3 absent LAMC was associated with a nearly 5-fold (P = 0.02) increase in the risk for stroke for the entire study population and with a 4.1-fold (P = 0.04) increase in risk for patients not on anticoagulation treatment. In a secondary comparative analysis aimed to evaluate the association between P-wave parameters and the occurrence of thrombo-embolic stroke, a terminal positive deflection at aVL existed less frequently in patients who had a stroke (33 vs. 62%, P = 0.03, data not shown), while a positive-only morphology at lead V1 was more frequent in this group (47 vs. 22%, P = 0.05). No further parameters were found to be associated with an increased risk of stroke (P> 0.1 for all amplitudes and morphologies, data not shown), and no association between the type of maze procedure and stroke was observed (P = 0.77).
Based on the results of the multivariate model performed for the association between the P-wave parameters and LAMC profile, we developed a scoring system to predict freedom from stroke. In accordance with the OR values established at the multivariate model, each parameter was attributed the following scoring points: average P-wave amplitude ≤0.05 mV at the septal-antrior leads and a negative-only deflection at aVL: 2 points each; positive-only deflection at V1: 1 point. As shown in Figure 2, the event-free survival curve for stroke was 100% for patients with 0 risk points, 70% for patients with 1–3 risk points, and 30% for patients with 4–5 risk points (P log-rank <0.001). Multivariate Cox proportional hazards regression analysis showed that after adjusting to the LAVI and CHA2DS2-VASc score, the presence of 4–5 risk points on the ECG was independently associated with a 2.3 increase in the risk of stroke (95% CI, 1.01–5.7, P = 0.05, Table 5).
Multivariate analysis: the effect LA size, patients risk profile, and high-risk ECG features on the risk of stroke in study populationa
| Study population | Hazard ratio | 95% CI | P value |
|---|---|---|---|
| Entire study population (n = 150) | |||
| LAVI > 33 mL/m2 | 3.08 | 1.05–9.04 | 0.03 |
| High-risk ECG featuresb | 2.35 | 1.01–5.7 | 0.05 |
| Study population | Hazard ratio | 95% CI | P value |
|---|---|---|---|
| Entire study population (n = 150) | |||
| LAVI > 33 mL/m2 | 3.08 | 1.05–9.04 | 0.03 |
| High-risk ECG featuresb | 2.35 | 1.01–5.7 | 0.05 |
aFurther adjusted for CHA2DS2-VASc score >2.
bDefined as 4–5 risk points attributed by the ECG scoring system. See text for details.
LAVI, left atrial volume index; CI, confidence interval.
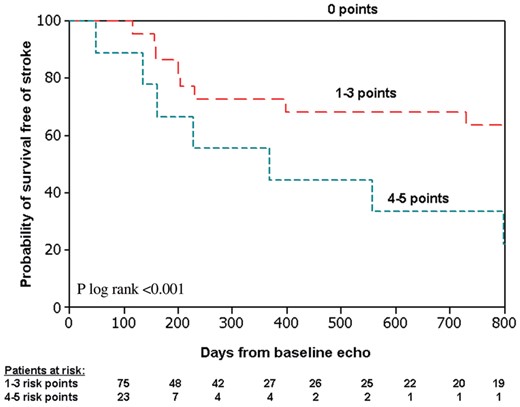
Kaplan–Meier estimates of the probability of survival free of stroke by the number of risk points in all study patients. ‘Baseline echo’ refers to the echocardiographic study performed 3 months after index surgery. See text for score calculation.
Finally, in a subanalysis aimed to evaluate the association between P-wave parameters and the occurrence of ischaemic stroke in the group with absent LAMC only, no statistically significant associations were established, possibly because this study was inadequately powered to detect such association due to the low number of events.
Discussion
Main findings
In this single-centre study, we aimed to assess the various P-wave changes on the surface ECG of patients who underwent the modified Cox-maze III procedure at surgery and to relate them to the contractile profile of the LA, to its size, and to the occurrence of ischaemic stroke at follow-up. Our main findings are that: (i) compared with patients with preserved LAMC, absent LAMC profile was characterized by three distinctive P-wave morphological features on the surface ECG: average P-wave amplitude ≤0.05 mV at the septal-anterior leads, positive-only morphology at V1, and a negative-only amplitude (as opposed to a negative–positive morphology) at aVL; (ii) in a risk score that was developed based on these three parameters, patients with a high number of risk points had only 30% freedom of stroke at follow-up as compared with a 70% freedom of stroke among patients with intermediate number of risk points and 100% freedom of stroke among patients with no risk points; and (iii) there was no statistically significant relationship between the LA size (expressed as LAVI) and the P-wave parameters on the ECG.
Activation patterns following the Cox-maze procedure, electrocardiographic findings and left atrial mechanical function
The morphology of the P-wave on the ECG is the end-result of a complex interplay between electrophysiological and anatomical–geometrical features of the atria through which the sinus beat travels. These considerations may become even more complex following the Cox-maze procedure, which obscures the electro-anatomical relationship in the atria due to the multiple lines of ablation.
The presence of a P-wave terminal deflection on the surface ECG's inferior leads indicates the presence of LA electrical activation, whether it is a positive terminal deflection as observed during normal sinus rhythm, or a negative deflection, as may be observed in the case of reverse conduction (i.e. in the caudo-cranial direction) due to blocked conduction at the level of the Bachman bundle.4,6,11–13 In our study cohort, a negative terminal deflection at the inferior leads occurred more frequently in patients with an preserved LAMC, whereas patients with absent LAMC more frequently lacked any terminal deflection at these leads, probably due to complete absence or a very delayed electrical conduction to the LA, leading to its lack of mechanical activation. Similarly, we assume that the absence of a positive deflection at lead aVL represents absent LAMC: a negative-positive morphology of the P-wave at aVL was reported to occur in patients after atrial compartment operation who had a delayed, yet preserved activation of the LA, while a negative-only P-wave morphology occurred more in patients with absent electrical conduction to the LA.4 The likely explanation for the positive-only deflection of the P-waves at V1 and absent LAMC is conduction in the posterior–anterior direction, possibly via posterior interatrial connections (rather than via Bachmann's bundle). In their study of P-wave morphology in patients with sinus rhythm before radiofrequency ablation of AF, Holmqvist et al. analysed unfiltered signal-averaged P-waves in LA activation mapping to determine orthogonal P-wave morphology. The authors reported a clear association between biphasic P-waves in the sagittal plane and anterior–posterior LA activation vector.14 It can thus be assumed that isolation of the LA will result in disappearance of the terminal negative phase of the P-waves. Similar observations were made by other investigators who studied LA activation patterns using various methods, from surface ECGs to high-density mapping of LA endocardial activation.15–17
The association between very low P-wave amplitude and either the mechanical or electrical profile of the LA has not been described before, and hence is a novel finding. Very small P-waves may represent inadequate electrical conduction within the atria, leading to its mechanical impaired or complete inactivity. We do not assume, however, that an association exists between P-wave amplitude and the actual LA size. In our study, as well as in previous studies,4,5,7 no such association has been established. The suggested explanation is that the LA ablation lines made during the operation lead to the low-amplitude morphology of the P-wave, thus dissociating its actual anatomical properties (i.e. its size) from the electrical ones.
In accordance with previous studies, our results indicate that the intra-atrial conduction becomes prolonged following the maze procedure, leading to prolongation of the P-wave without actual prolongation of the PR segment, since the area of the atrioventricular node is not involved in this procedure.4,5,7
In a study that described changes in P-wave morphology and dispersion following thoracoscopic surgery for AF, Nassif et al.18 described an initial increase in the duration, the area, and the dispersion of the P-waves after the procedure, followed by a gradual decrease to values below the baseline measurements. This pattern was at least partially attributed to reverse remodelling after restoration of sinus rhythm. The findings of our study come in some agreement with this observation, as the P-wave amplitude in our patient cohort also continued to decrease over time, yet there was no similar change in the duration of the P-waves. P-wave dispersion was not a part of our analysis.
P-wave morphology and the risk of ischaemic stroke
The rate of thrombo-embolic strokes was relatively high in this study, and the possible explanations were previously discussed.3 One theory is that the high stroke rates can be at least partially attributed to Coumadin discontinuation 3 months following the procedure, especially for patients with a mechanically inactive LA. In their long-term follow-up of a large cohort of patients who underwent the maze procedure, Weimar et al.19 report that Coumadin treatment was continued if patients had atrial tachyarrhythmias or an echocardiogram that showed atrial stasis or thrombus. As discussed previously by our group,3 such practice may indeed prove to be of high benefit in terms of protection from thrombo-embolic strokes.
Upon utilization of the risk score for the prediction of stroke proposed in this analysis, patients with a high number of risk points (i.e. 4–5) were found to be at an increased risk for stroke during follow-up. The presence of 4–5 risk points remained independently associated with this risk in a multivariable model that included the LA size and the CHA2DS2-VASc score. Kohsaka et al.20 described in a retrospective evaluation of 146 patients, who did not undergo cardiac surgery, that negative terminal deflection of the P-wave at lead V1 is associated with an increased risk of ischaemic stroke, regardless of the actual size of the LA. The results of our study indicate an association between negative terminal deflection pattern at V1 and preserved LAMC, whereas a positive-only deflection was more common among patients with absent LAMC, probably due to complete or very delayed electrical inactivation of the LA. It is likely that our study was inadequately powered to detect statistically significant relationships between a single P-wave morphological feature and the occurrence of stroke, given the low event number.
Limitations
This study was conducted at a single centre and the data retrospectively analysed. P-waves following the Cox-maze procedure may appear very small on the surface ECG, and sometimes even the usage of a magnifier may not suffice to determine the exact morphology. In our attempts to overcome this obstacle, we used the electronic magnifier. Right precordial leads (V3R–V6R) were not obtained for the study patients, and P-wave may appear larger and clearer in these leads. In the case of biphasic P-wave morphology on the surface ECG, P-waves amplitude was measured and reported by adding the positive and the negative components. Even though this method is of anatomical sense, it is novel and has not been officially utilized in prior similar studies. Thus, our results regarding P-wave amplitudes should be interpreted in the light of using this technique only. Electrophysiological studies were not performed in the study patients to establish the electrical conduction within the RA and the LA. The data derived from such studies could potentially have provided us with the exact electronic conduction pattern within the atria. Right atrial maze alone was not performed in any of the study patients, and such procedure might cause P-wave morphologies different from the ones described in this study. Asymptomatic AF could have occurred since AF recognition was based on symptoms and periodic Holter examinations. Recurrent AF events may by themselves alter the morphology of the P-waves during sinus rhythm. The association between a decreased, rather than absent, LA contractile profile and the P-wave morphology was not assessed in the current study. The overall number of ischaemic strokes was small, and so this study was possibly inadequately powered to identify interactions between P-wave covariates and the occurrence of stroke.
The follow-up protocol for the occurrence of atrial arrhythmias was developed prior to the publication of the HRS/EHRA/ECAS consensus document on catheter and surgical ablation of AF. However, the follow-up performed for this study's cohort is in good agreement with the follow-up protocol recommended in the consensus document, which suggests a follow-up ECG every 6 months in the first 2 years unless symptoms suggestive of AF necessitate more frequent assessment.21 Follow-up duration varied in the study population, ranging from 7 to 39 months, and later atrial arrhythmias could hypothetically occur for some of the shorter follow-up patients. However, we showed that the correlation between P-wave morphology and LAMC profile (the main aim of this study) was independent of the follow-up duration.
Conclusions
In this study, we identified three independent parameters of the P-waves on the ECG that accompanied the absence of the LAMC on the echocardiographic examination: a positive-only deflection at V1, a negative-only deflection (as opposed to a negative–positive morphology) at aVL, and low average amplitude (≤0.05 mV) of the P-waves at the septal-anterior leads. We assume that these morphological features are associated with either lack of or very delayed electrical conduction to the LA, and hence its mechanical standstill.
Our study adds to the understanding of the complex relations between the mechanical and the electrical properties of the LA in the presence of scar lesions performed at the maze procedure. Although we aimed to establish an association between the electrocardiographic parameters and clinical events, our report constitutes one of very few such attempts. Thus, more validated parameters for the evaluation of the LA performance and prediction of stroke should be utilized, at least until additional investigations in this relatively unexplored field will be undertaken.
Conflict of interest: none declared.
References
Author notes
These authors contributed equally to original concept and to authorship of this investigation.
