


Abstract
This study aimed to characterize P-wave morphology (PWM) in leads V3–V6 during focal atrial tachycardia (AT) originating from the lower right atrium (RA), and to investigate the role of interatrial conduction (IAC) pathways in the formation of PWM.
Twenty-eight consecutive patients with tachycardia foci in the lower RA underwent detailed atrial endocardial activation mapping and radiofrequency catheter ablation. P-wave configuration was analysed using standard 12-lead electrocardiogram. Atrial tachycardia originated from lower non-septal tricuspid annulus (LTA) (n = 11), coronary sinus ostium (CSo) (n = 11), lower crista terminalis (LCT) (n = 4), or lower free wall (n = 2). In leads V3–V6, PWM showed a negative pattern in at least two consecutive leads during AT originating from CSo (11/11) and LTA (9/11), with an associated sensitivity of 91%, specificity of 100%, positive predictive value (PPV) of 100%, and negative predictive value (NPV) of 75%. A positive PWM was observed in three of four ATs originating from LCT, with an associated sensitivity of 75%, specificity of 100%, PPV of 60%, and NPV of 96%. A negative PWM in V3–V6 was consistent with a preferential IAC through musculature in the vicinity of the CS and an activation of both atria in an antero-posterior direction. In contrast, a positive PWM was associated with the engagement of a posterior (non-CS-related) interatrial connection.
Characteristic PWMs in V3–V6 may accurately differentiate the anatomic sites of AT from the low RA with high PPVs and NPVs. P-wave morphology in V3–V6 is likely to be influenced by the engagement of the preferential IAC.
Characteristic P-wave morphology in the precordial leads V3–V6 can accurately differentiate the anatomic sites of atrial tachycardia origin with high positive and negative predictive values in patients with atrial tachycardias from lower right atrium.
Characteristic P-wave morphology in the precordial leads V3–V6 is likely to be influenced by the employment of preferential interatrial conduction pathways between right and left atria.
Introduction
Focal atrial tachycardias (ATs) originating from single atrial sites outside the sinus node are found to be the underlying mechanism in 5–15% of adults with paroxysmal supraventricular tachycardia.1 Foci responsible for focal AT tend to cluster at characteristic anatomical locations. The majority of focal AT stem from the right atrium (RA), with foci along the crista terminalis (CT) in over two-third of cases.2 Less frequently, the foci are at the tricuspid annulus (TA),3,4 the coronary sinus ostium (CSo),5 or the parahisian region.6,7
A thorough analysis of P-wave morphology (PWM) in 12-lead electrocardiogram (ECG) during AT is a key to the non-invasive identification of arrhythmic foci. Generally, as a first step, right- and left-sided origins are distinguished. Further, if an RA origin is suggested, positive P-waves in the inferior leads typically indicate AT from the middle or superior CT in over 90% of focal ATs with CT origins.2 Further ECG-based differential diagnosis of AT from the lower RA is difficult to perform. However, the PWM in ECG leads V3–V6 has not been sufficiently addressed in previous studies7 and may provide important additional information on the origin of the AT.
This study was performed to further establish ECG characteristics of focal AT originating from the lower RA. We hypothesized that the employment of the preferential interatrial conduction (IAC) pathways results in typical PWM in V3–V6. A number of factors may influence the PWM during AT originating from the RA such as: (i) activation sequence within the RA, (ii) preferential IAC pathways for activation from the RA to the left atrium (LA), and (iii) activation sequence of the LA.
Methods
Study population
Between October 2006 and April 2010, 144 consecutive patients underwent radiofrequency catheter ablation (RFCA) of focal AT with RA origins at our institution. In 28 (19%), a tachycardia with origin of lower RA was confirmed using three-dimensional (3D) electroanatomical (EA) activation mapping during the RFCA procedure. All patients had symptomatic tachycardias and proved refractory to at least one antiarrhythmic agent. All patients signed a written informed consent.
Electrophysiological study
Electrophysiological procedures were performed according to international standard routines using conventional equipment,8 and the tachycardia mechanism was defined by established criteria.9 The mode of tachycardia onset and termination was recorded together with the tachycardia cycle length, local activation time at the site of successful ablation, as well as the ratio of atrial to ventricular electrogram as recorded on the ablation catheter at the site of successful ablation.
All antiarrhythmic medications were discontinued at least five half-lives before the study. None of the patients were taking amiodarone or digitalis. If necessary, electrophysiological studies were performed using intravenous midazolam and/or fentanyl. Conventional 12-lead surface ECG and bipolar intracardiac electrogram recordings (filtered between 30 and 500 Hz) were amplified and displayed using the Prucka CardioLab System (GE Medical Systems, Milwaukee, WI, USA). A quadripolar catheter was placed via a left femoral vein in the RV and a decapolar catheter was placed in the CS with the proximal pole at the ostium. High-rate atrial stimulation (or programmed stimulation) and intravenous isoproterenol and/or atropine were used for arrhythmia induction if spontaneous tachycardia was not present at the baseline.
Mapping of atrial tachycardia
A mapping and ablation procedure was performed using a 7-F Navistar catheter (Biosense Webster, Diamond Bar, CA, USA; 4 mm tip, two bipolar electrode pairs, inter-electrode distance 2 mm) and guided by a 3D-EA mapping system (CARTO-XP, Biosense Webster) in all patients. Activation mapping during tachycardia was used to identify sites of earliest endocardial activation in the RA and CS. Activation time in the CS relative to the RA activation was used to describe preferential conduction used for impulse propagation from the RA into the LA. The influence on PWM in V3–V6 was studied.
Activation time was measured from the onset of the first sharp component of the bipolar electrogram on the distal mapping catheter to the earliest deflection of the P-wave on the surface ECG. The target site of ablation was determined using the combination of the earliest bipolar activation and the shape of the unipolar electrogram (sharply negative pattern).
Radiofrequency catheter ablation and follow-up
Radiofrequency catheter ablation was performed in the RA with continuous temperature feedback control of the power output to achieve a target temperature of 70°C. The maximum power used was 50 W for a maximum of 60 s. An acute procedural success was defined by the inability to induce the tachycardia 15 min after the ablation despite the aggressive burst atrial pacing or programmed atrial stimulation and the use of isoproterenol. The patients were followed in their referring clinics in order to assess the recurrence of symptoms or documented tachycardia.
Section definitions
The RA location of the tachycardia focus was determined based on the findings from 3D-EA activation mapping and termination of the tachycardia using RFCA at the putative site.
An AT was considered to arise from the CT when earliest activation was mapped in this region with the aid of fractionated electrograms and the anatomical position was tagged on the 3D-EA map; ablation in this region successfully eliminated the tachycardia.
An AT was considered to arise from the CSo when earliest activation was recorded around the CSo and when ablation within 1 cm of this region successfully eliminated the tachycardia.
An AT was considered to arise from the TA based on the following criteria:
○ Ablation catheter positioned in an annular location when viewed in right and left anterior oblique fluoroscopic views with characteristic annular motion of the catheter tip.
○ A–V ratio of <1.
○ Exclusion of sites around the CSo and parahisian region. The different sectors of the TA (Figure 1) are described using anatomic terminology contained in published guidelines.10
○ Ablation in this region successfully eliminated the tachycardia.
An AT was considered to arise from the lower free wall:
○ Earliest activation was mapped in the region between non-septal TA and lower CT.
○ The local electrogram with the earliest activation did not contain either fractionated electrograms (suggests CT origin) or A–V ratio of <1 (suggests TA origin).
○ Ablation in this region successfully eliminated the tachycardia.
P-wave analysis
The PWM on the surface ECG was assessed carefully to assist in the tachycardia localization. Particular attention was paid to assessment of an unencumbered P-wave during periods of atrioventricular block or after ventricular pacing. The definitions by Tang et al.11 were used to analyse the surface 12-lead PWM and further modified based on our study findings in characterizing positive-isoelectric and negative-isoelectric morphologies. P-waves were described on the basis of the deviation from baseline during the T–P interval as being: (i) completely positive (+), (ii) completely negative (−), (iii) biphasic: when there were both positive and negative (+/− or −/+) deflections from baseline, (iv) isoelectric: when there were no P-wave deflections from baseline >0.05 mV, or (v) isoelectric-positive/isoelectric-negative: isoelectric line after the onset of the P-wave 20 ms followed by a change to positive or negative. Alternatively, positive-isoelectric/negative-isoelectric was defined as positive or negative pattern followed by an isoelectric line 20 ms before the end of P-wave. Figure 2 illustrates these different PWM during tachycardia.
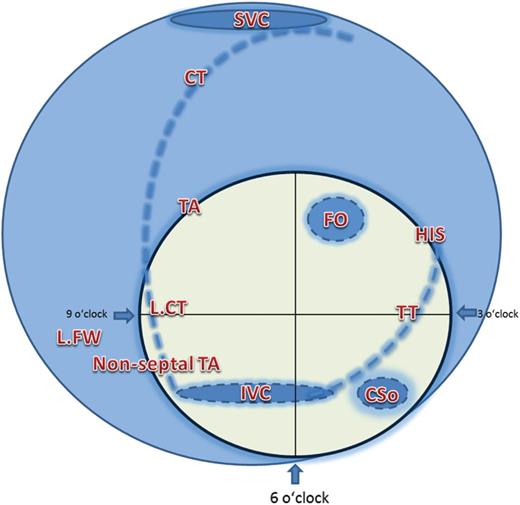
Localization of anatomical structures in the lower right atrium. SVC, superior vena cava; TA, tricuspid annulus; CT, crista terminalis; FO, fossa ovalis; L.FW, lower free wall; L.CT, lower crista terminalis; TT, tendon of tudaro; CSo: coronary sinus ostium.
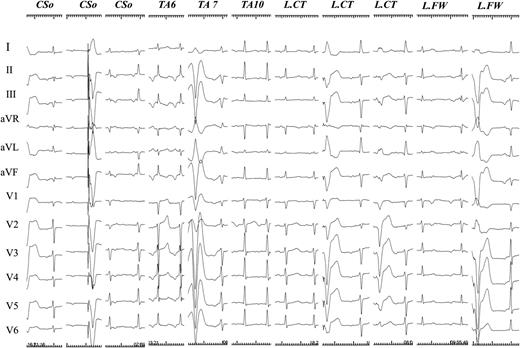
P-wave morphology during ectopic atrial tachycardias (25 mm/s). P-wave morphology was shown on a standard 12-lead ECG during ectopic atrial tachycardia originating from the lower right atrium. CSo, coronary sinus ostium; TA, tricuspid annulus; TA6, at 6 o'clock position of TA; TA7, at 7 o'clock position of TA; TA9, at 9 o'clock position of TA; L.CT, lower crista terminalis; L.FW, lower free wall.
Statistical analysis
All data distributions were tested for normality using histograms and presented as mean ± SD. Population proportions are presented as a percentage. The sensitivity, specificity, positive predictive value (PPV), and negative predictive value (NPV) were calculated according to standard definitions.
Results
Patient characteristics
The patient characteristics are described in Table 1. They were 52 ± 15 years of age and the majority was male (n = 21, 75%). None received amiodarone. All had normal cardiac anatomy on transthoracic echo with no Ebstein's anomalies. Left atrium diameters were measured as 34 ± 5 mm.
Patients' characteristics
| Patient number | Age (year) | Gender | LA (mm) | Hypertension | Diabetes | CAD | Arrhythmia |
|---|---|---|---|---|---|---|---|
| 1 | 64 | Male | 37 | − | − | − | PAF, EAT |
| 2 | 47 | Female | 39 | − | − | − | AVB III, EAT |
| 3 | 45 | Male | 33 | − | − | − | EAT |
| 4 | 42 | Male | 35 | − | − | − | EAT |
| 5 | 58 | Male | 40 | + | − | − | EAT |
| 6 | 56 | Male | 41 | + | − | − | EAT |
| 7 | 72 | Female | 42 | − | − | − | PAF, EAT |
| 8 | 71 | Male | 39 | − | − | − | EAT |
| 9 | 70 | Male | 36 | − | − | + | EAT |
| 10 | 60 | Male | 29 | + | − | − | EAT |
| 11 | 60 | Female | 37 | + | + | − | EAT |
| 12 | 59 | Male | 36 | + | − | − | EAT |
| 13 | 56 | Male | 33 | − | − | − | PAF, EAT |
| 14 | 43 | Male | 31 | + | − | − | EAT |
| 15 | 48 | Male | 30 | − | − | − | EAT |
| 16 | 81 | Male | 40 | − | + | − | EAT |
| 17 | 38 | Female | 24 | − | + | − | EAT |
| 18 | 27 | Male | 26 | + | − | − | EAT |
| 19 | 36 | Male | 33 | + | − | + | EAT |
| 20 | 31 | Male | 30 | + | − | − | EAT |
| 21 | 33 | Male | 29 | − | − | EAT | |
| 22 | 46 | Female | 34 | + | − | + | EAT |
| 23 | 52 | Female | 36 | − | − | − | EAT |
| 24 | 66 | Male | 35 | − | − | − | PAF, EAT |
| 25 | 78 | Male | 33 | + | − | − | EAT |
| 26 | 55 | Male | 34 | + | − | − | EAT |
| 27 | 53 | Female | 27 | − | + | + | EAT |
| 28 | 22 | Male | 35 | − | + | − | EAT |
LA-diameter was measured at parasternal long axis view (antero-posterior in the 2D echo-long axis).
LA, left atrium; CAD, coronary arterial disease; PAF, paroxysmal atrial fibrillation; EAT: ectopic atrial tachycardia; AVB III°, third degree of atrioventricular block.
General findings
The AT origin was identified at the following sites: 11 patients (39%) along the TA (6–9 o'clock), another 11 (39%) around the CSo, 4 patients (14%) in the lower CT, and 2 patients (7%) in the lower RA free wall. Multifocal AT was found in two patients (7%) with AT originating from the CSo; in both cases the second focal tachycardia originated from the superior CT. In contrast to AT originating from the upper RA which typically shows at least two positive P-waves in the inferior (II, III, and aVF) leads, the ECG of all study patients with lower RA AT contained a maximum of one positive P-wave (up to one lead with exclusively positive pattern) in the inferior leads.
P-wave morphology and anatomic location
Non-septal tricuspid annulus origin
Nine of the 11 ATs originating at the non-septal TA (6–9 o'clock) had an exclusively negative pattern in the inferior and precordial (V3–V6) leads. However, the remaining two ATs originating from TA at 9 o'clock, had a negative–positive (patient 18) or positive (patient 19) pattern in lead II, an isoelectric pattern in lead III and aVF, and an exclusively positive pattern in precordial leads V3–V6 (Table 2, Figures 1 and 2).
Tachycardia cycle length and P-wave morphology during ectopic atrial tachycardia
| No. | TCL | Localization | I | II | III | aVR | aVL | aVF | V1 | V2 | V3 | V4 | V5 | V6 |
|---|---|---|---|---|---|---|---|---|---|---|---|---|---|---|
| Lower freewall (2 patients) | ||||||||||||||
| 1 | 320–360 ms | L.FW | + | − | − | +/− | + | − | − | − | −/+ | −/+ | −/+ | −/+ |
| 2 | 280–310 ms | L.FW | + | Iso | Iso | Iso | + | Iso | Iso | + | + | + | Iso | Iso |
| Lower CT (4 patients) | ||||||||||||||
| 3 | 400–450 ms | L.CT | +/− | Iso/− | Iso | + | − | +/− | Iso | + | + | + | + | + |
| 4 | 330–340 ms | L.CT | + | Iso | Iso | − | + | −/+ | Iso | + | + | + | + | + |
| 5 | 310–320 ms | L.CT | −/+ | −/+ | −/+ | + | −/+ | −/+ | Iso | Iso | −/+ | −/+ | −/+ | −/+ |
| 6 | 360 ms | L.CT | −/+ | −/+ | −/+ | − | + | −/+ | Iso | + | + | + | + | + |
| CS ostium (11 patients) | ||||||||||||||
| 7 | 270 ms | CSo | −/+ | − | − | + | + | − | Iso/+ | − | − | − | − | − |
| 8 | 290–320 ms | CSo | −/+ | − | − | + | + | − | Iso | Iso | − | − | − | − |
| 9 | 300–340 ms | CSo | Iso | − | − | + | + | − | − | − | − | − | − | − |
| 10 | 250–270 ms | CSo | Iso | − | − | + | + | − | Iso | Iso | − | − | − | − |
| 11 | 290 ms | CSo | −/+ | − | − | + | + | − | −/+ | Iso | − | − | − | − |
| 12 | 380–390 ms | CSo | −/+ | − | − | + | + | − | Iso | − | − | − | − | − |
| 13 | 350–390 ms | CSo | −/+ | − | − | + | + | − | −/+ | −/+ | − | − | − | − |
| 14 | 330–360 ms | CSo | −/+ | − | − | + | + | − | Iso | −/+ | −/+ | −/+ | − | − |
| 15 | 390–450 ms | CSo | −/+ | − | − | + | + | − | +/− | − | − | − | − | − |
| 16 | 380 ms | CSo | −/+ | − | − | + | + | − | + | Iso | −/+ | − | − | − |
| 17 | 410–430 ms | CSo | Iso | − | − | + | + | − | + | Iso | − | − | − | − |
| Non-septal TA (11 patients) | ||||||||||||||
| 18 | 330–350 ms | TA 9 | −/+ | −/+ | Iso | + | −/+ | Iso | − | −/+ | + | + | + | + |
| 19 | 460 ms | TA 9 | + | + | Iso | − | Iso | Iso | − | Iso | + | + | + | + |
| 20 | 420–440 ms | TA 6 | −/+ | − | − | + | + | − | −/+ | −/+ | − | − | − | − |
| 21 | 390–400 ms | TA 7 | Iso | − | − | + | + | − | − | − | − | − | − | − |
| 22 | 270 ms | TA 6 | Iso/+ | − | − | + | + | − | Iso | − | − | − | − | − |
| 23 | 320 ms | TA 6 | −/+ | − | − | + | + | − | Iso | − | − | − | − | − |
| 24 | 330–340 ms | TA 6 | −/+ | − | − | + | + | − | Iso | Iso/− | − | − | − | − |
| 25 | 330–350 ms | TA 7 | + | − | − | − | + | − | − | −/Iso | − | − | − | − |
| 26 | 310–320 ms | TA 7 | −/+ | − | − | + | + | − | − | Iso | − | − | − | − |
| 27 | 350 ms | TA 6 | Iso/+ | − | − | + | + | − | Iso | Iso | − | − | − | − |
| 28 | 290 ms | TA 6 | Iso | − | − | + | + | − | + | Iso | − | − | − | − |
L.FW, lower free wall; L.CT, lower crista terminalis; CSo, coronary sinus ostium; TA, tricuspid annulus.
Coronary sinus ostium origin
All eleven ATs originating from CSo had a positive pattern in aVR and aVL leads with an exclusively negative pattern in all inferior leads (II, III, and aVF). Nine of 11 ATs had an exclusively negative pattern in all four precordial leads (V3–V6). In the remaining two ATs, one (patient 14) had a biphasic pattern (−/+) in precordial leads V3 and V4. The other (patient 16) had a biphasic pattern (−/+) in precordial lead V3. All biphasic patterns contained an early negative component.
Lower crista terminalis
All ATs originating from the lower CT (n = 4), had isoelectric or biphasic patterns in the inferior leads (II, III, and aVF) and three had a positive pattern in all four precordial leads (V3–V6). The remaining one AT had a biphasic pattern (−/+) in all four precordial leads (V3–V6).
Lower free wall
Two ATs originated from the lower free wall of the RA. One exhibited a negative pattern in all inferior leads (II, III, and aVF) and biphasic patterns (−/+) in all four precordial leads V3–V6. The other exhibited an isoelectric pattern in all inferior leads (II, III, and aVF), a positive pattern in V3 and V4 and an isoelectric pattern in V5 and V6.
Power of precordial leads (V3–V6) to discriminate the anatomical atrial tachycardia origin
Lower tricuspid annulus origin (annulus foci) vs. lower crista terminalis origin
P-wave morphology in the precordial leads (V3–V6) showed a negative pattern in at least two consecutive leads at the origins of AT from the non-septal TA (9 of 11 patients) or CSo (all 11 patients). In contrast, AT from the lower CT showed a positive pattern in V3–V6 in three of four patients. A negative P-wave in at least two consecutive leads in V3–V6 demonstrated a sensitivity of 91%, a specificity of 100%, a PPV of 100%, and an NPV of 75% for a focus at the TA, including CSo and non-septal TA. On the contrary, a positive P-wave in all V3–V6 demonstrated a sensitivity of 75%, a specificity of 100%, a PPV of 60%, and an NPV of 96% for a lower CT focus.
Non-septal tricuspid annulus origin vs. coronary sinus ostium origin
In the current study, the PWM in precordial leads V3–V6 was not able to discriminate between AT with CSo and non-septal TA origin. Both AT origins were associated with predominantly negative P-waves in the precordial leads (V3–V6).
Activation mapping and preferential interatrial conduction
Coronary sinus activation during AT was recorded from proximal to distal using the CS catheter and compared to the spread of RA activation described in the right atrial 3D map. During AT originating from the lower CT, the proximal CS (CS 9–10) was activated later than the lower mid-septum of RA, but slightly earlier (two of four patients) or simultaneously (one of four patients) in relation to the posterior CSo (Figure 3A). However, during AT originating from the lower TA (20 of 22 patients), including the non-septal TA (9 of 11 patients) (Figure 3B) and the CSo (all 11 patients) (Figure 3C), the proximal CS was activated earlier than the lower right atrial mid-septum. These activation patterns indicate differences in LA activation caused by different preferential conduction pathways used for interatrial impulse propagation.
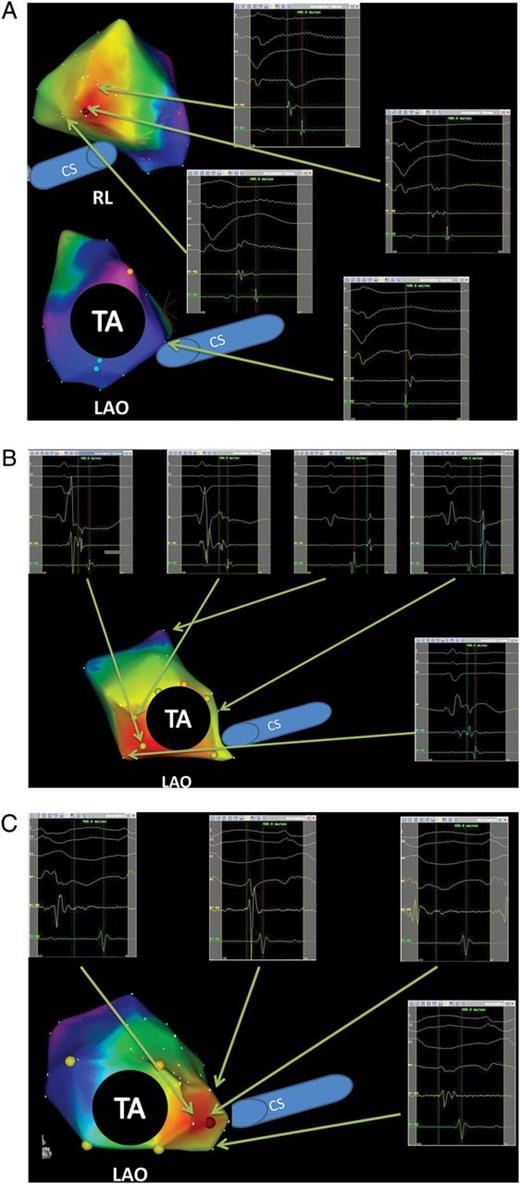
Three-dimensional electroanatomical mapping (activation map) and endocardial electrograms during ectopic atrial tachycardias. (A) The ectopic atrial tachycardia originated from the lower crista terminalis. The right inferior electrograms show mid-septum was activated later than coronary sinus ostium. The left superior activation map shows the earliest activation spot with fragmented potentials on the ablation catheter and sharply negative unipolar electrogram. (B) The activation map shows the ectopic atrial tachycardia originating from non-septal TA (7 o'clock). The right superior electrograms show mid-septum (posterior area of coronary sinus ostium) was activated later than coronary sinus ostium. (C) The activation map shows an ectopic atrial tachycardia originating from the coronary sinus ostium.
Discussion
Main findings
In patients with AT from the lower RA, characteristic PWMs in V3–V6 leads could help to differentiate the anatomical site of AT origin with high PPVs and NPVs. A negative pattern in V3–V6 indicates an AT from annular aspects of the RA such as the non-septal TA and around the CSo while positive P-waves in V3–V6 are associated with a lower CT focus. These different PWM patterns are likely to be influenced by the preferential conduction between RA and LA.
P-wave morphology in precordial leads V3–V6
The PWM in precordial leads V3–V6 provided high PPVs and NPVs for the localization of AT originating from the lower TA or CT. However, PWM in the precordial leads V3–V6 was not useful in distinguishing ATs of non-septal TA vs. CSo origin. Previous studies have described the PWM of ATs originating from non-septal TA and CSo, separately.4,5,7 Morton et al.4 reported either inverted or biphasic P-waves with an initial negative deflection in V2–V6 during ATs from TA and a predominantly negative PWM in lead V3 and V6 has been described in association with ATs from CSo.5 In another study from the same group,7 a positive P-wave in lead V3 and V6 during ATs originating from the lower CT was described, which supports our findings. It has also been suggested that PWM in leads I and V1 can differentiate between non-septal TA and CSo origins.7 However, when we applied these criteria to our data, a positive pattern in lead I provided a sensitivity of only 27% with a specificity of 100%. Negative P-waves in lead V1 differentiated between a non-septal TA and CSo origin with a sensitivity of 23% and a specificity of 83%. It is possible to explain the low sensitivity of leads I/V1 criteria in our data by the anatomical distribution of ATs, as the majority of ATs in our patient cohort were located at TA 6–7 o'clock.
Considering the low prevalence of ATs originating from the lower free wall and the lower CT, we could not draw a solid conclusion on the reliability of PWM for distinguishing ATs with an origin from these sites. However, in contrast to a lower CT origin, none of the ATs from the lower free wall contained a completely positive P-wave in all leads V3–V6.
Preferential interatrial connections and formation of P-wave morphology in atrial tachycardias
The Bachmann bundle (BB), a region of rapid IAC connecting the superior RA and LA behind the ascending aorta, is recognized as the preferential path of LA activation during sinus rhythm as demonstrated by both animal and human studies.12–14 Another pathway of IAC is located in the proximity of the CS ostium and utilizes the myocardial CS coat15 for electrical impulse propagation.14,16 Ho and Sanchez-Quintana17 also described small muscular bridges connecting the RA posterior wall with the LA posterior wall near the ostia of the right-sided pulmonary veins (PVs). The presence of these posterior interatrial connections was also confirmed by mapping during PV tachycardias,13 identifying a posterior breakthrough at the intercaval area of the RA. On the basis of the findings above, the pattern of IAC may differ depending on the relative proximity of the source of activation to each of the possible electrical pathways (posterior fibres, BB, or CS).18
The formation of PWMs during ATs depends on the activation sequence of both the RA and the LA which can also be described in terms of the original chamber (generator) and the secondary chamber (follower). The activation pattern of the secondary chamber is determined by the insertion site of the preferential interatrial connection. In our study focusing on ATs from the lower RA, a superoanterior interatrial connection through the BB was unlikely due to its large anatomical distance from the focal arrhythmic origin. Conversely, the LA was activated using inferoanterior (musculature in the vicinity of CS) or posterior (posterior fibres behind foramen ovale) IAC pathways. Accordingly, the follower (LA) was activated either anteriorly/posteriorly or vice versa, resulting in a negative or positive PWM in precordial leads V3–V6.
Interpretation of characteristic P-wave morphology in precordial leads
The ATs of TA origin primarily showed P-waves that were either exclusively negative or with early negative components in leads V3–V6 and were thus significantly different from ATs originating from the lower CT showing a positive PWM. Activation mapping suggested that the right atrial depolarization vector during ATs with TA origin pointed from the TA to the posterior wall; meanwhile, the LA was activated via musculature in the vicinity of the CS using one of the three possible IAC pathways with an antero-posterior LA depolarization vector. In contrast, activation mapping during ATs of lower CT origin showed a reverse pattern of the depolarization vector in both atria and, consequently a positive PWM in leads V3–V6. We speculate that this may be explained by a forward left atrial depolarization vector caused by a preferential IAC through posterior fibres near the ostia of the right-sided PVs. Neither of the two ATs of lower free wall origin had either negative or positive P-waves in all leads V3–V6 which may relate to different locations of AT origin relative to possible interatrial sites of conduction.
Distribution of localization of atrial tachycardia foci in lower right atrium
It needs to be kept in mind that foci within the lower RA are an uncommon source of AT. In fact, in the present study, only 19% of 144 right atrial ATs originated from the lower RA. Therefore, the described distribution of AT origins within the lower RA is limited by sample size. In the paper by Kistler et al.,7 lower RA foci were more commonly located at the TA (n = 38), while CSo and lower CT accounted for n = 16 and n = 4 cases, respectively. While the CT is a common anatomic origin of RA tachycardia overall, AT from the lower CT is rare (below 10% of all CT foci7).
Conclusion
Characteristic PWMs, in all inferior leads combined with a positive or negative pattern in V3–V6 leads, may help to differentiate annular vs. more posterior anatomical sites of ATs from the lower RA with high PPVs and NPVs. P-wave morphology in V3–V6 is likely to be influenced by the employment of preferential conduction pathways between RA and LA.
Limitation
Activation mapping of the LA was not carried out during the electrophysiological study. However, the activation sequence of LA was mapped using the CS catheter and the interrelation of RA and LA activation could be assessed using the combination of CS- and 3D-map of the RA. Yet, the exact localization of the LA breakthrough during AT cannot be provided.
Acknowledgement
We appreciate Hedi Razavi, PhD for improving our English. We also appreciate Pyotr G Platonov, MD, PhD, FESC for valuable advice.
Conflict of interest: none declared.
