


Abstract
Diagnosis of Type-2 Brugada pattern remains challenging and it could be confused with other electrocardiogram (ECG) patterns presenting an r′-wave in leads V1–V2 like in healthy athletes. This could impact their ability to perform competitive sports. The aim of the study was to evaluate, as a proof of concept, the new ECG criteria to differentiate the Type-2 Brugada pattern from the ECG pattern of healthy athletes depicting an r′-wave in leads V1–V2.
Surface ECGs from 50 patients with Brugada syndrome and type-2 Brugada pattern and 58 healthy athletes with an r′-wave in leads V1–V2 were analysed. Different criteria based on the characteristics of the triangle formed by the ascendant and descendant arms of the r′-wave in leads V1–V2 were compared. The duration of the base of the triangle at 0.5 mV (5 mm) from high take-off ≥160 ms (4 mm) has a specificity (SP) of 95.6%, sensitivity (SE) 85%, positive predictive value (PPV) 94.4%, and negative predictive value (NPV) 87.9%. The duration of the base of the triangle at the isoelectric line ≥60 ms (1.5 mm) in leads V1–V2 has an SP of 78%, SE 94.8%, PPV 79.3%, and NPV 93.5%. The ratio of the base at isoelectric line/height from the baseline to peak of r′-wave in leads V1–V2 has an SP of 92.1%, SE 82%, PPV 90.1%, and NPV 83.3%.
The three new ECG criteria were accurate to distinguish the Type-2 Brugada pattern from the ECG pattern with an r′-wave in healthy athletes. The duration of the base of the triangle at 0.5 mV from the high take-off is the easiest to measure and may be used in clinical practice.
We have found a very interesting criterion to know in cases of ST elevation and r′ in V1 if this pattern corresponds to Brugada pattern Type 2 or may be explained by other causes.
We have studied two groups of patients, one with a true Type-2 Brugada pattern and positive ajmaline challenge and a group of athletes with r′ in V1 and/or V2. In the case of second group, we do not perform an ajmaline test because the Olimpic Committee of Spain does not allow that, as all the athletes had negative clinical characteristics.
We consider that especially the measurement of the base of the triangle of r′ in V1 V2 taken at 5 mm from the peak of r′ is much easier to perform than the Chevalier angle and has even greater accuracy.
Introduction
Recently, a consensus document endorsed by the International Society for Holter and Noninvasive Electrocardiology (ISHNE) on the ECG criteria for the diagnosis of Brugada patterns has been published.1 This document proposed to unify Type-2 and 3 Brugada patterns of the previous consensus2,3 into a single one: the new Type 2 (saddle back pattern), while maintains the coved pattern as the characteristic Type-1 Brugada ECG pattern. The Type-2 Brugada pattern presents characteristically an r′-wave that may be confused with other ECG patterns that also present an r′-wave in leads V1–V2 including incomplete right bundle branch block (IRBBB), pectus exacavatum, arrhythmogenic RV dysplasia (ARVD), and athletes' ECG. The differential diagnosis still remains challenging.4–8 Major efforts to help the clinician to distinguish these ECG morphologies have been pursued. Chevallier et al.9 and Ohkubo et al.10 have described that the angle formed between the upslope of the S-wave and the downslope of the r′-wave (β angle) was the best way to differentiate the Type-2 Brugada pattern (in their articles still Types 2 and 3), from IRBBB. A β-angle cut-off of 58° yielded a positive predictive value (PPV) of 73% and a negative predictive value (NPV) of 87% in the Chevallier study.9 However, obtaining the proper β-angle measurement may be difficult and not easy to perform in clinical practice leading to misdiagnosis. Corrado et al.11 have also described an index based on the slope of the first 80 ms of the ST-segment in leads V1–V2 that is of ascendant direction in athletes and of descendent direction in Type-2 Brugada pattern, which may be also useful for differential diagnosis. However, recognition of the end of the QRS in leads V1–V2 may not be easy in many cases of Type-2 Brugada pattern, and furthermore, sometimes the J point do not always coincide with the high take-off of the QRS in those leads.12,13
The aim of the present study was to assess, as a proof of concept, the diagnostic accuracy of new ECG criteria to distinguish between the Type-2 Brugada pattern and healthy athletes with an r′-wave pattern in leads V1–V2.
Methods
Design
A retrospective study was carried out comparing the surface ECG of 50 patients with confirmed Brugada syndrome (presenting with syncope and positive sodium blocker drug challenge) and Type-2 Brugada pattern (consecutive cases obtained from the Brugada's database from January 2008 to March 2011) vs. 58 healthy athletes with no family history of sudden death and no previous syncope or history of ventricular tachyarrhythmias, presenting with an r′-wave in leads V1–V2 (consecutive athletes attended in the Spanish National Sport Council during the year 2010), cases obtained from the Spanish National Sport Council.
Electrocardiogram collection and analysis. Surface 12-lead electrocardiograms were recorded using international recommendations (10 mm/mV amplitude, 25 mm/s speed), placing leads V1–V2 in the fourth intercostal space.14 Printed versions of the electrocardiograms were scanned in a 100–300 DPI resolution image format (JPEG). Electrocardiograms were blindly analysed by two different investigators (G.S., D.A.). If there is no agreement between them to identify r′-wave slopes and placing of segments on the upslope and downslope of the r′-wave at the isoelectric line, the opinion of a third investigator (A.B.L.) was decisive and necessary only in four cases.
The analysis of the ECG required a scalable vector format (SVG) compatible program (Inkscape). The characteristics of the r′-wave and the isoelectric line were measured in all QRS-T complexes in leads V1–V2 in a 10 s ECG recording. We added for each beat with an r′-wave (Figure 1A part A) two segments that followed the up-slope and downslope of the r′-wave (Figure 1A part B) and one segment that followed the isoelectric line (Figure 1A part C).
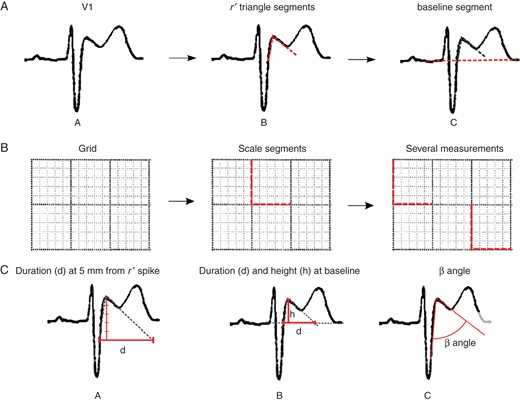
(A) Segment location performed by the observers. (A) Original signal. (B) Segment location at upslope and downslope of r′-wave. (C) Segment location at the isoelectric line. (B) Segment location for scale measurement from the original grid—vertical and horizontal segment locations following 5 mm2 grid. (C) Measurements extracted from located segments by the analysts—(A) the duration of the base of the triangle at 0.5 mV from r′-wave high take-off, (B) Height and duration of the triangle at the isoelectric line, (C) angle from S wave upslope and r′ downslope (β angle).
Scale measurement was done adding two perpendicular segments, each of 5 mm length, following the image grid and the default pulse to stabilize the scale using several reference marks (Figure 1B). Finally, an SVG file was stored with all the segments defined by the investigator.
Measurement extraction
A program was developed using a Python programming language, which enabled the segment extraction and scale correction. The metrics from scale measurements were automatically calculated using the mean of all vertical and horizontal scale marks available in each case. Segments were rescaled using their respective metrics. From the segments placed by the investigators, we measured the new three criteria (i) the duration of the base of the triangle between the upslope and the downslope of the r′-wave at 0.5 mV from the high take-off (Figure 1C, part A), (ii) the duration of the base of the triangle at the isoelectric line, and (iii) the ratio of base/height of the triangle formed by the upslope and the downslope of the r′-wave at the isoelectric line (Figure 1C, part B). We also measured the β angle, an angle formed between the r′-wave upslope and the downslope coined by Chevallier et al.9 (Figure 1C, part C).
All measurements were calculated from both leads V1 and V2. The mean value of the different measurements from the beats was computed for each lead and patient. The parameters were automatically calculated from the position of the isoelectric line and the r′-wave upslope and r′-wave downslope in order to have measurements of different angles and durations at the same time. To simulate precision eyesight, all measurements, except angles, were rounded at 20 ms (0.5 mm) precision. The study found no significant differences between the rounded parameters and the exact parameters. The interobserver concordance assessed by Lin's concordance test was very high with an overall coefficient of 0.87, suggesting that different trained investigators can use these measurements.
Construction of composite indices
To improve the feasibility and reproducibility of the method, combinations of the same parameters in leads V1–V2 were analysed. It was considered that the test was positive for the Brugada pattern when the criterion was met for at least one of the two leads. The absence of r′-wave in a single lead was considered as a negative result in this lead. The simplest values (integer numbers instead of decimal numbers) among the best cut-off values were selected and sensitivity (SE), specificity (SP), PPV, and NPV were calculated (Table 1).
Diagnostic accuracy of the best cut-off values for the different measurements based on the characteristics of the r′-wave obtained in leads V1–V2
| Leads V1–V2a | Sensitivity | Specificity | PPV | NPV |
|---|---|---|---|---|
| Duration of the base of the triangle at 5 mm from r′-wave ≥160 ms (4 mm) | 85 | 95.6 | 94.4 | 87.9 |
| Triangle base/height ratio | 82 | 92.1 | 90.1 | 83.3 |
| Duration of the base of the triangle at the isoelectric line ≥60 ms (1.5 mm) | 94.8 | 78 | 79.3 | 93.5 |
| bβ angle ≥36.8° | 86 | 94.7 | 93.5 | 88.5 |
aMeasurements performed in leads V1 or V2 or in both.
bβ angle: angle formed from r′-wave upslope to r′-wave downslope.
Statistical analysis
Continuous variables are presented as mean (standard deviation) and categorical variables as percentages. For all continuous variables departure from the normal distribution was assessed using a Lilliefors normality test.15 Differences in continuous variables between the two groups were assessed with a parametric (Student's t-test) or non-parametric (Wilcoxon rank sum test with continuity correction) test depending on the results of the normality tests. Receiver-operating characteristic (ROC) curves and area under the curve (AUC) were constructed and compared using Delong et al.'s method.16 The best score cut-off values were chosen among the points in the curve with a minimum distance to the best point (0, 1) and simplest cut-off values to calculate diagnostic accuracy statistics (SE, SP, PPV, NPV) and their 95% confidence intervals. Data analysis was performed using the R software17 and RPy Python parser.18 For interobserver reproducibility and ROC curve analysis the pROC package was used.15
Results
Demographics and clinical characteristics of both groups are depicted in Table 2. Patients with Brugada syndrome were older and more frequently men. The duration of the base of the triangle at 0.5 mV from the high take-off, the duration of the base of the triangle at the isoelectric line, and the ratio of the base/height of the triangle formed by the upslope and the downslope of the r′-wave at the isoelectric line were significantly higher in patients with confirmed Brugada Syndrome and Type-2 Brugada ECG pattern than in the healthy athlete group (Table 2). Figures 2 and 3 show how the base of the triangle of r′-wave at 0.5 mV from the high take-off differs between Type-2 Brugada pattern (>160 ms, 4 mm) and healthy athletes (<160 ms, 4 mm) even presenting similar ST-T morphology. Receiver-operating characteristic curves showed that the AUC for (Figure 4A) the duration of the base of the triangle of r′-wave at 0.5 mV from the high take-off for lead V1 was 0.955 and for lead V2 0.944; (Figure 4B) the duration of the base of the triangle at the isoelectric line for lead V1 was 0.907 and for lead V2 0.938; (Figure 4C) the triangle base/height ratio for lead V1 was 0.940 and for lead V2 0.944; and (Figure 4D) the β angle for lead V1 was 0.957 and for lead V2 0.952 (Figure 4). The SE, SP, PPV, and NPV for the proposed best cut-off are shown in the table.
Clinical characteristics of the study population
| Athletes with IRBBB ECG pattern (n = 58) | Brugada patients with Type-2 Brugada pattern (n = 50) | |
|---|---|---|
| Age, [mean (standard deviation)] (P < 0.01) | 21.8 ± 6.6 | 47.7 ± 17.4 |
| Sex (male %) (NS) | 74 | 81 |
| Sudden death (aborted) | – | 1.5% |
| Athletes with IRBBB ECG pattern (n = 58) | Brugada patients with Type-2 Brugada pattern (n = 50) | |
|---|---|---|
| Age, [mean (standard deviation)] (P < 0.01) | 21.8 ± 6.6 | 47.7 ± 17.4 |
| Sex (male %) (NS) | 74 | 81 |
| Sudden death (aborted) | – | 1.5% |
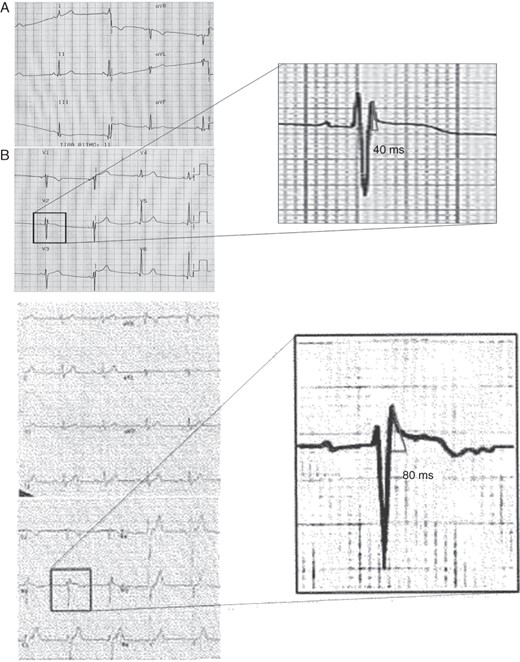
Two examples of healthy athletes ECG. (A) Healthy athlete with ST-T elevation and r′-wave but with a base of the triangle at 0.5 mV measuring 40 ms (1 mm). (B) Electrocardiogram of a healthy athlete with similar ST-T morphology and the base of triangle measuring 80 ms (2 mm).
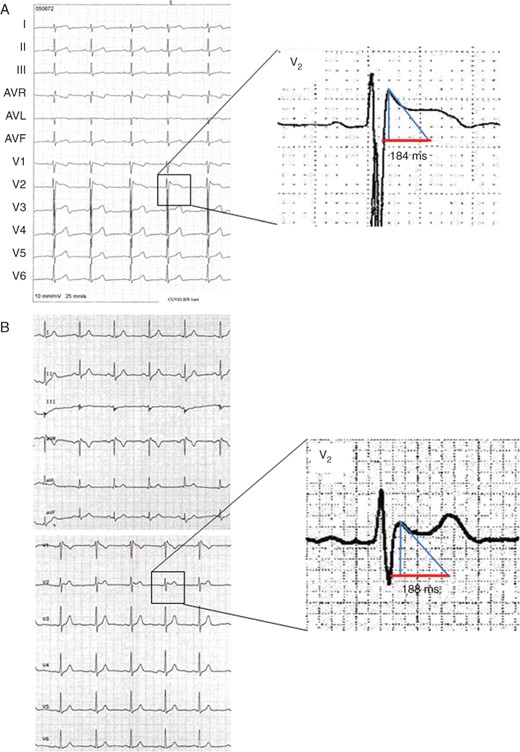
Two examples of Type-2 Brugada ECG pattern. (A) Type-2 Brugada pattern with the base of the triangle at 0.5 mV, measuring 184 ms (4.6 mm). (B) Type-2 Brugada pattern with base of the triangle at 0.5 mV measuring 188 ms (4.7 mm).
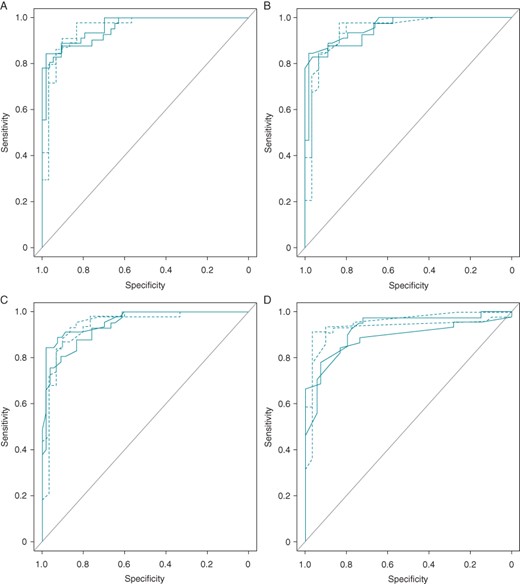
Receiver-operating characteristic curves classified by parameters (A) the duration of the base of the triangle at 5 mm from the high-take off of the r′-wave, (B) the duration of the base of the triangle at the isoelectric line, (C) triangle duration/height ratio at the isoelectric line, (D) β angle. Four curves for each parameter from leads V1 and V2 from both observers. Solid lines refer to lead V1, dotted lines to lead V2. *β angle: Angle formed from r′-wave upslope to r′-wave downslope.
Discussion
Brugada syndrome19 is an inherited heart disease produced by inactivation of the sodium channels in the right ventricle, which can present polymorphic ventricular tachycardia and ventricular fibrillation.
The importance of electrocardiogram for the diagnosis of Brugada syndrome
The ECG is the hallmark diagnostic test in Brugada syndrome. Proper interpretation of the r′-wave characteristics in leads V1–V2 may be crucial for differentiating benign ECG patterns from Type-2 Brugada pattern.1
Other inherited diseases such as arrhythmogenic right ventricular dysplasia have also been considered in the differential diagnosis, but usually the ECG characteristics in leads V1–V2 do not depict a clear r′-wave (epsilon wave is usually separated from the QRS), no clear ST-segment elevation and symmetric negative T-waves are usually seen in leads V1–V3.
The differential diagnosis of Type-2 Brugada pattern and electrocardiogram of athletes
It is of utmost importance to distinguish the Type-2 Brugada pattern from r′-wave patterns in healthy athletes.12 Corrado et al.11 have described an index that could also help in this differentiation.
This group considered that the end of QRS (J point) coincides with the high take-off of QRS–ST in Type-1-Brugada pattern. This observation, unfortunately, could not be validated in other series.12,13 However, this index may still be valid in certain cases.
The Type-2 Brugada ECG pattern is characterized by a positive r′-wave deflection at the QRS–ST junction in leads V1–V2 with a shallow down slope of descendent arm, with minimal or no reciprocal changes in other leads.1 On the contrary, the r′-wave seen in incomplete RBBB presents a fast downslope due to early conduction delay in the right bundle. For some authors, the coved QRS-ST pattern in Type-1 or the r′-wave in Type-2 Brugada patterns may not indicate only delayed RV activation, but also early repolarization and J-point elevation.20 The downsloping ST-segment in the ‘coved’ type is followed by a negative T-wave due to voltage gradient (VG) at the end of repolarization, as a consequence of delayed action potential (AP) duration that overcomes the duration of the endocardium AP. On the contrary, an inverted VG in Type-2 Brugada pattern explains the positivity of the T-wave that is seen frequently in the Type-2 Brugada pattern.
The importance of new electrocardiogram criteria to diagnose Type-2 Brugada pattern
In this study, we described new electrocardiographic criteria to discriminate the Type-2 Brugada pattern from healthy athletes with r′-wave in leads V1–V2. All three new criteria (Table 3) demonstrated high diagnostic yield to identify patients with true Brugada syndrome which are not superior to the β-angle criterion described by Chevallier et al.,9 and therefore may be used in addition or as an alternative to it. Furthermore, its real value should be also tested in a prospective study. This author found that the β angle at 58° cut-off yielded a PPV of 73% and a NPP of 87%. Our findings suggest that the β-angle best cut-off value is lower than that in the Chevalier series (≥36.8°). One of the reasons for the discrepancy could be related to the fact that obtaining the proper β-angle measurement is not easy and inter-intrapersonal variation may be high. Chevallier et al.9 and Ohkubo et al.10 also proposed the measurement of the α angle formed between the vertical line at the r′-wave high take-off and the downslope of the r′-wave. In our study, we did not assess this measurement because it was slightly less sensitive and specific compared with the β angle.9
Characteristics of the different measurements based on the characteristics of r′-wave obtained in leads V1 and/or V2 in athletes with r′-wave and in patients with Brugada syndrome with a Type-2 Brugada pattern (mean ± standard deviation)
| Lead V1 | Lead V2 | P value (max) | |||
|---|---|---|---|---|---|
| Athletes with r′-wave ECG pattern (n = 58) | Brugada patients with Type-2 Brugada pattern (n = 50) | Athletes with an r′-wave ECG pattern (n = 58) | Brugada patients with Type-2 Brugada pattern (n = 50) | ||
| Duration of the base of the triangle at 0.5 mV from the r′-wave (ms) | 72 ± 1.1 | 310 ± 5.9 | 52 ± 1.13 | 256 ± 70 | <0.003 |
| Duration/height ratio of the triangle at the isoelectric line | 0.35 ± 0.2 | 1.6 ± 1.3 | 0.30 ± 0.28 | 1.3 ± 1.4 | <0.003 |
| Duration of the base of the triangle at the isoelectric line (ms) | 40 ± 3 | 107 ± 12 | 40 ± 0.3 | 120 ± 2.3 | <0.04 |
| aβ angle | 19.4 ± 11.2 | 57 ± 20.7 | 14.6 ± 10.4 | 48.2 ± 21.9 | <0.001 |
The maximum P value between cases and controls for the two comparisons is depicted.
aβ angle: angle formed from r′-wave upslope to r′-wave downslope.
In our study, the three new electrocardiographic criteria are based on the characteristics of the r′-wave. The duration of the base of the triangle formed by ascendant and descendent arms of r′-wave at 0.5 mV from the high take-off was the easiest to measure and may be useful in clinical practice. The duration equal or greater than 160 ms (4 mm) in V1 and/or V2 identifies patients with Brugada patterns. The other two parameters, duration of the base of the triangle at the isoelectric line ≥60 ms and the ratio of duration/height of those triangle at the isoelectric line ≥0.8, also demonstrated high SE and SP, similar to or higher than that obtained with the β angle.
In this study, we have demonstrated the value of these criteria for the differential diagnosis between Type-2 Brugada pattern and healthy athletes with r′-wave in leads V1–V2. This remains a challenge to demonstrate whether these new parameters are useful to distinguish the Type-2 Brugada pattern from other entities depicting r′-wave in leads V1–V2.
It is very important to bear in mind that the surface ECG recording, discovered more than 100 years ago by Einthoven, may still provide such interesting information 20 years after the discovery of the syndrome.19 It may be useful in the stratification of risk, a very important advantage from a clinical and patient management point of view.
Limitations
This study included athletes with no history of arrhythmias as the control population. We did not use sodium channel blockers challenge (i.e. flecainide or ajmaline) to exclude sodium channel dysfunction. However, due to the lack of family history of sudden death and personal history of syncope or ventricular tachyarrhythmias, together with a complete normal physical examination and echocardiography, we considered this population as presumably healthy athletes and it was not considered necessary for the ethics committee of the Spanish Olympic Council to perform the drug challenge test. Furthermore, the number of cases and controls studied is small and both the groups differ in age.
Conclusions
The new electrocardiographic criteria are useful, as a proof of concept, to distinguish Type-2 Brugada pattern from healthy athletes with an r′-wave in leads V1–V2 having high SE and SP. The duration of the base of the triangle at 5 mm from the high take-off is the easiest criterion to use in clinical practice.
Funding
This study was partially funded by grants from the Fondo de Investigación Sanitaria—Instituto Carlos III/European Development Research Funds (Red de Investigación Cardiovascular RD12/0042).
Conflict of interest: A. B. de L.: shareholder and consultant for Gem-Med®; J. B.: Advisory board Nuubo, Research grants from Boston Scientific, Minor honoraria from Boehringer, Sorin, St. Jude medical. P. B.: Research contracs and speker fees from Medtronic, Biotronik, St. Jude medical, Sorin, Boston Scientific and Biosense Webster.
