


Abstract
To study, using simulation, the spectral characteristics of different patterns of atrial fibrillation (AF) at high spatial resolution. Dominant frequency (DF) and organization index (OI) maps have been used to approximate the location of the focal source of high frequency during AF events.
A realistic three-dimensional model of the human atria that includes fibre orientation, electrophysiological heterogeneity, and anisotropy was implemented. The cellular model was modified to simulate electrical remodelling. More than 43 000 electrograms were calculated on the surface, and were processed to reconstitute the DF and OI maps. Atrial fibrillation episodes were triggered by a source of transitory and of continuous activity (both with a cycle length of 130 ms) in five different locations. The maps obtained during the AF events triggered by transitory foci did not show areas with high DF or OI values. When continuous foci were applied, the DF maps show ample zones with high values in the atrium where the focus was applied; while OI maps display smaller areas with high values, always within the areas of high DF and, in three of five locations, this high-value area was located at the site of focus application and at the nearby area. In the other two locations, the area presenting the highest OI values is small and located at the site of focus application, which allowed its precise localization.
Organization index maps provide a better approximation than DF maps for the localization of ectopic sources of high frequency and continuous activity during episodes of simulated AF in remodelled tissue.
• This is the first study to characterize arrhythmic episodes with the use of electrograms calculated on the entire atrial area. More than 43 000 electrograms were used to develop high-resolution DF and OI maps, providing comprehensive frequency and organizational information on the whole atrial surface throughout the simulation period. The use of DF and OI maps was compared, on the basis of their ability to locate sources of high frequency during AF through a computational 3D model of the atria previously developed. The results suggest that a better approximation is obtained using OI maps.
Introduction
Atrial fibrillation (AF) is the most common sustained cardiac arrhythmia in humans, and often results in disabling symptoms and severe complications such as heart failure and stroke.1 It has been demonstrated that prolonged AF causes atrial remodelling, a set of changes in electrical cellular activity and in the anatomical structure that contributes to perpetuating AF. Atrial fibrillation can be induced and maintained by different mechanisms, including rapid ectopic activity, single- and multiple circuit reentry.2–5 Haissaguerre et al.2 described spontaneous initiation of AF by one or more ectopic foci. Experimental studies have shown that AF can be triggered by different types of ectopic activity, a single focal discharge, a short burst of rapid depolarization, or a repetitive focal discharge; the continuous foci also help to maintain AF.2,6,7
On the other hand, Mandapati et al.3 identified microreentrant periodic sources maintaining AF. Jalife8 proposed the ‘rotor hypothesis’, which suggests that AF is triggered by a series of ectopic beats, whose wave fronts give rise to a rotor. The rotor works as a maintenance mechanism, activating the local tissue at high frequency, generating wave fronts that fragment and propagate.
Experimental and clinical studies have shown various degrees of spatiotemporal organization in the activation patterns during sustained AF. Areas of high frequency and high degree of organization have been proposed as critical regions for maintaining AF.3,9–11 These areas have been recently proposed as ablation targets to improve success rates in AF termination.12 To study the spatiotemporal organization of atrial arrhythmias different signal analysis techniques are being used, including the analysis of electrogram morphology,13–15 of dominant frequency (DF),11,12,16–19 and of the regularity or organization index (OI).20,21 However, the relationship between the mechanisms that initiate and maintain AF and the characteristics of electrograms recorded in different points of the atrial surface are still not fully understood due to limitations in experimental recordings. Such limitations include insufficient recording sites throughout the whole atria leading to inadequate recording resolution,22 or mappings of electrograms performed sequentially assuming temporal and spatial stability.12
In this study, we used a novel method to provide spectral information on AF patterns with very high spatial resolution. A realistic three-dimensional (3D) computer model of the human atria is used to simulate episodes of permanent AF triggered by both a transitory and a continuous source of high frequency. A second objective was to study the use of DF and OI maps in order to estimate the location of the continuous source of high frequency.
Methods
Three-dimensional model of human atria
A realistic 3D model of human atria that includes fibre orientation has been previously developed. The original set of surfaces of the model was obtained from Harrild and Henriquez.23 These surfaces were compared with normal human atrial structures previously published24–26 and histological observations, and were modified accordingly; see details of the model in ref.27 The model takes into account the main anatomical structures (see Figure 1A), electrophysiological heterogeneity, fibre orientation (Figure 1B), and anisotropy.
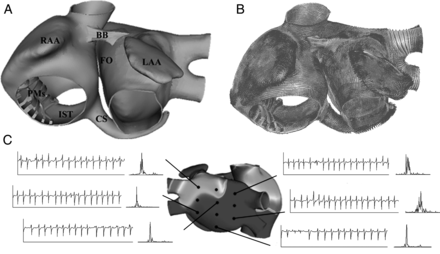
(A) Anterior view of the three-dimensional model of human atria. (B) Orientation of fibres in the model of human atria. (C) Examples of electrograms with their corresponding frequency spectrum, calculated in different points of the atria during atrial fibrillation. RAA and LAA, right and left atrial appendage; BB, Bachmann’s bundle; FO, fossa ovalis; PMs, pectinate muscles; CS, coronary sinus; IST, isthmus.
Electrophysiological model
The Nygren model28 of the human atrial action potential (AP) was implemented to reproduce the cellular electrical activity. The electrophysiological heterogeneity was included to reproduce AP in different parts of the atria:29 pectinate muscles (PM), crista terminalis (CT), atrioventricular rings, appendages (APG), and atrial working myocardium, which includes the rest of the atrial structures. The maximum conductance of It, IKr, and ICaL was modified in the Nygren's cellular model in order to obtain the different AP models as described in Tobón et al.27
Changes in conductance and kinetics of different ionic channels of human atrial cells observed in experimental studies of permanent AF30,31 have been incorporated into the AP model to reproduce electrical remodelling. Several parameters were changed,32 the conductance for IK1 was increased by 250% while the conductance for ICaL and It were decreased by 74 and by 85%, respectively, the kinetics of the fast inactivation of ICaL was increased by 62%, the activation curve of It was shifted by +16 mV, and the inactivation curve of INa was shifted by +1.6 mV. Table 1 shows the maximal conductance values for ICaL, It, IKr, and IK1 currents used for the different atrial zones under remodelled conditions.
Maximal conductance values for It, ICaL, IKr, and IK1 currents in different atrial zones under remodelled conditions
| CT | PM | APG | AVR | AWM | |
|---|---|---|---|---|---|
| gt,max | 1.6 | 1.2 | 0.6 | 1.2 | 1.1 |
| gCaL,max | 2.7 | 1.6 | 1.7 | 1.1 | 1.7 |
| gKr,max | 0.4 | 0.4 | 2.3 | 2.3 | 0.5 |
| gK1,max | 10.5 | 10.5 | 10.5 | 10.5 | 10.5 |
| CT | PM | APG | AVR | AWM | |
|---|---|---|---|---|---|
| gt,max | 1.6 | 1.2 | 0.6 | 1.2 | 1.1 |
| gCaL,max | 2.7 | 1.6 | 1.7 | 1.1 | 1.7 |
| gKr,max | 0.4 | 0.4 | 2.3 | 2.3 | 0.5 |
| gK1,max | 10.5 | 10.5 | 10.5 | 10.5 | 10.5 |
CT, crista terminalis; PM, pectinate muscles; APG, appendage; AVR, atrioventricular rings; AWM, atrial working miocardium.
Propagation and electrograms
The conductivity values were assigned such that conduction velocities obtained in the different zones of the atrium were within the ranges reported in the literature,34–36 and the anisotropic ratio was also assumed in agreement with experimental studies;35,37 see ref.27 for details.
The electrograms were processed (every millisecond) with a 40–250 Hz band-pass filter, rectified, and further low-pass filtered at 20 Hz.38 After this procedure, spectral analysis over the last 8 s of the signals was performed with fast Fourier transform obtaining a spectral resolution of 0.12 Hz.38 The DF corresponding to the highest peak in the power spectrum was determined. Figure 1C depicts examples of electrograms recorded in six different points of the atrial surface and the spectral analysis of the signals. Dominant frequency gradient was determined as the DF mean value difference between left (LA) and right atrium (RA). To measure the periodicity of the signal and the variability of frequency in the spectrum, the OI was also calculated. The spectral power of the DF and its three harmonics peaks were calculated by computing the area under their peaks over a 0.75 Hz window. The OI was obtained as the ratio of this spectral power to the total power of the spectrum.21,38 False colour DF and OI maps were constructed by assigning to each element a colour between blue, for the lowest values, and red, for the highest values observed.
Simulation protocols
Atrial fibrillation was generated by an S1–S2 protocol as follows: a train of stimuli with a basic cycle length (CL) of 1000 ms was applied during 10 s in the sinoatrial node (SAN) area to simulate the sinus rhythm (S1). Two different stimuli S2 were simulated. In the first one, after the last beat of the S1 stimulation, a burst of 6 ectopic beats (S2) was delivered at a CL of 130 ms in the ostium of the right pulmonary veins (RPV). In the second one, a continuous ectopic focus (S2) was delivered in the same location at equal CL. Subsequently, the continuous ectopic focus was delivered at CL of 130 ms, in different locations in the atria: CT, superior caval vein (SCV), coronary sinus (CS), and ostium of the left pulmonary veins (LPV). Once ectopic focus was applied, the simulation was maintained during 10 s.
Results
Dominant frequency and organization index maps during atrial fibrillation initiated by a transient and continuous focus
Upon application of the ectopic transitory focus (burst of six beats at high frequency) at the base of the RVP, different reentrant mechanisms maintaining the tissue in AF were observed. Initially, a rotor was triggered in the posterior wall of the LA, and fragmentation and collision of the activation fronts were observed in both atria. Subsequently, macroreentries were observed in LA and collisions of wave fronts mainly at the level of CT. At the end of the simulation a figure-of-eight reentry was formed in the posterior wall of the LA, which became a rotor, while fragmentation and collision of wave fronts continued in the RA. Figure 2A shows the DF map, with areas in both atria that were activated at different frequencies. However, said differences are subtle, and thus it is not possible to identify zones of either very high or very low frequency. The average DF in both atria was 5.8 Hz, and thus no DF gradient was observed between the RA and the LA (see Table 2).
Mean of dominant frequency and organization index, and dominant frequency gradient, obtained from simulated atrial fibrillation episodes, through application of ectopic foci (transitory and continuous) in different locations
| Focus location/type | DFm (Hz) (RA/LA) | DF gradient (Hz) | OIm (RA/LA) |
|---|---|---|---|
| RPV/transitory | 5.8/5.8 | 0 | 0.51/0.44 |
| RPV/continuous | 5.6/7.4 | 1.8 | 0.25/0.48 |
| LPV/continuous | 5.1/7.5 | 2.4 | 0.38/0.61 |
| CT/continuous | 5.9/5.6 | 0.3 | 0.32/0.36 |
| SCV/continuous | 5.8/5.2 | 0.6 | 0.31/0.36 |
| CS/continuous | 7.0/5.0 | 2.0 | 0.4/0.28 |
DFm, dominant frequency mean; OIm, organization index mean; RA, right atrium; LA, left atrium; RPV and LPV, right and left pulmonary veins; CT, crista terminalis; SCV, superior caval vein; CS, coronary sinus.
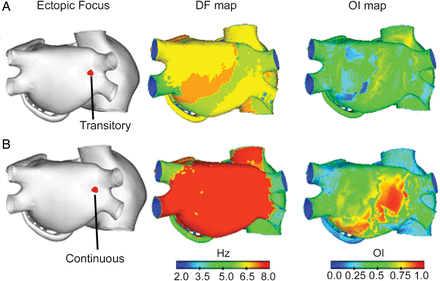
Dominant frequency maps (second column) and organization index maps (third column) during atrial fibrillation generated by an ectopic focus (A) transitory and (B) continuous, located in the ostium of the right pulmonary veins (first column).
The OI map shows a low degree of organization in both atria (Figure 2A). A few dispersed regions can be observed, mainly in areas near the CT, in the SCV, and posterior wall of the LA, which has OI values that are slightly higher, in the order of 0.7, but no zones with high OI values (close to 1) are observed. The OI average was slightly higher in the RA (0.51) than in the LA (0.44).
On application of the ectopic focus of continuous activity and high frequency in the same location as above (the base of the RPV), multiple fronts of reentry are observed, generally of the rotor type with irregular trajectories in RA, which collision and fragment, generating new activation fronts. The LA is activated relatively periodically by the ectopic focus, with wave fragmentation and collisions at multiple instances in the posterior, superior, and anterior walls. In the DF map (Figure 2B), it is observed that the LA is activated at high frequency (more than 7 Hz) and in a rather homogenous way throughout the LA, with the exception of some areas of the RPV, superior LPV, and small areas of the posterior wall, which are activated at lower frequencies. On the other hand, the RA is generally activated at a lower frequency than the LA, at around 5 Hz, with higher DF values in some SCV areas, tricuspid ring, and small dispersed zones in the isthmus and the free wall. The average DF in the RA was 7.4 Hz, equivalent to a CL of 135 ms, similar to that of the ectopic focus (130 ms). The average DF in the RA was 5.6 Hz, thus a DF gradient of 1.8 Hz was present between the RA and the LA (see Table 2).
The OI map (Figure 2B) shows a low degree of organization in practically all of the RA, with values of around 0.3 in some areas. In the LA a high degree of organization can be seen in part of the posterior wall and areas of the inferior wall, with the highest OI values (close to 1) at the site of application of the ectopic focus and in a neighbouring area, in the posterior wall. In the rest of LA the values are between 0.5 and 0.7. The average OI was higher in the LA (0.48) than in the RA (0.25). This indicates great variability in frequency in both atria (higher in the RA).
Dominant frequency and organization index maps during atrial fibrillation initiated by continuous foci in different locations
Different patterns of AF were induced when the continuous ectopic focus was applied to four different locations (LPV, CT, SCV, and CS). Multiple fragmented wave fronts are observed, mainly in the area of the CT and SCV, as well as collisions with the free wall of the RA. Rotor patterns with irregular trajectory and short duration are seen in areas such as the CT and the posterior LA wall. The posterior wall of the LA is activated relatively periodically when the ectopic focus is applied at the base of the LPV. In the other three cases the LA is activated by fronts coming from the RA, with collisions, short-lived rotors, and macroreentries. Additionally, conduction through the intra-atrial ways is occasionally blocked for a few instants.
Figure 3A shows a DF map obtained when focus application is performed at the base of the LPV. High-frequency (higher than 7 Hz) and practically homogeneous activation are observed throughout the LA, with the exception of certain areas of the mitral ring, which are activated at lower frequencies. On the other hand, the RA is being activated at a lower frequency than the LA, at around 5 Hz, and in an almost homogeneous way, except for small dispersed areas with either lower or higher DF values. The average DF in the LA was 7.5 Hz, equivalent to a CL of 133 ms, similar to that of the ectopic focus. The average DF in RA was 5.1 Hz, with a DF gradient of 2.4 Hz between RA and LA (see Table 2). The OI map shows a low degree of organization in practically all of the RA, with areas with values of around 0.5 and some areas with even lower values of around 0.25. In the LA a higher degree of organization is observed, practically in the totality of the posterior wall, although it is evident that the region with the highest OI values is located at the base of the LPV. Areas with slightly lower values can be seen in the anterior wall. The average OI was higher in the LA (0.61) than in the RA (0.38). These values indicate variability of frequencies in both atria (much higher in the RA).

First column: location of the ectopic focus. Second column: fibrillatory activity, the colour scale represents the range of values of the action potential in millivolts. The depolarizing front is identified by the red colour. Third column: dominant frequency maps, the colour scale represents the range of values of dominant frequency, with the highest values represented as red. Fourth column: organization index map, the colour scale represents the range of organization index values, with the highest values shown as red.
The DF map generated when the focus is applied in the CT (Figure 3B) indicates that the LA is being activated at different frequencies, between 5.0 and 6.5 Hz, except for the LPV, which are activated at lower frequency. In the RA two zones can be distinguished, one is activated at very high frequency (>7 Hz) and includes the CT, left lateral wall, part of the inferior wall, and a small area in the free wall. The rest of the tissue is activated at a frequency of around 5 Hz. The average DF in the LA was 5.6 Hz and in the RA was 5.9 Hz, with a 0.3 Hz DF gradient between RA and LA (see Table 2). The OI map shows a low degree of organization in practically the whole atrium, with values mostly below 0.5. A higher degree of organization can only be seen in three small areas of the CT, the free wall of the RA adjacent to the CT, and in the inferior caval vein; the highest OI values are observed in the area of application of the ectopic focus (CT). The average OI was slightly higher in the LA (0.36) than in the RA (0.32), thus indicating great variability in frequency in both atria.
Figure 3C shows the DF map generated when the focus is applied at the SCV. The LA is being activated at different frequencies, between 5.0 and 6.5, except in some areas of the VP, which are activated at lower frequencies. The RA is being activated mostly at frequencies between 5.0 and 6.0 Hz, except for one area, which is activated at a frequency >7.0 Hz, and includes the distal and anterior portions of the SCV, superior part of the RA free wall, and part of the right APG. The average DF in the LA was 5.2 Hz, and 5.8 Hz in the RA, with a 0.6 Hz gradient between the RA and the LA (see Table 2). The OI map shows a low degree of organization in practically the whole atrium, with areas with values mostly <0.5. Only in the SCV area, where the ectopic focus is localized, can a zone of higher organization be distinguished. The average OI was slightly higher in the LA (0.36) than in the RA (0.31).
The DF map shown in Figure 3D, when the focus was applied near the CS, shows that the LA is being activated at frequencies between 4.0 and 6.0 Hz. On the other hand, the RA is being activated mostly at higher frequencies, over 6.5 Hz, except for some areas in the SCV and in the region of the free wall of the RA adjacent to the CT. The average DF in the LA was 5. Hz, and 7.0 Hz in the RA, with a DF gradient of 2.0 Hz between the RA and the LA (see Table 2). The OI map shows a low degree of organization in practically the whole atrium, with areas with values mostly <0.5, with the exception of the cavo-tricuspid isthmus, near the base of the CS, where a higher degree of organization is noted. The average OI was higher in the RA (0.4) than in the LA (0.28).
Discussion
In this study AF episodes triggered by a source of a transitory (six beats) and a continuous high frequency were simulated, and the corresponding DF and OI maps were generated. The data indicate that OI maps provide better estimates than DF maps regarding the location of an ectopic focus of continuous high-frequency activity, during simulated episodes of permanent AF.
The arrhythmic source of high frequency was simulated as an ectopic focus with a CL of 130 ms, which is within the range of values documented by Haissaguerre et al.2 in the human atrium during ectopic activity capable of triggering AF. The presence of cellular types with automatic potential has been clearly demonstrated.39,40 Several studies have also demonstrated the role of ectopic foci in the initiation and maintenance of atrial arrhythmias.2,6,7
Dominant frequency and organization index maps during atrial fibrillation initiated by a transient and continuous focus
The AF resulting from applying the transitory ectopic focus at the base of the RPV was maintained by multiple reentry waves, which, when propagating in a tissue under electric remodelling conditions follow an activation frequency that is approximately constant along the entire atrium, and thus no zones with high values are observed in the DF map, thereby a DF gradient canno't be detected between the LA and the RA. This result is in agreement with several studies18,19 where no significant DF gradients were observed between the RA and the LA under permanent AF. Additionally, the OI map showed low values in both atria, without the presence of localized zones with high (i.e. close to 1) OI values.
On the contrary, upon application of the continuous ectopic focus, a more regular and stable behaviour was observed in the activation fronts in the LA, in comparison with the RA. Large areas of high DF values were observed, mainly in the LA, and no specific zone of higher frequency in the region of the ectopic focus could be distinguished. However, in the OI map, the highest OI values (close to 1) were observed at the site of application of the ectopic focus and in a neighbouring area, in the posterior wall of the LA. Takahashi et al.,38 in a study involving 25 patients, observed multiple fronts in the atrium, crashing and interacting with each other, and showing low OI values. In contrast, high OI values were associated with the source maintaining the AF.
Dominant frequency and organization index maps during atrial fibrillation initiated by continuous foci in different locations
In this study, upon application of ectopic foci of continuous activity at high frequency in the test zones, multiple reentry fronts were observed, crashing and fragmenting throughout the course of the simulation, which is characteristic of AF.3,15,22 The frequencies obtained during the study were between 5 and 7.7 Hz, which is within the range characteristic for AF in humans (5–8 Hz).41 The different frequencies obtained caused the appearance of DF gradients between the RA and the LA, ranging from 0.3 to 2.4 Hz. The high frequency of the ectopic focus precluded the rest of the atrium from continuing normal activation (1 : 1) and the blockade in conduction that is seen in different zones causes a reduction in DF in areas farther from the focal source, as has been suggested by several authors.11,12,18 Lin et al.,16 in studies on patients with different types of AF found DF gradients between regions of ectopic automatic activity, such as PV or SCV, and the rest of the atrial tissue. Ryu et al.,22 in studies using dogs, observed DF gradients ≥ 0.6 Hz.
In our simulations, the data show that the average DF was always higher in the atrium where the focal source was located. Several studies in which the AF was maintained by a focal source in the LA have reported higher DF values in LA than in the RA.10,11,16
Using DF maps, large zones with high DF values were identified in the atrium where the ectopic focus was applied. However, localized areas with higher frequency that would allow localization of the focal source could not be identified. Several studies have implemented DF maps for localization of focal sources during AF episodes,16,17 thus providing potential targets for ablation.11,12 However, it has been shown that ablation of such high DF sites is effective in paroxysmal AF, but not in cases of permanent AF.12,19 In paroxysmal AF, these studies have analysed the distribution of frequencies in multiple mapping sites, and demonstrated that those sites with higher DF co-related well with ectopic sites. The failure of this strategy in patients with permanent AF could be related to incomplete ablation, in which critical sites involved in maintaining the AF were not included, due to the ability of the remodelled atrium to be activated at a frequency similar to that of the source.19 With a shorter duration of the AP it is possible that much of the tissue neighbouring the focal source is able to continue a 1 : 1 activity, precluding localization of the focal source through DF maps in remodelled tissue.
On the other hand, OI maps generally show low values (<0.6) in most of both atria. Higher OI values (close to 1) are seen in smaller areas, always contained within high DF areas. Low OI values indicate irregular conduction patterns and great variability of frequency, while high OI values indicate a highly regular activity.20
For three of the five focus locations, at the base of the RPV and LPV, as well as CS, the areas with the highest OI values coincide with the site of application of the focus and neighbouring areas. The OI maps provide a better approximation of focus location than that offered by the DF maps. In the two other locations, CT and SCV, the area with the highest OI values is small and located in the area of application of the focus, allowing its precise localization. Experimentally, high OI values have been associated with the sources that maintain atrial activation.38
Our results suggest that OI maps provide more precise information than DF maps regarding the location of continuous ectopic sources in a substrate of electric remodelling.
It is important to remark that our results were obtained using a specific virtual atria and that they should be tested experimentally. Although, the 3D model of human atria includes a great number of anatomical and morphological details, it corresponds to a particular set of parameters (fibre direction, anisotropy, heterogeneity, etc. ). However, it is possible to observe simultaneously the electrograms in the entire atria with a great detail (in more than 43 000 points) that currently cannot be achieved by in vivo and in vitro studies. The DF and OI maps provide useful and complementary tools to investigate the dynamical behaviour of the different patterns of propagation during AF.
Conclusions
A computational model has been presented that will provide more information regarding the spectral characteristics of different patterns of AF. Using this method, it was observed that the use of OI maps provides a better approximation than DF maps in localizing continuous ectopic sources of high frequency during AF episodes in remodelled atria.
Conflict of interest: none declared.
Funding
This work was partially supported by the Plan Nacional de Investigación Científica, Desarrollo e Innovación Tecnológica, Ministerio de Ciencia e Innovación of Spain (TEC2008-02090); the Plan Avanza (Acción Estratégica de Telecomunicaciones y Sociedad de la Información), Ministerio de Industria Turismo y Comercio of Spain (TSI-020100-2010-469); the Programa Prometeo 2012 of the Generalitat Valenciana; and the Programa de Apoyo a la Investigación y Desarrollo of the Universitat Politècnica de Valencia (PAID-06-11-2002).
