


Abstract
Proper visualization of left atrial (LA) and pulmonary vein (PV) anatomy is of crucial importance during atrial fibrillation (AF) ablation. This two-centre study evaluated a new automatic computed tomography (CT)–fluoroscopy overlay system (EP navigator ® , Philips Medical Systems, Best, The Netherlands) and the accuracy of different registration methods.
Fifty-six consecutive patients (age: 56 ± 14) with symptomatic AF underwent contrast CT of the LA/PV prior to ablation. Three registration methods were evaluated and validated by comparison with LA angiography: (i) catheter registration : the placement of catheters in identifiable anatomical structures; (ii) heart contour : based on aligning the fluoroscopy heart contours and the 3D-rendered CT volume; and (iii) spine registration : based on automatically aligning the segmented CT spine on fluoroscopy. Computed tomography segmentation was achieved in all but one patient due to motion artefacts. The mean duration of segmentation was 10 min and average registration lasted 7 min. Catheter and heart contour registration were highly accurate (discrepancy of 1.3 ± 0.6 and 0.3 ± 0.5 mm, respectively) when compared with spine registration (17 ± 9 mm, P < 0.05). The EP navigator was helpful during trans-septal puncture, gave an internal view of the atria and allowed tracking of ablation lesions.
The EP navigator enabled accurate live integration of CT images and real-time fluoroscopy. Registration utilizing catheter placement or heart contours was stable and reliable.
Introduction
Catheter ablation of drug resistant and symptomatic paroxysmal and persistent atrial fibrillation (AF) is becoming the accepted standard of care. 1 Historically, fluoroscopy was the standard imaging modality used to guide ablation; however, it is limited by the inability to visualize the complex left atrial (LA) anatomy. Several techniques have been developed to assess anatomical landmarks allowing more accurate atrial mapping and ablation, such as intracardiac echocardiography, 2–4 3D electro-anatomical systems, 5–9 3D rotational angiography, 10 and 3D magnetic resonance imaging. 11 , 12 Various combinations are also possible between these technologies, giving additional benefits of the different systems. 13–19 One of the most promising techniques is overlaying of computed tomography (CT) scan and fluoroscopy, 20 , 21 which potentially combines the accuracy of CT with the real-time fluoroscopy. A previous study of CT–fluoroscopy image integration to guide catheter ablation of AF demonstrated decreased procedural and fluoroscopic times. 20
This two-centre study sought to evaluate a refined CT–fluoroscopy image overlay system and evaluate different registration methods to accurately match CT and fluoroscopic images.
Methods
Study population
From November 2006 to October 2007, a cardiac CT scan was performed prior to catheter ablation for symptomatic AF or LA tachycardia in 56 consecutive patients from two centres (29 patients were enrolled in Boston and 27 patients in Bordeaux). All patients gave informed consent.
Computed tomography imaging
An ungated 16 multislice CT scan (Sensation16, Siemens AG, Medical Solutions, Forchheim Germany) or a 64-slice multidetector CT scan (MX 8000 IDT, Philips Medical Systems, Best, The Netherlands) with retrospective gating was performed within 48 h prior to the procedure in all patients. A scouting CT centred on the carina was carried out before contrast injection (Iomeron 400, Bracco Imaging SpA, Milan, Italy or Omnipaque 370, GE Healthcare, Milwaukee, WI, USA) to allow positioning the region of interest in the LA. Contrast was then injected through an arm vein (2 cc/kg, 4 cc/s), and automatic image acquisition was triggered when an LA density ≥120 UH (bolus tracking technique) was detected. The CT scan extended from the aortic arch to the diaphragm. A slice thickness of 1 mm was reconstructed with a 50% overlap at 70% of the cardiac cycle.
Electrophysiological study
Anti-arrhythmic drugs, with the exception of amiodarone, were discontinued at least five half-lives before the procedure. Oral anticoagulation (target INR: 2–3) was maintained for at least 1 month prior to the procedure. Patients underwent transoesophageal echocardiography within 2 weeks prior to the procedure to exclude the presence of atrial thrombus (Bordeaux) or if therapeutic pre-procedural anticoagulation levels could not be verified (Boston).
An Electrophysiological study was performed in the fasting state with conscious sedation. The following catheters were introduced via the right femoral vein: (i) a steerable quadripolar catheter or a decapolar 5 mm electrode spacing catheter was positioned within the coronary sinus (CS); (ii) a 10 or 20-pole circumferential mapping catheter (Lasso, Biosense Webster, Diamond Bar, CA, USA) was introduced in the LA and stabilized by using a long trans-septal sheath that was continuously perfused with heparinized saline; (iii) ablation catheters included: 3.5 mm externally irrigated tip (Thermocool, Biosense Webster, Diamond Bar, CA, USA), or a non-irrigated 8 mm tip (Navistar DS, or Navistar RMT DS, Biosense Webster, Diamond Bar, CA, USA). Access to the LA was achieved by a trans-septal puncture.
For 29 patients, a remote magnetic catheter navigation system was used (the Niobe system, Stereotaxis, Inc., St Louis, MO, USA). Briefly, the catheter incorporates three magnets in the distal portion of the catheter along with a 8 mm tip ablation electrode (thermocouple) and a proximal ring electrode. The catheter was driven to the target locations within the heart by magnetic vectors created by two external magnets controlled by a computer.
Surface electrocardiograms and bipolar endocardial electrograms were continuously monitored and stored on a computer-based digital amplifier/recorder system with optical disk storage for off-line analysis. Intracardiac electrograms were filtered from 30 to 500 Hz and measured with computer-assisted callipers at a sweep speed of 100–150 mm/s.
EP navigator and fluoroscopy registration
The CT overlay package (EP navigator ® , Philips Medical Systems, Best, The Netherlands) consisted of an automatic CT 3D segmentation package (EP planner, Philips Medical Systems, Haifa, Israel) and the CT overlay software (Allura Xper FD10, Philips Medical Systems, Best, The Netherlands). The system allowed for real-time importing and viewing of the fluoroscopy imaging system and export of the CT overlay.
Computed tomography segmentation
Computed tomography studies were reconstructed on a freestanding workstation (Extended Brilliance Workstation version 2, Philips Medical Systems). The typical reconstructions included: thick slab maximum intensity projection pixel (MIP) images oriented along the axial and sagital planes of each pulmonary vein (PV); 3D renderings of the surface of the LA with and without the overlying aorta and oesophagus; endovascular views of the ostia of the PVs and posterior atrial wall; a thick section overlapping (10 mm× 5 mm) multiplanar reconstructions in the axial plane for evaluation of the oesophagus. In addition, all cases were interactively evaluated on a lung window in the axial plane using 8 mm thick MIP images. Unprocessed DICOM CT images were loaded into the CT overlay platform. The cardiac chambers (atria and ventricles), interatrial septum, and extracardiac structures of interest (aorta, spine, CS, and other thoracic veins) were automatically segmented ( Figure 1 ). The software-defined chamber margins were verified, and segmentation was manually optimized if necessary. The oesophagus was also manually segmented for evaluation in the last seven patients.
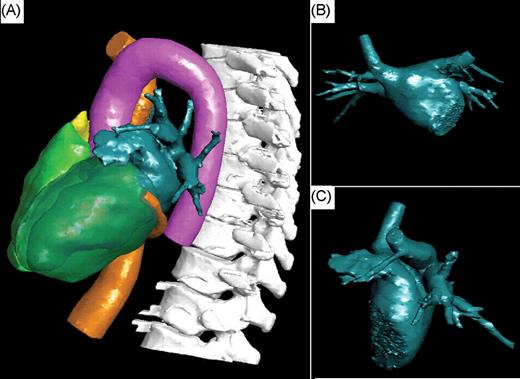
Visualization of the structures of interest automatically segmented by the software and manually optimized. ( A ) Left lateral view. Visualization of the left atrium (dark green), the inferior vena cava and coronary sinus (orange), the right and left ventricles (green), the right atrium (yellow), the aorta (pink), and the spine (white). ( B and C ) Antero-posterior and left lateral views of the segmented left atrium.
Commercial version
The commercial EP navigator package was used in Boston. This version enabled the overlay and registration of the LA image imported from the CT with the 2D fluoroscopy images. The transparency of the overlaid CT 3D volume was adjustable, allowing the visualization of the catheters in the fluoroscopic image. The CT-generated volume rotated on the screen following the rotation of the C-arm and allowing for constant visualization of the CT and fluoroscopic images under the same viewing angle.
Prototype version
In Bordeaux, a more advanced prototype version of the EP navigator was used. In addition to the features of the commercial version, this prototype enabled (i) viewing of all cardiac structures that could be segmented from the CT scan ( Figure 1 ); (ii) viewing of the inside of the CT volume (‘endoscopic view’) with a customizable cutting plane, allowing accurate definition of structures such as PV ostia and the intervenous ridge ( Figure 2 A ) or the ridge between the LA appendage and left PVs; (iii) correcting the 3D CT image dimensions in relation to the X-ray cone beam of the C-arm system, where objects closer to the X-ray source are projected larger than those closer to the C-arm's flat detector (so-called inverse perspective); (iv) segmenting the spine from the CT scan for registration by superimposing it on the fluoroscopic spine image ( Figure 1 ); (v) tagging catheter positions on the CT volume ( Figure 2 ). In addition, ablation points could be added manually. When this feature was activated, an imaginary line was automatically traced on the screen. The line passed through the tip of the catheter (where the operator clicked), connecting the X-ray source to the flat detector (epipolar line) and crossing the CT-rendered volume at different intersection points. The correct localization of the ablation catheter on the epipolar line was then chosen by the operator after confirmation on additional projection planes.
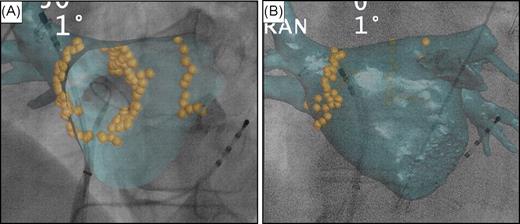
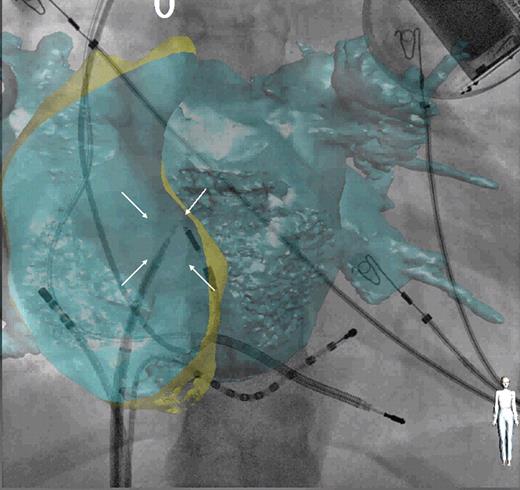
Tagging ablation points around the right and left pulmonary veins' ostia. ( A ) Quadripolar catheter inserted into the coronary sinus. Decapolar circumferential catheter inserted into the right inferior pulmonary vein and ablation catheter in the right superior vein. Internal view of the computed tomography volume (endoscopic view) showing the ostium of the right inferior pulmonary vein and the intervenous right ridge. ( B ) Decapolar circumferential catheter inserted into the right superior pulmonary vein and ablation catheter at the ostium of the right superior pulmonary vein.
Phantom model registration
The registration software was first validated with a cardiac plastic model (Merck & Co., Inc., Whitehouse Station, NJ, USA). Computed tomography images of the phantom were obtained for registration. Fluoroscopic images were then carried out with the phantom placed in the same position as during CT and by isocentring the model on the fluoroscopic screen. Image scaling and calibration was performed manually by adjusting the imported CT image on the fluoroscopic image. Registration accuracy was finally determined by the assessment of the overlapping between the images imported from the CT and the fluoroscopy images.
Fluoroscopy and computed tomography registration
The patient's position on the X-ray table was adjusted to achieve isocentring of the heart in two orthogonal fluoroscopic views before CT registration was performed. Three registration methods were evaluated by comparing with the ostial superior PV angiogram, which served as the reference. In patients who were in sinus rhythm at the time of the CT overlay, registration was carried out during the ventricular diastole. In detail, the evaluation of the CT registration was performed as follows:
The first registration method involved fluoroscopic identification of intracardiac landmarks by catheter manipulation ( Figures 3 and 4 ). Three catheters were positioned inside the heart: the ablation catheter and the circular mapping catheter were placed in different PVs and another catheter was placed in the CS. Alignment of all three catheters with PVs and the CS allowed for registration of the CT image on the live fluoroscopy ( Figure 3 ). Additional techniques to assess the overlay accuracy included: caudal drop of the catheter when withdrawing from a PV into the LA, this identified the PV ostium; insertion of the ablation catheter into readily identifiable anatomical landmarks (e.g. PV branches immediately connected to PV ostium, accessory PVs); and looping of the ablation catheter in the LA resulting in circumferential catheter-endocardium contact ( Figure 4 A ).
The second method relied on the manual alignment of the segmented heart with the cardiac contour on an antero-posterior fluoroscopic view (without contrast injection). Computed tomography volume overlay was first aligned by using the right lateral atrial contour (which was always well delineated on the fluoroscopic screen using high resolution mode). Then, the rest of the cardiac contour was superimposed on the fluoroscopic image, based on the best visual estimate ( Figure 5 ).
The third method (only available in the prototype version) was an automatic registration based on comparing the patient's spine from the segmented CT image and from the real-time fluoroscopy image.
An angiogram of the ostia of the right and left superior PVs (using 5–10 mL for each injection) in two orthogonal views served as a reference to evaluate each registration method ( Figure 4 B ). The distance between PV ostia on the CT volume and ostial PV angiograms was measured after completing each of the registration methods. A total of eight points were collected for each patient: four points per superior venous ostium (one at the superior part and one at the inferior part of the ostium in two orthogonal views). Following evaluation of accuracy of all registrations against PV ostial angiography, additional adjustments were finally performed, if necessary, by simple mouse ‘drag-and-drop’ based on the ostial PV angiogram in orthogonal views. Final adjustments were intended to achieve performance of the ablation procedure with the best accuracy, i.e. based on the PV angiogram. In the case of patient's movement during the procedure, repeat registration was performed using one of the first three described methods. No additional contrast was used to avoid toxicity.
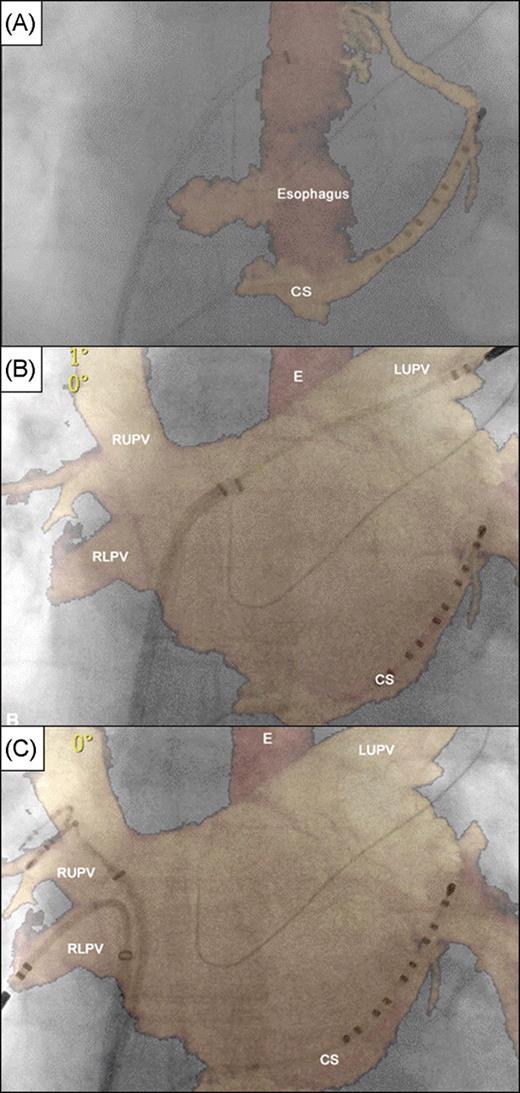
Registration based on coronary sinus and contralateral pulmonary veins using the commercial version. ( A – C ) Panels in antero-posterior fluoroscopic view showing segmentation of coronary sinus and oesophagus only with perfect registration of coronary sinus catheter ( A ) and subsequent adjustment based on introduction of catheters into left superior pulmonary vein ( B ) and right upper and lower pulmonary veins ( C ). E, oesophagus; CS, coronary sinus; LUPV, left superior pulmonary vein; RUPV, right upper pulmonary vein; and RLPV, right lower pulmonary vein.
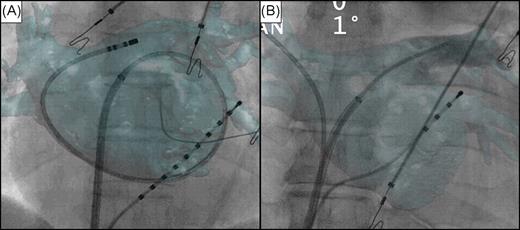
Validation of computed tomography registration. Antero-posterior fluoroscopic view with computed tomography overlay. Decapolar ( A ) and quadripolar ( B ) catheters inserted into the coronary sinus. ( A ) Registration based on catheter manipulation confirmed by looping a catheter in the left atrium accurately matching the overlaid computed tomography volume. ( B ) Ablation catheter placed into the right superior pulmonary vein. Contrast injection at the ostium of the left superior pulmonary vein shows a perfect alignment of both images.
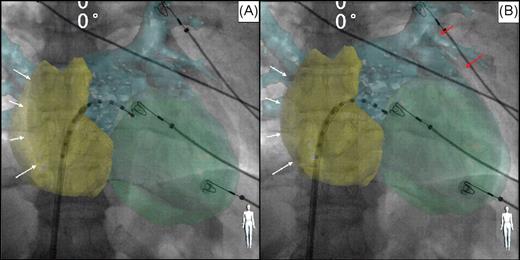
Example of computed tomography registration based on heart contour (including reconstruction of both atria and the left ventricle). Antero-posterior fluoroscopic view with computed tomography overlay. Decapolar catheter inserted into the left atrium through a trans-septal sheath. The computed tomography volume overlay was first aligned by using the right lateral atrial contour ( A and B , white arrows) and then the rest of the heart contour was superimposed visually, with assistance of high resolution fluoroscopy ( B , red arrows).
Statistical analysis
Normally distributed variables were described as mean ± standard deviation (M ± SD) and evaluated with Student's t -test; non-normal variables were described as median and interquartile range. We used χ2 and Fisher's exact tests for non-parametric variables and linear regression for continuous variables. A P -value <0.05 was considered statistically significant.
Results
Study population
There were 56 patients (39 males) with a mean age of 56 ± 14 (range 24–76): 38 patients (68%) had symptomatic drug refractory paroxysmal AF, 16 patients (29%) had persistent AF, and 2 patients (3%) had atrial tachycardia. The majority of patients had four PVs with separate ostia (two right and two left) (93%). Variant PV anatomy was noted in four patients (7%), left common ostium was present in three patients (5%), and an accessory vein insertion in the LA roof was noted in one patient (2%). The patients' characteristics are summarized in Table 1 .
Characteristics of the patients
| Study population ( n = 56) | Results |
|---|---|
| Age | 56 ± 14 (range 24–76) |
| Men | 39 (70%) |
| Paroxysmal AF | 38 (68%) |
| Persistent AF | 16 (29%) |
| Atrial tachycardia | 2 (3%) |
| Typical PV anatomy | 52 (93%) |
| Unusual PV anatomy | 4 (7%) |
| Parasternal LA diameter | 44 ± 9 (range 33–66) |
| LVEF (%) | 62 ± 11 (range 40–69) |
| Left ventricular diastolic diameter (mm) | 56 ± 5 (range 48–65) |
AF, atrial fibrillation; PV, pulmonary vein; LA, left atrial; and LVEF, left ventricular ejection fraction.
Phantom validation
After the manual overlay registration of the cardiac model, a total of 54 points, collected in 18 different views and separated by 5° (from AP to left lateral position), were taken on the fluoroscopic image of the model and correlated with the CT image. Points were collected at both left and right atrial contours and the ascending portion of the aorta. The maximal distance between related points was 1.2 ± 0.8 mm (range 0.5–2.2).
Computed tomography segmentation
Computed tomography segmentation was performed prior to the electrophysiological study in all patients. Utilizing automated software with subsequent manual correction, the mean duration of heart segmentation was 10 ± 3 min (range 4–17), including segmentation of LA, aorta, CS, right atrium, and both ventricles for all patients and segmentation of the oesophagus for seven patients.
Computed tomography segmentation was adequate and suitable for interpretation and measurements in 55/56 patients (98%). Computed tomography segmentation was ‘inadequate’ in one patient due to poor CT quality and image artefacts that prevented overlaying of the reconstructed image (with the ungated 16 slice CT scan). Manual oesophageal segmentation was successfully performed in the last seven patients. After CT volume registration based on catheter manipulation, close proximity between intraoperative oesophagogram and CT overlay oesophageal reconstruction was observed in all of these patients ( Figure 6 ). However, the small number of patients and known mobile properties of this structure did not allow for any firm conclusions on the utility of CT oesophageal overlay.
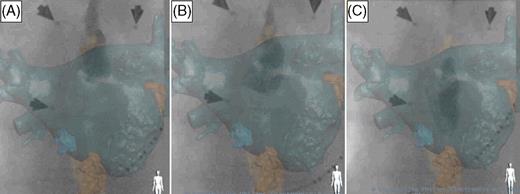
Example of oesophageal reconstruction and real-time oesophagus course outlined by barium swallow. Antero-posterior fluoroscopic view with computed tomography overlay of the left atrium and the oesophagus. Decapolar catheter inserted into the coronary sinus. Barium swallow showing a close match between the overlaid computed tomography image and the fluoroscopic image at different stages of contrast transit (from A to C ). Arrows on the images represent radio opaque markers used for alignment between Stereotaxis and CARTO systems.
Computed tomography registration
Computed tomography registration required 7 ± 2 min (range 3–11 min). The total procedure duration was not lengthened by CT registration as it was performed during patient preparation and catheter insertion.
The discrepancy between the CT overlay and the fluoroscopic image was 0.3 ± 0.5 mm (range 0–1.5) with heart contour registration, 1.3 ± 0.6 mm (range 0.5–4) with catheter registration, and 17 ± 9 mm (range 5–30) with spine registration, as validated by PV angiography.
Trans-septal puncture was performed using the CT–fluoroscopy overlay in 16 patients (29%), following either heart contour registration or CS-based registration. The utility of the CT overlay in assisting with the trans-septal puncture was assessed visually. This was made by comparing the position of the fossa ovalis (which could be visualized in all cases) on the CT overlay with the position of the trans-septal needle based on standard fluoroscopic landmarks ( Figure 7 ). This was considered to be adequate and suitable for interpretation in all patients. No complication occurred during any of the trans-septal punctures performed using CT–fluoroscopy overlay, with all punctures successful at the first attempt.
Example of trans-septal catheterization using computed tomography overlay. Antero-posterior fluoroscopic view with computed tomography overlay of both atria. Decapolar catheter positioned in the coronary sinus and ablation catheter in the right atrium. Trans-septal needle positioned onto the fossa ovalis (white arrows) before the puncture.
Discussion
Main findings
This study demonstrates the feasibility of an advanced overlay system between 3D CT anatomical information and 2D fluoroscopy, two widely available imaging modalities routinely utilized by electrophysiologists. The additional detailed information provided by the CT scan of LA anatomy assists with accurate catheter placement, potentially making the procedure safer and more efficient. The overlay can be performed quickly and can be repeated without the need for additional mapping if the patient moves during the procedure. Sra et al . 21 have recently described the use of CT–fluoroscopic registration to help in guiding ablation of atrial arrhythmias, particularly AF. They demonstrated shorter ablation and fluoroscopic times with CT overlay. 21 Computed tomography–fluoroscopy overlay adds considerably to the information normally available to the operator, compared with either image modality when used alone. As recently demonstrated, 22 visualization of the fossa ovalis may help when performing trans-septal punctures, particularly in patients with an unusual anatomy. Furthermore, this study confirms the possibility of identifying the oesophagus on the CT scan, which can subsequently be overlaid on the fluoroscopic images along with the cardiac structures. 23 This may decrease the risk of oesophageal fistula 24 by providing intraoperative assessment of oesophageal position ( Figure 6 ); however, this is limited due to its mobility. 25
Further technological developments since the early report from Sra have added new and potentially useful tools that were evaluated in the current study: (i) Endoscopic view and inverse perspective : this allows accurate visualization of the internal LA anatomy, which is particularly useful for ensuring ostial ablation of the PVs; (ii) Real-time tagging : this allows points to be logged on the registered CT shell overlay, based upon the position of the catheter on the CT image. This has many potential roles, for example, ablated areas around the PVs can be tagged and anatomical gaps can be visualized in case of persistent PV conduction after circumferential ablation.
Overlay registration
Accurate registration is essential for procedural success and safety. The use of a phantom model for registration of CT and fluoroscopy has already been validated with similar results (a discrepancy of 1.4 mm compared with 1.2 mm in the present study), 21 paving the way for in vivo evaluation of the system.
In the present study, ostial PV angiography was used as the validation tool. Fluoroscopic identification of intracardiac landmarks by catheter manipulation within the LA allowed an easy, accurate, and quick alignment of the CT-rendered volume with the fluoroscopic image. Registration based on the heart's contour allowed for rapid alignment of both images prior to either LA angiography or catheter placement within the PVs, enabling visualization of the fossa ovalis to aid trans-septal puncture. All these registration methods were easily repeated during the procedure in case of the patient's movement. In contrast, an automatic registration programme that matched the vertebrae on the CT scan to those on the fluoroscopic image while intuitively simple proved to be disappointing in practice. Manual adjustment of the imported LA image to a more superior position was always necessary, despite perfect spine alignment. This was probably due to the caudal displacement of the heart relative to the stationary spine during held inspiration at the time of the CT scan.
Clinical implications
Computed tomography overlay software technology can be used with any type of modern CT scan and combines advantages of different imaging modalities to improve procedural accuracy and safety. The potential benefits are: (i) detailed pre-procedural assessment of cardiac anatomy; (ii) facilitation of catheter manipulation and subsequent ablation, as well as determination of the true PV ostia and atypical anatomical variants; (iii) facilitation of a safe trans-septal puncture; (iv) assessment of oesophageal position during the procedure; (v) reduction of procedure and fluoroscopy duration. 20 Computed tomography-rendered volumes add a third dimension to an otherwise 2D procedure, allowing better delineation of the complex anatomy, simplification of catheter navigation, and increase in safety and efficacy of AF ablation. This technology could facilitate training of future electrophysiologists. Furthermore, it can be used in parallel with 3D electro-anatomical systems, including merge techniques, to help in guiding electrogram analysis as the CT scan can be incorporated into both.
Limitations of the study
This was a two-centre study with differences in CT scanning equipment and software version used, resulting in different quality of the CT scan used for segmentation. There was a learning curve inherent in evaluating an evolving technique.
Pulmonary vein angiography used for the validation of CT volume registration was performed only using superior PVs in order to reduce the contrast amount. This could have affected the discrepancy measurements and have resulted in less accurate registration. However, because the LA was isocentered on the fluoroscopic screen before the evaluation, the greater the distance of the measurements from the centre of the LA, the greater the discrepancy present. Therefore, we have hypothesized that if measurements were adequate at the periphery (at two opposite sites, i.e. right and left PV ostia), this was even more the case at the centre of the LA.
In addition, re-registration was often necessary because of patient or table movements, but registration methods were not re-evaluated in this case. The inclusion of repeated registration data for the same patient would have clouded the statistical analysis and their validation would have required additional contrast injections, which were considered unnecessary.
Finally, an automatic compensation for table movement was not available as yet, requiring repeated registration during the procedure.
Conclusion
This study demonstrates the feasibility of an advanced CT–fluoroscopy overlay system allowing accurate LA mapping, ablation, and facilitating trans-septal puncture. Ostial PV angiography provides optimal registration accuracy, whereas catheter manipulation and heart contour matching manoeuvres are reasonable alternatives.
Conflict of interest: S.K. is supported by the Belgian ‘Foundation for Cardiac Surgery’. M.D.O is supported by the British Heart Foundation. M. Hocini, M. Haïssaguerre, and P.J. have served on the advisory board of, and received lecture fees from, Biosense-Webster. G.H.M.G., P.J. and M.V.O. have received lecture fees from Philips Medical Systems. M.V.O. has received research grants from Philips Medical Systems.
Funding
This study was supported by a research grant from Philips Medical Systems.
