


Abstract
The effect of fibrate treatment on cardiovascular risk is inconsistent. This meta-analysis aimed to assess the effect of fibrates on major adverse cardiovascular outcome (MACE) reduction.
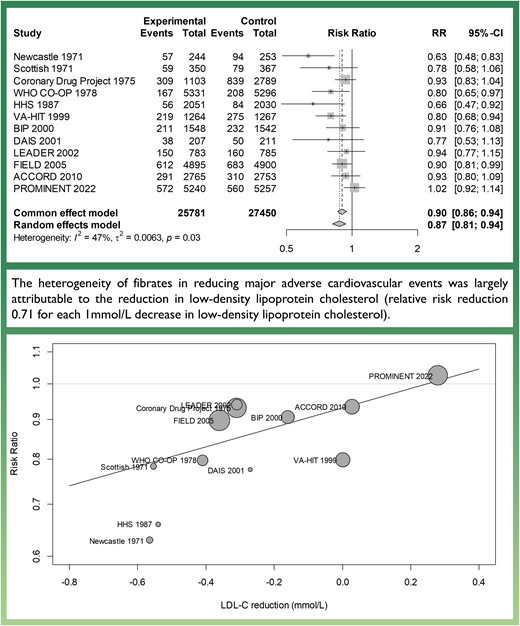
PubMed, Embase, and Cochrane library databases were searched up to February 2023 for randomized controlled trials comparing fibrate therapy against placebo and reporting cardiovascular outcomes and lipid profile changes. The primary outcome was the clinical outcomes of each trial that most closely corresponding to MACE, a composite of cardiovascular death, acute myocardial infarction, stroke, and coronary revascularization. A pre-specified meta-regression analysis to examine the relationship between the changes in lipid levels after fibrate treatment and the risk of MACE was also performed. Twelve trials were selected for final analysis, with 25 781 patients and 2741 MACEs in the fibrate group and 27 450 patients and 3754 MACEs in the control group. Overall, fibrate therapy was associated with decreased risk of MACE [RR 0.87, 95% confidence interval (CI) 0.81–0.94] with moderate heterogeneity (I2 = 47%). In meta-regression analysis, each 1 mmol/L reduction in low-density lipoprotein cholesterol (LDL-C) after fibrate treatment reduced MACE (RR 0.71, 95% CI 0.49–0.94, P = 0.01), while triglyceride level changes did not show a significant association (RR per 1mmol/L reduction 0.96, 95% CI 0.53–1.40, P = 0.86). A sensitivity analysis with the composite outcome of cardiovascular death or acute myocardial infarction produced similar results.
Treatment with fibrates was associated with decreased risk of MACE. The reduction in MACE risk with fibrate therapy appears to be attributable to LDL-C reduction rather than a decrease in triglyceride levels.
LDL-C, low-density lipoprotein cholesterol
Lay Summary
A systematic review and meta-analysis including 12 trials and 53 231 patients were performed to investigate the effect of fibrates on lowering cardiovascular risk. Overall, fibrate therapy was associated with significantly decreased risk of cardiovascular events. In further analysis, the decrease in cardiovascular risk achieved with fibrate treatment was found to be largely attributable to low-density lipoprotein cholesterol reduction.
Introduction
Apolipoprotein-B (ApoB) containing lipoproteins are known to be the essential cause of atherosclerosis. Among the ApoB lipoproteins, low-density lipoprotein cholesterol (LDL-C) is currently the major therapeutic target for lowering cardiovascular risk, and statins have been a cornerstone in lowering LDL-C. Other ApoB lipoproteins, including very low-density lipoprotein and intermediate-density lipoprotein, have more triglyceride than cholesterol content with a ratio of 5:1,1 and these particles are termed triglyceride-rich lipoprotein (TRL). High levels of TRL-cholesterol were associated with an increased risk of major adverse cardiovascular events (MACEs) even after background statin therapy, and the change in TRL-cholesterol levels was an independent predictor of MACE.2
Fibrates are agonists of peroxisome proliferator-activated receptor-alpha (PPAR-α) and lower triglyceride and TRL-cholesterol levels through modulation of transcription factors in various steps of lipid metabolism. Earlier clinical trials that evaluated the efficacy of clofibrate and gemfibrozil reported that fibrates reduced cardiovascular events.3–5 However, the more recent two trials of fenofibrate failed to show cardiovascular risk reduction in diabetes mellitus.6,7 Moreover, the recent trial evaluating pemafibrate, a more potent and selective PPAR-α agonist, did not lower the incidence of cardiovascular events in diabetic patients with hypertriglyceridaemia.8 There were considerable differences in baseline characteristics and clinical practice between the first trials conducted in 1971 and the last trial in 2022, as well as potential pharmacologic variability among the different fibrates, which may have been responsible for the conflicting results. In this study, we conducted a meta-analysis of published randomized trials to examine the effect of fibrates on cardiovascular risk reduction. We also performed a pre-specified meta-regression analysis to evaluate the association between the change in lipid levels after fibrate treatment to explain the variable result among fibrate studies.
Methods
Data search strategy and selection criteria
We conducted a systematic review and meta-analysis on randomized controlled trials that evaluated the effect of fibrates on cardiovascular outcomes according to the Preferred Reporting Items for Systematic reviews and Meta-Analyses guidelines9 (see Supplementary material online, Table S1). Studies were identified through searching the following databases: PUBMED (from 1950 to February 2023), Embase (from 1966 to February 2023), and the Cochrane Library database (Cochrane Central Register of Controlled Trials; no date restriction), using all terms of fibrates and cardiovascular diseases, limited to humans and randomized controlled trials (see Supplementary material online, Table S2). We also manually reviewed reference lists from the identified trials, review articles, and previous meta-analyses for additional data. All completed randomized controlled trials in English comparing the effect of fibrates with placebo were included, except for the following criteria: (i) small trials with <50 events during the duration of the trial, to exclude those with unreliable results, and (ii) trials without data on the baseline and achieved cholesterol levels. The study protocol was registered on PROSPERO (CRD42023396833).
Data extraction and quality assessment
Two authors (K.A.K. and E.-H.C.) independently extracted data using a structured form. The following information was obtained from each study: year of publication, target population (size, demographics, primary vs. secondary prevention), intervention (fibrate type, dose, duration of treatment), lipid levels (baseline, achieved) in each treatment group, and absolute numbers and odds ratios of outcomes of interest in each treatment group. The outcomes most closely corresponding to MACE (a composite of cardiovascular death, acute myocardial infarction, stroke, and coronary revascularization) were selected from each trial, which in some cases was a secondary composite endpoint for the original trial but explicitly reported in each study. The specific outcomes selected for our analysis are listed in Table 1. Risk of bias assessments was independently performed by two authors (K.A.K. and E.-H.C.) for each trial with the Cochrane Collaboration risk-of-bias-tool 2, including assessments of the randomization process, deviations from intended interventions, missing outcome data, measurement of the outcome, and outcome reporting assessments.10 Publication bias was assessed using funnel plots and Egger’s regression test. All disagreements were discussed and resolved by consensus.
Study characteristics of randomized clinical trials included in the meta-analysis
| Trial | Published year | Primary or secondary prevention | Treatment | Control | Number of patients | Follow-up durationa | Number of all-cause deaths | Number of cardiovascular deaths | Selected composite outpoint | Number of selected composite outpoint |
|---|---|---|---|---|---|---|---|---|---|---|
| Newcastle11 | 1971 | Secondary | Clofibrate 1.5 g/2.0 g | Placebo | 497 | 3.6 | NR | 75 | CV death or MI | 151 |
| Scottish12 | 1971 | Secondary | Clofibrate 1.6 g/2.0 g | Placebo | 717 | 3.4 | NR | 72 | CV death or MI | 138 |
| Coronary Drug Project13 | 1975 | Secondary | Clofibrate 1.8 g | Placebo | 3892 | 6.2 | 990 | 874 | CV death or MI | 1148 |
| WHO CO-OP3 | 1978 | Primary | Clofibrate 1.6 g | Placebo | 10627 | 5.3 | 289 | 70 | CV death or MI | 375 |
| HHS4 | 1987 | Primary | Gemfibrozil 1.2 g | Placebo | 4081 | 5 | 87 | 45 | CV death or MI | 140 |
| VA-HIT5 | 1999 | Secondary | Gemfibrozil 1.2 g | Placebo | 2531 | 5.1 | 418 | 211 | CV death or MI | 494 |
| BIP14 | 2000 | Secondary | Bezafibrate 400 mg | Placebo | 3090 | 6.2 | 313 | 183 | CV death or MI | 443 |
| DAIS15 | 2001 | Both | Fenofibrate 200 mg | Placebo | 418 | 3.3 | 15 | NR | All-cause death, MI, UA, or revascularization | 88 |
| LEADER16 | 2002 | Primary | Bezafibrate 400 mg | Placebo | 1568 | 4.6 | 399 | 151 | CV death, MI, or stroke | 310 |
| FIELD6 | 2005 | Both | Fenofibrate 200 mg | Placebo | 9795 | 5 | 679 | 267 | CV death, MI, stroke, or revascularization | 1295 |
| ACCORD7 | 2010 | Both | Fenofibrate 160 mg + simvastatin | Placebo + simvastatin | 5518 | 4.7 | 424 | 213 | CV death, MI, or stroke | 601 |
| PROMINENT8 | 2022 | Primary | Pemafibrate 0.2 mg b.i.d. | Placebo | 10497 | 3.4 | 813 | 266 | CV death, MI, stroke, or revascularization | 1132 |
CV, cardiovascular; MI, myocardial infarction; UA, unstable angina.
aEither median or average depending on report.
Lipid levels
To address the inconsistent efficacy of fibrates previously reported, we investigated the impact of changes in LDL-C, triglyceride, and high-density lipoprotein cholesterol (HDL-C) levels between baseline and post-treatment on the risk of MACE. The reported mean achieved differences in serum LDL-C levels between treatment arms were used to calculate the difference in LDL-C between fibrate treatment and placebo. If these data were not reported, the mean LDL-C values measured at the time point closest to half of the median duration of follow-up were used instead. In trials reporting only total cholesterol levels, the baseline LDL-C was estimated by a regression equation, baseline LDL-C = (baseline total cholesterol) ∗ [(baseline total cholesterol) ∗ 0.0012 + 0.3793], used in a previous meta-analysis by Silverman et al.17 and derived from trials reporting both LDL-C and total cholesterol. The achieved difference in LDL-cholesterol was estimated by multiplying the per cent total cholesterol reduction by 1.05 to calculate the per cent LDL-C reduction, a relationship derived from trials reporting values for both LDL-C and total cholesterol reduction.4,6,16 We used only the reported values of achieved differences for triglyceride and HDL-C because of the difficulty of estimating those values based on total cholesterol.
Statistical analysis
From each trial, odds ratios with 95% confidence intervals (CIs) were calculated from the total number of patients assigned to each group and the event numbers of the selected outcomes. Summary estimates of the risk ratio (RR) were calculated using both common-effect and random-effect models. The heterogeneity of the trials was assessed using the Cochrane Q test and the I2 statistics, with a P-value < 0.1 or I2 > 50% considered to indicate statistically significant heterogeneity. In addition to the pre-defined composite outcome corresponding to MACE, meta-analyses were also done for the outcomes of cardiovascular death, all-cause death, and the composite outcome of cardiovascular death or myocardial infarction. We also performed a pre-specified meta-regression analysis to examine the relationship between the changes in the absolute level of the lipid panel after treatment and the efficacy of fibrates on the risk of MACE. Meta-regression analysis was performed using a mixed-effect model and the restricted maximum-likelihood estimator for between-study variance. The effects of each 1 mmol/L change in lipid profile levels on MACE were estimated. As a sensitivity analysis, we conducted meta-regression analysis with each component of the primary outcome of interest: specifically, the composite of cardiovascular death and non-fatal myocardial infarction, and also for cardiovascular death and non-fatal myocardial infarction separately. All-cause death was used instead of cardiovascular death for the DAIS trial, since the trial did not report the incidence of cardiovascular death. Trial-level meta-regression was also performed for age, sex, diabetes mellitus, publication year, and fibrate type. A two-sided P-value < 0.05 was considered statistically significant. All statistical analyses were performed using R Statistical Software version 4.2.2 (R Foundation for Statistical Computing, Vienna, Austria).
Results
A comprehensive search of the literature identified 1971 articles, of which 36 were reviewed in full text. After exclusion, 12 randomized controlled trials were selected for final analysis (Figure 1). These trials included a total of 53 231 patients and 6315 MACEs. The year of publication spanned over 50 years, from 1971 to 2022, with the earlier trials on clofibrate conducted between 1971 and 1978 and the last PROMINENT trial in 2022 assessing pemafibrate (Table 1). In total, four studies assessed the effect of clofibrate,3,11–13 two studies gemfibrozil,4,5 two studies bezafibrate,14,16 three studies fenofibrate,6,7,15 and one study pemafibrate.8 The number of participants in the study ranged from 418 to 10 627. Four trials addressed a primary prevention population, four other trials were for secondary prevention, and the remaining four enrolled participants with and without previous cardiovascular conditions. Five trials enrolled only men, and four trials exclusively targeted the population with diabetes.
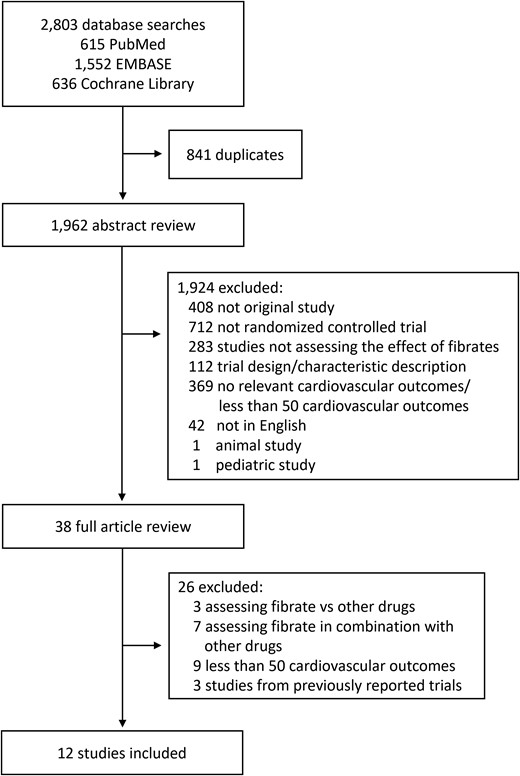
Identification process for eligible studies.
Overall, the risk of bias was low, but some of the earlier trials provided few details regarding the randomization process, blinding, or whether an intention-to-treat analysis was used. When assessed using Cochrane Collaboration risk-of-bias-tool 2, three trials were judged to have some concerns,11,15,16 and the remaining nine were at low risk of bias (see Supplementary material online, Figure S1).
The mean age of the participants ranged from 46 to 68 years, with a weighted mean average of 57 years (Table 2). The mean baseline LDL-C ranged from 2.04 mmol/L to 4.97 mmol/L, with a weighted mean average of 3.41 mmol/L. The more recent trials reported lower values, which could be interpreted as better baseline lipid control especially in the statin era. In the BIP, LEADER, and FIELD trials, new findings from landmark statin trials became available during the course of the trial. The BIP and FIELD trials allowed on-label addition of lipid modifying medications such as statins,6,14 while the commencement of statins in the LEADER trial led to drop-out.16 Meanwhile by the time of the ACCORD and PROMINENT trials, LDL-C lowering with statins was established as standard treatment for lowering cardiovascular risk. Therefore, these trials were designed to test the efficacy of fibrates in addition to statins.7,8 The mean difference in LDL-C between the fibrate-treated group compared to placebo ranged from −0.57 mmol/L to 0.28 mmol/L, with an average of 0.19 mmol/L. The earlier clofibrate trials showed the greatest reduction, while the most recent addition of pemafibrate conversely showed increased LDL-C. The average baseline triglyceride level was 2.08 mmol/L, and there was an average reduction of 0.55 mmol/L in the fibrate-treated group compared to placebo.
Baseline characteristics of patients enrolled in randomized treatment arms
| Trial | Mean age (years) | Men (%) | BMI (kg/m2) | DM (%) | HTN (%) | Current/former smoker (%) | CADa (%) | Mean blood pressure (systolic/diastolic, mmHg) | Other baseline lipid-lowering therapy (%) | Mean serum Cr (mg/dL) | Baseline LDL-C (mmol/L) | Between-group difference in achieved LDL-C (mmol/L) | Baseline TG (mmol/L) | Between-group difference in achieved TG (mmol/L) | Between-group difference in achieved HDL-C (mmol/L) |
|---|---|---|---|---|---|---|---|---|---|---|---|---|---|---|---|
| Newcastle11 | 53 | 80 | NR | NR | NR | 35/51 | NR | 140/85 | NR | NR | 4.42b | −0.57b | NR | NR | NR |
| Scottish12 | 52 | 83 | NR | NR | NR | 46/37 | NR | 140/89 | NR | NR | 4.97b | −0.55b | NR | NR | NR |
| Coronary Drug Project13 | 52 | 100 | NR | 5 | 65 | 38/24 | 24.5 | 130/82 | NR | NR | 4.45b | −0.31b | 2.00 | −0.67 | NR |
| WHO CO-OP3 | 46 | 100 | 26.7 | 0 | NR | 57/18 | 0.0 | 135/87 | NR | NR | 4.34b | −0.41b | NR | −0.50c | NR |
| HHS4 | 47 | 100 | 26.6 | 3 | 14.0 | 34/30 | 0.0 | 142/91 | NR | NR | 4.89 | −0.54 | 1.99 | −0.72 | 0.11 |
| VA-HIT5 | 64 | 100 | 29 | 25 | 57 | 21d | 100.0 | 132/77 | <1% | NR | 2.90 | 0.00 | 1.82 | −0.58 | 0.05 |
| BIP14 | 60 | 91 | 26.7 | 10 | 32.4 | 12d | 100.0 | 134/81 | 0.0e | NR | 3.85 | −0.16 | 1.64 | −0.28 | 0.16 |
| DAIS15 | 57 | 73 | NR | 100 | 51.4 | 15d | 47.8 | 140/82 | 0.0 | NR | 3.41 | −0.27 | 2.51 | −0.75 | NR |
| LEADER16 | 68 | 100 | NR | 17 | NR | 38/58 | 43.8 | 148/77 | 0.0 | 1.1 | 3.39 | −0.31 | 2.14 | −0.49 | 0.13 |
| FIELD6 | 62 | 63 | 29.8 | 100 | 56.6 | 9/51 | 17.1 | 141/82 | 0.0e | 0.9 | 3.08 | −0.36 | 1.74 | −0.52 | 0.04 |
| ACCORD7 | 62 | 69 | 32.3 | 100 | 83.8 | 15/36 | 36.6 | 134/74 | 64.5 | 0.9 | 2.61 | 0.03 | 1.83 | −0.35 | 0.02 |
| PROMINENT8 | 64 | 73 | 32.0 | 100 | 91.5 | 17d | 42.9 | NR | 95.8 | NR | 2.04 | 0.28 | 3.06 | −0.73 | 0.05 |
NR, not reported; BMI, body mass index; DM, diabetes mellitus; HTN, hypertension; CAD, coronary artery disease; Cr, creatinine; LDL-C, low-density lipoprotein cholesterol; TG, triglyceride; HDL-C, high-density lipoprotein cholesterol.
aDefined as previous myocardial infarction, angina, or other major angiographic coronary artery disease.
bCalculated using total cholesterol.
cNot measured for all patients.
dDoes not include former smokers.
eDuring the course of the trial, 12.0% of the population in the VA-HIT trial and 27.8% in the FIELD trial started other lowering lipid therapies, predominantly statins.
Across the 12 trials, 2741 (10.6%) MACEs occurred in the fibrate group and 3574 (13.0%) in the placebo group. Overall, fibrate therapy was associated with decreased risk of MACE with RR 0.87 (95% CI 0.81–0.94) compared to placebo (Figure 2A). There was moderate heterogeneity across the trials (I2 47%, Cochrane Q test P = 0.03). Although Egger’s regression test indicated some evidence of publication bias (P = 0.01, Supplementary material online, Figure S2), the trim-and-fill method was employed to adjust for this potential bias, resulting in a similar effect size estimate (RR 0.91, 95% CI 0.84–0.98, P = 0.02). There were no significant differences in results when excluding the largely historic clofibrate trials (Figure 2B) or when considering only secondary prevention trials (Figure 2D). However, the sub-analysis of primary prevention trials showed no significant efficacy of fibrates (Figure 2C). When considering other cardiovascular outcomes, treatment with fibrates was associated with a decreased risk of the composite outcome of cardiovascular death and non-fatal myocardial infarction (RR 0.86, 95% CI 0.79–0.94) and non-fatal myocardial infarction (RR 0.80, 95% CI 0.70–0.90), but not with a decreased risk of cardiovascular death (RR 0.95, 95% CI 0.88–1.03) or all-cause death (RR 1.01, 95% CI 0.95–1.08) (see Supplementary material online, Figure S3). In meta-regression analysis, there was a statistically significant association between the LDL-C change after treatment and the efficacy of fibrate therapy (Figure 3A). Each 1 mmol/L reduction in LDL-C level was associated with a reduction in MACE of RR 0.71 (95% CI 0.49–0.94, P = 0.01), indicating a significant association between LDL-C levels change and the risk of MACE. Adding LDL-C change to meta-regression reduced the between-study variance (τ2 from 0.0063 to 0.0027) and residual heterogeneity (I2 from 47% to 26%). The absolute change in LDL-C accounted for 57% of the between-study variability (R2). The test for residual heterogeneity (P = 0.24) showed that the mixed-effect model including LDL-C change adequately explained the variability among the studies included in the meta-analysis. LDL-C lowering was also significantly associated with decreased risk of the composite of cardiovascular death and non-fatal myocardial infarction (RR 0.62, 95% CI 0.36–0.86, P = 0.006) and non-fatal myocardial infarction (RR 0.45, 95% CI 0.05–0.74, P < 0.001), but not for cardiovascular death (Figure 3B–D).
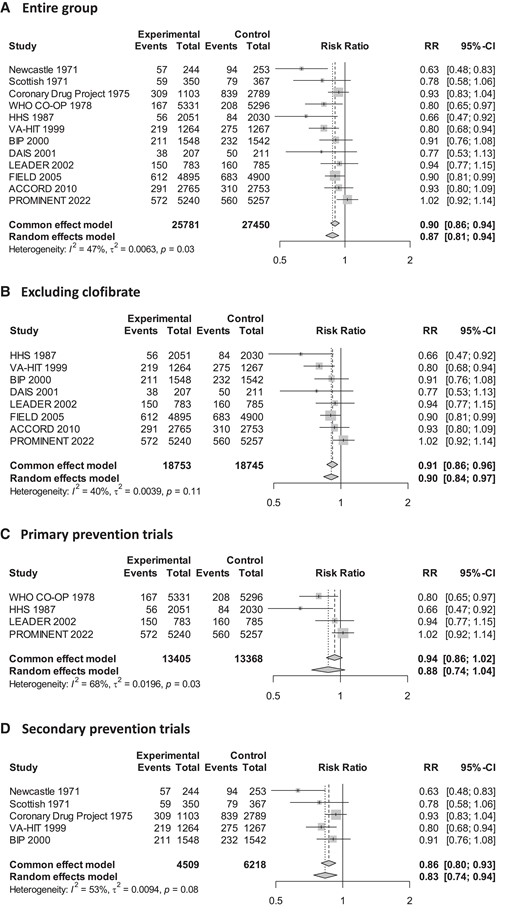
Effect of fibrates on risk of major adverse cardiovascular outcomes. CI, confidence interval.
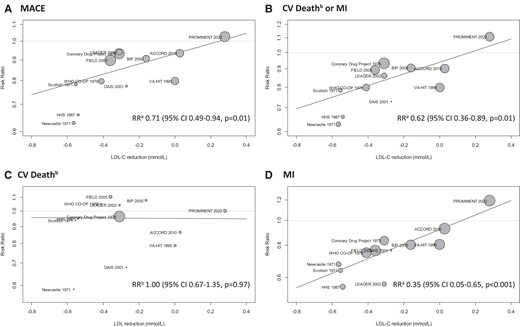
Meta-regression analysis for between-group achieved differences in low-density lipoprotein cholesterol levels and clinical outcomes. (A) For each 1 mmol/L reduction in low-density lipoprotein cholesterol. (B) All-cause death used instead of cardiovascular death for the DAIS trial. CV, cardiovascular; MI, myocardial infarction; LDL-C, low-density lipoprotein cholesterol; MACE, major adverse cardiovascular outcome; CI, confidence interval.
Meanwhile, a reduction in triglyceride levels was not associated with a significant reduction in MACE (P = 0.86) (Table 3, Supplementary material online, Figure S4). Reduction in HDL-C levels also did not show a clear correlation with cardiovascular event reduction. Lower baseline LDL-C was associated with reduced efficacy of fibrates with RR 1.08 (95% CI 1.01–1.14, P = 0.03) for each 1 mmol/L lower baseline LDL-C. The efficacy of fibrates decreased with more recent trials showing smaller effects (P = 0.03) while the proportion of men and those with diabetes mellitus did not show a clear trend. There was also no significant difference according to the type of fibrate used in each trial. Meta-regression with the composite endpoint of cardiovascular death and non-fatal myocardial infarction showed similar results. LDL-C reduction had a high degree of correlation with baseline LDL-C levels and publication year (Pearson correlation coefficient −0.89 and 0.82, respectively), while the publication year was highly correlated with baseline LDL-C (Pearson correlation coefficient −0.91) (see Supplementary material online, Table S3). Overall, meta-regression with the achieved reduction in LDL-C had the least amount of residual heterogeneity (I2) (Table 3).
Meta-regression analysis for between-group differences in lipid profiles and major adverse cardiovascular outcomes
| Variables | Trialsa | MACE | CV deathb or MI | ||||||
|---|---|---|---|---|---|---|---|---|---|
| RR | 95% CI | P-value | Residual heterogeneity (I2) | RR | 95% CI | P-value | Residual heterogeneity (I2) | ||
| LDL-C reductionc | 12 | 0.71 | 0.49–0.94 | 0.01 | 26% | 0.62 | 0.36–0.89 | 0.01 | 30% |
| TG reductionc | 10 | 0.96 | 0.53–1.40 | 0.86 | 36% | 0.98 | 0.35–1.41 | 0.66 | 44% |
| HDL-C reductionc | 7 | 1.32 | −0.44–3.07 | 0.72 | 50% | 1.55 | −0.67–3.77 | 0.62 | 60% |
| Baseline LDL-Cc | 12 | 1.08 | 1.01–1.14 | 0.03 | 35% | 1.09 | 1.01–1.17 | 0.03 | 43% |
| Mean aged | 12 | 1.10 | 1.00–1.20 | 0.06 | 42% | 1.10 | 0.98–1.22 | 0.11 | 50% |
| Proportion of mene | 12 | 0.98 | 0.93–1.03 | 0.37 | 47% | 0.97 | 0.91–1.03 | 0.33 | 52% |
| Proportion with DMe | 10 | 1.01 | 1.00–1.02 | 0.18 | 26% | 1.01 | 1.00–1.03 | 0.14 | 37% |
| Publication yeard | 12 | 1.04 | 1.01–1.08 | 0.03 | 34% | 1.05 | 1.00–1.10 | 0.03 | 42% |
| Fibrate type | 12 | 0.13 | 32% | 0.08 | 31% | ||||
| Bezafibrate | Reference | Reference | |||||||
| Clofibrate | 0.89 | 0.76–1.08 | 0.93 | 0.71–1.14 | |||||
| Fenofibrate | 0.98 | 0.78–1.17 | 1.00 | 0.77–1.23 | |||||
| Gemfibrozil | 0.81 | 0.57–1.05 | 0.84 | 0.59–1.10 | |||||
| Pemafibrate | 1.11 | 0.87–1.34 | 1.22 | 0.95–1.49 | |||||
MACE, major adverse cardiovascular outcome; CV, cardiovascular; MI, myocardial infarction; RR, risk ratio; LDL-C, low-density lipoprotein cholesterol; TG, triglycerides; HDL-C, high-density lipoprotein cholesterol; DM, diabetes mellitus.
aNumber of trials with reported or imputed values for each variable, respectively.
bAll-cause death used instead of cardiovascular death for the DAIS trial.
cPer each 1 mmol/L decrease.
dPer 10 year increase.
ePer 10% increase.
Discussion
This study presents a large systematic review and meta-analysis of 12 randomized clinical trials, involving 53 231 patients, to investigate the association between fibrate treatment and the risk of MACE. Our results show that fibrate treatment was associated with a significant reduction in MACE, largely driven by the reduction in non-fatal myocardial infarction, which is in contrast to the findings of recent large-scale randomized clinical trials.6–8 We observed that the magnitude of MACE risk reduction was proportional to the absolute reduction in LDL-C levels, which may explain the different findings observed in prior studies.
Even after optimal LDL-C reduction, there remains residual cardiovascular risk, and various targets including triglycerides have been identified in order to further decrease cardiovascular events. Triglyceride measurement in clinical laboratories is a biomarker for a family of TRL-cholesterol that includes remnant lipoproteins, among them chylomicron remnants, very low-density lipoprotein remnants, and intermediate-density lipoprotein, which can traverse the endothelium, accumulate, and promote atherogenesis.18 Elevated serum levels of triglycerides have been identified as an independent risk factor for atherosclerotic cardiovascular disease, including coronary heart disease, stroke, and peripheral arterial disease.19,20 Fibrates activate PPARα, which increases the expression of genes involved in fatty acid oxidation and the expression of hepatic lipoprotein lipase and decreases the expression of apolipoprotein CIII. This leads to increased clearance of triglyceride from the blood and decreased production of triglyceride by the liver, resulting in lower triglyceride levels. Therefore, previous guidelines recommended that treatment with fibrates may be considered, for the purpose of lowering cardiovascular risk through triglyceride reduction, in patients with triglyceride levels > 2.3 mmol/L.21 The main finding of this study is that the decrease in MACE risk with fibrate therapy appears to be attributable to LDL-C reduction rather than a decrease in triglyceride levels. Numerous clinical trials have repeatedly shown that, regardless of drug class, cardiovascular events are reduced directly in proportion to the reduction in LDL-C levels.17,22 In a previous meta-analysis investigating the effect of LDL-C lowering on cardiovascular risk, each 1 mmol/L lowering in LDL-C produced a reduction of RR 0.77. Also, each 88.6 mg/dL (1 mmol/L) reduction in triglyceride was associated with decreased cardiovascular risk with RR 0.54.17 In our analysis, the effect of LDL-C lowering was similar, with each 1 mmol/L lowering producing a reduction of RR 0.73. However, we did not find a significant relationship between triglyceride reduction and cardiovascular risk, which was mainly attributable to the PROMINENT trial where no cardiovascular risk reduction was demonstrated despite an 65 mg/dL triglyceride reduction.8 Such findings are not only observed in fibrate studies but also in the effects of other non-statin agents. Anacetrapib, a cholesteryl ester transfer protein inhibitor, was found to reduce the risk of MACE significantly, but the magnitude of this risk reduction was relatively small (8%) and appeared to be fully explained by 17% LDL-C reduction.23 The REDUCE-IT trial showed that icosapent ethyl, a highly purified ethyl ester of eicosapentaenoic acid, significantly reduced triglyceride levels and MACE in patients with high cardiovascular risk and elevated triglyceride levels. However, observed risk reductions did not relate to changes in triglyceride levels.24 Omega-3 fatty acids could not improve cardiovascular events among statin-treated patients with dyslipidaemia and high cardiovascular risk though triglyceride level was reduced by 12%.25
Fibrates can also reduce LDL-C levels in some patients by increasing LDL-C clearance or by altering low-density lipoprotein particle size and composition.26 However, the LDL-C lowering effect of fibrate therapy is inconsistent, and there are reports that when used in combination with statins, fibrates do not show an additional LDL-lowering effect.27,28 In this meta-analysis, the effect of LDL-C reduction varied among the included studies, which is thought to be related to patient characteristics, concomitant statin use, and the intensity of concomitant statin therapy. Fibrates increase lipoprotein lipase activity in the blood vessel by reducing apolipoprotein CIII rather than reducing hepatic triglyceride production when combined with statins. This would promote the delipidation and remodelling of TRL-cholesterol into LDL-C and increase serum LDL-C, which would be the reason that the LDL-C level was increased after fibrate treatment in the PROMINENT trial. In our analysis, both baseline LDL-C and the change in LDL-C levels showed a high degree of inverse correlation with the year of publication, suggesting better lipid control in the recent era and diminished efficacy of fibrates in reducing LDL-C in this population. Therefore, in the statin era, it is difficult to expect treatment with fibrates to have a beneficial effect, especially for the reduction of MACE, except in cases where very high triglyceride levels (≥5.65 mmol/L) carry a risk of pancreatitis.
However, it would be important to note that there is still potential for a reduction in MACE risk with triglyceride reduction. Mendelian randomization studies have shown that patients with the mutation of angiopoietin-like-protein (ANGPTL) 3 and apolipoprotein CIII, which are associated with TRL-cholesterol levels, had a lower risk of MACE.29,30 Inhibition of ANGPTL3 may increase lipoprotein lipase activity and the use of fatty acid in the oxidative tissues and decrease the remnant TRL-lipoprotein level in the blood.31 Meanwhile, inhibiting apolipoprotein CIII may also increase hepatic uptake of remnant TRL-cholesterol and decrease serum TRL-lipoprotein levels.32 Evinacumab, a monoclonal antibody targeting ANGPTL3, showed a significant decrease in both LDL-C and triglyceride levels by over 40% when added to patients with refractory hypercholesterolaemia in contrast to fibrates.33 Other new drugs targeting ANGPTL3 and apolipoprotein CIII using antisense oligonucleotide and small inferring ribonucleic acid showed promising effect on reducing TRL-cholesterol in phase I/II clinical trials and are currently under further development.34
Several limitations should be acknowledged in this analysis. First, individual patient-level data were not used for this analysis but would be unlikely to provide incremental information beyond data extracted from previously published reports. Secondly, the included studies were conducted over a span of more than 50 years, during which time background therapies have changed, potentially contributing to differences in absolute event rates between trials. Third, the components of MACE were not identical for every trial. Nonetheless, the impact of LDL-C cholesterol lowering on MACE was found to be similar to that observed in previous meta-analyses of statin trials.35 Also, additional analysis with the more homogeneous composite endpoint of cardiovascular death or non-fatal myocardial infarction reached similar conclusions.
Conclusion
In this meta-analysis, fibrates therapy was associated with the reduction of MACE, although moderate heterogeneity was observed among the included studies. Meta-regression analysis revealed that the inconsistent results observed were primarily explained by LDL-C change following treatment rather than triglyceride lowering. These findings suggest that the efficacy of fibrates observed in earlier trials may have been due to their ability to lower LDL-C, whereas in recent trials, the high frequency of statin use may have diminished the efficacy of fibrates.
Authors’ contributions
K.A.K.: formal analysis, data curation, software, writing (original draft), validation. N.J.K.: data curation, investigation, methodology. E.-H.C.: conceptualization, formal analysis, data curation, writing (original draft and editing), validation, supervision.
Supplementary material
Supplementary material is available at European Journal of Preventive Cardiology.
Funding
The authors received no financial support for the research, authorship, and publication of this article.
Data availability
All data underlying this article are available in the article and in its online supplementary material.
References
Author notes
Conflict of interest: None declared.

Comments