


Abstract
The aim of this study was to assess the association between triglyceride (TG) levels and cardiovascular disease (CVD) mortality concerning low-density lipoprotein cholesterol (LDL-C) and age in the general population.
From the Korean National Health Insurance Service database, 15 672 028 participants aged 18–99 who underwent routine health examinations were followed up for CVD mortality. Hazard ratios for CVD mortality were calculated using Cox models after adjusting for various confounders. During a mean of 8.8 years of follow-up, 105 174 individuals died of CVD. There was a clear log-linear association between TG and overall CVD mortality down to 50 mg/dL. Each two-fold increase in TG was associated with 1.10-fold (overall CVD), 1.22-fold [ischaemic heart disease (IHD)], 1.24-fold [acute myocardial infarction (AMI)], and 1.10-fold (ischaemic stroke) higher CVD mortality. Haemorrhagic stroke and heart failure were not associated with TG levels. The impact of hypertriglyceridaemia (HTG) on CVD weakened but remained present in persons with LDL-C < 100 mg/dL, in whom each two-fold higher TG was associated with 1.05-fold (overall CVD), 1.12-fold (IHD), 1.15-fold (AMI), and 1.05-fold (ischaemic stroke) higher CVD mortality. The younger population (18–44 years) had stronger associations between TG levels and mortality from overall CVD, IHD, and AMI than the older population.
Hypertriglyceridaemia independently raises CVD mortality with lingering risks in young and older individuals with low LDL-C levels, suggesting the importance of management of HTG even with controlled LDL-C.
Lay Summary
This prospective study evaluated the association between triglyceride (TG) levels and cardiovascular disease (CVD) mortality in the general population, particularly in individuals with well-controlled low-density lipoprotein cholesterol (LDL-C) levels.
The TG levels log-linearly increased the mortality from CVD, especially ischaemic heart disease and ischaemic stroke, down to at least 50 mg/dL (0.56 mmol/L), as residual CVD risks associated with high TG were apparent in individuals, even with LDL-C < 100 mg/dL (2.59 mmol/L).
Maintaining TG levels below 100 mg/dL may be beneficial even in seemingly low-risk groups, such as young people with normal or optimal LDL-C levels.
See the editorial comment for this article ‘Hypertriglyceridaemia and cardiovascular mortality: insights from a large-scale study’, by H. Patel et al., https://doi.org/10.1093/eurjpc/zwad391.
Introduction
Hypertriglyceridaemia (HTG) is frequently encountered in daily practice occurring in up to 15–20% [triglycerides (TGs) ≥ 200 mg/dL] of the general adult population.1–3 Despite dozens of prior studies, however, the role of HTG in cardiovascular disease (CVD) remains controversial. Some consider HTG as a strong independent risk factor that may have a dose-dependent association with CVD risk,4–7 while others consider it only an indirect surrogate marker that simply reflects other true risk factors.8–11
In current guidelines, management of HTG per se is not a primary concern12–14; furthermore, no optimal target levels of TG are recommended. Thus, practice-to-practice variability inevitably occurs in real-world clinical practice15 especially in the management of persons with HTG with acceptable low-density lipoprotein cholesterol (LDL-C) levels. Few studies have investigated the risk associated with HTG according to LDL-C levels, especially in individuals with LDL-C levels below 100 mg/dL, making this a grey area in clinical practice. It is unclear whether HTG increases CVD mortality in persons with acceptable or, more importantly, optimal LDL-C levels (<100 mg/dL).
Therefore, the aim of this study is to evaluate the association between TG levels and CVD mortality, including atherosclerotic CVD (ASCVD) subtypes such as ischaemic heart disease (IHD), acute myocardial infarction (AMI), and ischaemic stroke. Other CVD subtypes, such as haemorrhagic stroke and heart failure (HF), were also examined, as limited data are available for these subtypes. Finally, we examined whether associations exist in persons with optimal LDL-C levels and whether the associations differ according to LDL-C levels, sex, and age groups.
Methods
Study population and follow-up
In South Korea, the obligatory health insurance provided by the National Health Insurance Service (NHIS) covers 97% of the nation’s population and includes biennial health screenings. From 2009 to 2019, 17 733 108 individuals between 18 and 99 years of age received routine health examinations. Those with incomplete information (n = 472 530) or pre-existing records of heart disease, stroke, or cancer (n = 1 401 077) were excluded. After further exclusion of 187 473 persons prescribed TG-lowering agents, the remaining 15 672 028 participants were followed up until 31 December 2018, through the national death statistics for CVD mortality (see Supplementary material online, Figure S1). The International Classification of Diseases 10th Revision was used to define death from CVD (I00–I99), and subtypes of CVD were classified into IHD (I20–I25), AMI (I21), total stroke (I60–I69), haemorrhagic stroke (I60–I62), ischaemic stroke (I63), and HF (I50). The study received approval from the Institutional Review Board of Catholic Kwandong University, which waived the requirement for informed consent due to the anonymized nature of the data provided by the NHIS.
Data collection
Fasting serum samples were analysed for glucose, TG, high-density lipoprotein cholesterol (HDL-C), and total cholesterol levels via enzymatic methods. The Friedewald equation was used to calculate LDL-C. Measurements of systolic blood pressure (SBP) were made with participants in a seated position after they had rested for at least 5 min. Measured values for weight and height were used to calculate body mass index (BMI; kg/m2).16 A questionnaire was administered to gather information on participants’ known history of cancer, stroke, or heart disease; physical activity; alcohol consumption; and smoking history. A standardized protocol developed by the government was used to collect data. The clinical chemistry measurement methods were regularly checked through external quality assessments.17
Statistical analysis
Triglyceride levels were categorized into 11 groups [mg/dL; <50, 50–74 (reference), 75–99, 100–124, 125–149, 150–174, and 175–199 by 25 mg/dL intervals and 200–349, 350–499, 500–749, and ≥750] and into six groups [mg/dL; <50, 50–99 (reference), 100–149, 150–199, 200–499, and ≥500). Log risk was regressed on log2-transformed TG as a continuous variable, yielding hazard ratios (HRs) per two-fold increase in TG (see Supplementary material online, Figure S3). An analysis using a restricted cubic spline transformation of TG with five pre-defined knots (5th, 27.5th, 50th, 72.5th, and 95th percentiles) was also performed to examine non-linear associations. P-values for non-linearity were assessed with the likelihood ratio test, in which the model with only a linear term was compared with the model with cubic spline terms.
The HRs and confidence intervals (CIs) for mortality were calculated using Cox proportional hazard models stratified by baseline age (years: 18–24, 25–34, 35–44, 45–54, 55–64, 65–74, 75–84, or 85–99) using the STRATA statement.18 In the multivariable model, the following variables were adjusted for age (continuous variable within each age stratum), sex, income status [quartile: 1st (low income), 2nd, 3rd, and 4th], smoking status (current smoker, former smoker, never smoker, or missing information), alcohol use frequency (days/week; <1, 1–2, 3–4, 5–7, or missing information), physical activity [moderate (≥30 min) or vigorous (≥20 min) activity per week; none, 1–2 and ≥3 times), SBP (continuous variable), diabetes status [normoglycaemia (fasting glucose < 100 mg/dL), impaired fasting glucose (100–125 mg/dL), and diabetes (≥126 mg/dL or prevalent diabetes)], BMI (<18.5, 18.5–24.9, 25–29.9, or ≥30 kg/m2), cholesterol-lowering agent use [yes/no; at least one prescription of statins (including atorvastatin, fluvastatin, lovastatin, pitavastatin, pravastatin, rosuvastatin, and simvastatin) or ezetimibe within 6 months before the health examination date, based on information from the prescription database of the NHIS], LDL-C (continuous variable), and HDL-C levels (<40, 40–59, or ≥60 mg/dL). In the Cox model for CVD mortality, the cause-specific hazard method was used to handle competing risks; individuals who experienced other causes of death or reached the end of the follow-up were treated as censored. Schoenfeld residuals were used to test the proportional hazard assumption. Subgroup analyses by age and sex, as well as various categorical, spline, and linear analyses, served as sensitivity analyses. Cochran’s Q statistic was calculated to examine the difference in the effect size of each two-fold increment of TG between age, sex, and LDL-C groups. All P-values were two sided. All analyses used SAS version 9.4 (SAS Institute Inc., Cary, NC, USA).
Results
Study population
During a mean of 8.8 years of follow-up, 105 174 individuals died from CVD. The participants’ mean age was 47.3 years and 52.1% were female (Table 1). The mean LDL-C, HDL-C, non-HDL-C, and TG levels were 113.9, 55.2, 140.4, and 132.0 mg/dL, respectively. Higher TG levels, in general, were related with frequent alcohol use, current smoking status, higher levels of BMI, higher SBP, higher fasting glucose, higher non-HDL-C, and lower levels of HDL-C.
Participants’ characteristics at baseline by six triglyceride categories
| Variables | Characteristics | TG <50 mg/dL | 50–99 mg/dL | 100–149 mg/dL | 150–199 mg/dL | 200–499 mg/dL | ≥ 500 mg/dL | |
|---|---|---|---|---|---|---|---|---|
| <1.42 mmol/L | 1.42–1.80 mmol/L | 1.81–2.19 mmol/L | 2.20–2.58 mmol/L | 2.59–2.96 mmol/L | 2.97–3.35 mmol/L | |||
| n = 15 672 028 | n = 1 090 192 | n = 5 899 645 | n = 4 165 876 | n = 2 123 161 | n = 2 255 481 | n = 137 683 | ||
| Age | Years | 47.3 ± 13.9 | 40.3 ± 13.2 | 45.4 ± 14.0 | 49.3 ± 13.9 | 50.0 ± 13.5 | 49.1 ± 13.0 | 46.7 ± 11.7 |
| Log2-transformed TG | mg/dL | 6.8 ± 0.8 | 5.3 ± 0.3 | 6.2 ± 0.3 | 6.9 ± 0.2 | 7.4 ± 0.1 | 8.1 ± 0.3 | 9.3 ± 0.3 |
| Triglyceride (TG) | mg/dL | 132.0 ± 92.1 | 41.1 ± 6.5 | 74.6 ± 14.0 | 121.9 ± 14.4 | 171.9 ± 14.4 | 275.3 ± 68.2 | 653.4 ± 165.1 |
| TG (median, Q1–Q3) | mg/dL | 107 74–161 | 42 37–46 | 75 63–83 | 121 109–134 | 171 159–184 | 254 222–310 | 601 540–714 |
| HDL-Ca | mg/dL | 55.2 ± 13.8 | 64.0 ± 14.4 | 59.3 ± 13.6 | 54.2 ± 12.6 | 50.6 ± 12.0 | 47.3 ± 11.6 | 42.9 ± 12.3 |
| LDL-Ca | mg/dL | 113.9 ± 33.8 | 100.9 ± 27.6 | 112.1 ± 30.8 | 119.7 ± 33.7 | 120.7 ± 34.9 | 110.6 ± 37.7 | 69.6 ± 43.0 |
| Non-HDL-Ca | mg/dL | 140.4 ± 13.8 | 109.6 ± 14.4 | 127.3 ± 13.6 | 144.3 ± 12.6 | 155.1 ± 12.0 | 165.2 ± 11.6 | 194.8 ± 12.3 |
| Total cholesterola | mg/dL | 195.6 ± 36.9 | 173.5 ± 30.3 | 186.6 ± 32.9 | 198.5 ± 35.3 | 205.7 ± 36.7 | 212.5 ± 38.6 | 237.8 ± 49.5 |
| Body mass index | kg/m2 | 23.7 ± 3.5 | 21.6 ± 2.7 | 22.7 ± 3.3 | 24.0 ± 3.3 | 24.8 ± 3.8 | 25.4 ± 3.4 | 25.9 ± 3.1 |
| Fasting glucoseb | mg/dL | 97.2 ± 23.7 | 89.7 ± 14.6 | 93.6 ± 18.2 | 97.8 ± 22.7 | 100.7 ± 26.1 | 105.0 ± 32.1 | 116.9 ± 48.2 |
| Systolic blood pressure | mm Hg | 122.2 ± 15.1 | 115.0 ± 13.5 | 119.2 ± 14.6 | 123.5 ± 14.9 | 125.7 ± 14.9 | 127.6 ± 14.9 | 130.2 ± 15.2 |
| Sex | Women | 8 169 532 (52.1) | 317 624 (29.1) | 2 485 798 (42.1) | 2 291 711 (55.0) | 1 338 193 (63.0) | 1 620 819 (71.9) | 115 387 (83.8) |
| Smoking status | Never smoker | 9 553 926 (61.0) | 862 034 (79.1) | 4 085 594 (69.3) | 2 471 042 (59.3) | 1 108 863 (52.2) | 983 355 (43.6) | 43 038 (31.3) |
| Past smoker | 2 161 956 (13.8) | 90 795 (8.3) | 681 051 (11.5) | 612 785 (14.7) | 350 591 (16.5) | 401 511 (17.8) | 25 223 (18.3) | |
| Current smoker | 3 879 691 (24.8) | 132 702 (12.2) | 1 101 992 (18.7) | 1 062 044 (25.5) | 653 643 (30.8) | 860 500 (38.2) | 68 810 (50.0) | |
| Missing | 76 455 (0.5) | 4661 (0.4) | 30 998 (0.5) | 20 005 (0.5) | 10 064 (0.5) | 10 115 (0.4) | 612 (0.4) | |
| Alcohol use, | <1 day/week | 8 033 840 (51.3) | 608 667 (55.8) | 3 231 810 (54.8) | 2 185 218 (52.5) | 1 032 261 (48.6) | 937 657 (41.6) | 38 227 (27.8) |
| frequency | 1–2 days/week | 5 419 646 (34.6) | 387 826 (35.6) | 2 005 142 (34.0) | 1 394 231 (33.5) | 739 006 (34.8) | 839 439 (37.2) | 54 002 (39.2) |
| 3–4 days/week | 1 476 508 (9.4) | 60 708 (5.6) | 433 169 (7.3) | 389 666 (9.4) | 237 698 (11.2) | 325 633 (14.4) | 29 634 (21.5) | |
| 5–7 days/week | 601 147 (3.8) | 21 515 (2.0) | 171 700 (2.9) | 160 625 (3.9) | 96 661 (4.6) | 135 729 (6.0) | 14 917 (10.8) | |
| Missing | 140 887 (0.9) | 11 476 (1.1) | 57 814 (1.0) | 36 136 (0.9) | 17 535 (0.8) | 17 023 (0.8) | 903 (0.7) | |
| Physical activity | No | 7 713 875 (49.2) | 524 749 (48.1) | 2 899 563 (49.1) | 2 064 196 (49.6) | 1 051 900 (49.5) | 1 107 837 (49.1) | 65 630 (47.7) |
| 1 day/week | 3 125 766 (19.9) | 221 894 (20.4) | 1 170 200 (19.8) | 811 557 (19.5) | 421 482 (19.9) | 470 467 (20.9) | 30 166 (21.9) | |
| ≥2 days/week | 4 832 387 (30.8) | 343 549 (31.5) | 1 829 872 (31.0) | 1 290 123 (31.0) | 649 779 (30.6) | 677 177 (30.0) | 41 887 (30.4) | |
| Age group, years | 18–44 | 7 030 252 (44.9) | 710 680 (65.2) | 2 959 250 (50.2) | 1 616 187 (38.8) | 785 723 (37.0) | 894 317 (39.7) | 64 095 (46.6) |
| 45–64 | 6 664 429 (42.5) | 322 578 (29.6) | 2 319 729 (39.3) | 1 906 974 (45.8) | 999 243 (47.1) | 1 053 846 (46.7) | 62 059 (45.1) | |
| 65–99 | 1 977 347 (12.6) | 56 934 (5.2) | 620 656 (10.5) | 642 715 (15.4) | 338 195 (15.9) | 307 318 (13.6) | 11 529 (8.4) | |
| Income status, | 1 (low-income) | 3 227 150 (20.6) | 257 771 (23.6) | 1 277 594 (21.7) | 838 851 (20.1) | 406 565 (19.1) | 420 290 (18.6) | 26 079 (18.9) |
| quartile | 2 | 3 362 844 (21.5) | 283 075 (26.0) | 1 333 423 (22.6) | 849 054 (20.4) | 418 207 (19.7) | 449 409 (19.9) | 29 676 (21.6) |
| 3 | 4 187 747 (26.7) | 283 419 (26.0) | 1 539 573 (26.1) | 1 105 916 (26.5) | 578 766 (27.3) | 639 153 (28.3) | 40 920 (29.7) | |
| 4 | 4 894 287 (31.2) | 265 927 (24.4) | 1 749 045 (29.6) | 1 372 055 (32.9) | 719 623 (33.9) | 746 629 (33.1) | 41 008 (29.8) | |
| Body mass index, | <18.5 | 612 984 (3.9) | 111 753 (10.3) | 356 818 (6.0) | 104 008 (2.5) | 25 262 (1.2) | 14 382 (0.6) | 761 (0.6) |
| kg/m2 | 18.5–24.9 | 10 114 101 (64.5) | 861 270 (79.0) | 4 325 453 (73.3) | 2 636 849 (63.3) | 1 171 121 (55.2) | 1 064 532 (47.2) | 54 876 (39.9) |
| 25–29.9 | 4 402 902 (28.1) | 110 044 (10.1) | 1 112 855 (18.9) | 1 272 757 (30.6) | 816 393 (38.5) | 1 021 146 (45.3) | 69 707 (50.6) | |
| ≥ 30 | 542 041 (3.5) | 7125 (0.7) | 104 509 (1.8) | 152 262 (3.7) | 110 385 (5.2) | 155 421 (6.9) | 12 339 (9.0) | |
| Cholesterol lowering medication use | Yes | 825 057 (5.3) | 19 441 (1.8) | 227 909 (3.9) | 259 835 (6.2) | 150 468 (7.1) | 158 710 (7.0) | 8694 (6.3) |
Data are expressed as mean ± SD or n (%).
The P-values, which were calculated by the chi-square test and one-way ANOVA across the TG groups, were <0.001 for each variable.
ANOVA, analysis of variance, HDL-C, high-density lipoprotein cholesterol; LDL-C, low density lipoprotein cholesterol; SD, standard deviation.
aTo convert cholesterol from mg/dL to mmol/L, multiply by 0.02586.
bTo convert glucose from mg/dL to mmol/L, multiply by 0.0555.
Overall distribution of triglyceride levels by age and sex
In men, TG levels rapidly increased with age until the late 30s to mid-40s and then gradually decreased after the mid-40s (Figure 1). Meanwhile, in women, TG levels gradually increased by age until the mid-70s to early 80s, decreasing thereafter (Figure 1). The cross-over point between men and women was in the late 60s, after which TG levels were higher in women than in men (Figure 1). Hypertriglyceridaemia prevalence was 28.8% (≥150 mg/dL) or 15.3% (≥200 mg/dL) according to the TG cut-off value used (see Supplementary material online, Figure S2). In individuals aged 18–44 years, it was 24.8% (≥150 mg/dL) or 13.6% (≥200 mg/dL). The distribution of log2-transformed TG levels approached a normal distribution, unlike the linear-scale TG levels (see Supplementary material online, Figure S3).
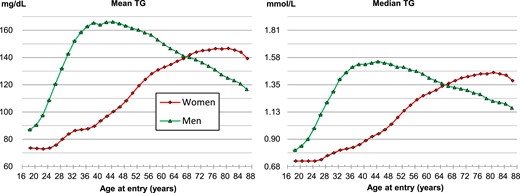
Mean and median concentration of triglycerides by sex and age. To convert triglyceride from mg/dL to mmol/L, divide by 88.57. TG, triglyceride.
Association between triglyceride levels and cardiovascular disease mortality
Triglyceride levels showed a clear log-linear association with overall CVD mortality (Figure 2; Supplementary material online, Figure S4 and Table S1), especially IHD (including AMI) and ischaemic stroke (Figure 3). While HF or haemorrhagic stroke generally showed no correlation with TG levels (Figure 3). Noticeably, a TG level of <50 mg/dL was associated with the lowest rates of mortality from overall CVD, IHD, AMI, and ischaemic stroke. After the exclusion of the first 3 years of follow-up, the associations were not substantially different from the main analysis (see Supplementary material online, Figure S5). When non-HDL-C instead of LDL-C was adjusted for, the associations, especially for IHD (including AMI), weakened but were maintained (see Supplementary material online, Figure S6). The CIs generally overlapped between sexes (see Supplementary material online, Table S2 and Figures S4, S7, and S8), whereas the associations were the strongest in the youngest adults (see Supplementary material online, Figure S9). Spline analyses using log2-transformed TG levels showed that the log2-transformed TG levels had generally linear associations with mortality from ASCVD, including IHD, AMI, and ischaemic stroke (P for non-linearity ≥ 0.05) (Figure 4).
![Sex–age-adjusted hazard ratios* across 17 categories of triglyceride for cardiovascular disease mortality. Triglyceride categories [mg/dL: <50, 50–74 (reference) to 175–199 by 25, 200–249 to 450–499 by 50, 500–599, 600–699, 700–799, and ≥800]. The midpoint was used as a representative value of each triglyceride category, except for both ends (42 and 928) for which the median was used. *Hazard ratios and 95% confidence intervals were calculated using Cox proportional hazard models with adjustment for sex (for all participants only) and age at baseline. To convert triglyceride from mg/dL to mmol/L, divide by 88.57.](https://oup.silverchair-cdn.com/oup/backfile/Content_public/Journal/eurjpc/31/3/10.1093_eurjpc_zwad330/1/m_zwad330f2.jpeg?Expires=1749151473&Signature=jWMWpbttW-F4OiPpoxpaEx6i9-g9zekOOL1KkryUhOcH6KJKeP9aE~sPKSEmoqa3mJyxj-EWZS8vlPBC~9X~020SyKmkJUhykoTMp-xNi7qzJA3VIOUtuPWPY9WkeyeTXllRy05A3pwbNtCVOvtMR2nRLpZPFE~UPAzoSSKGFi6jUhs5ZnfRHm8Bh~FL-YXHbe22z6eHWIdSxRXPnvzqjYulsnhQJXd1189i-PdeaiNC4YK1pI5YcNI3dAiWCkrDVOG7qIml5zGr7PIV1wobm5r8w0~1RBu4R29er80YfKDwM93NNvvD4oCECEpFd13PJFBvKk0vGZAQ-XGMyCxnkg__&Key-Pair-Id=APKAIE5G5CRDK6RD3PGA)
Sex–age-adjusted hazard ratios* across 17 categories of triglyceride for cardiovascular disease mortality. Triglyceride categories [mg/dL: <50, 50–74 (reference) to 175–199 by 25, 200–249 to 450–499 by 50, 500–599, 600–699, 700–799, and ≥800]. The midpoint was used as a representative value of each triglyceride category, except for both ends (42 and 928) for which the median was used. *Hazard ratios and 95% confidence intervals were calculated using Cox proportional hazard models with adjustment for sex (for all participants only) and age at baseline. To convert triglyceride from mg/dL to mmol/L, divide by 88.57.
![Hazard ratios* across 11 categories of triglyceride for mortality from cardiovascular disease and its subtypes. Triglyceride categories [mg/dL: <50, 50–74 (reference) to 175–199 by 25, 200–349, 350–499, 500–749, and ≥750]. The median was used as a representative value of each TG category. *Hazard ratios and 95% confidence intervals were calculated using Cox proportional hazard models with adjustment for age at baseline, sex, smoking status, alcohol consumption frequency, physical activity, household income, systolic blood pressure, fasting glucose, body mass index, cholesterol-lowering medication use, high-density lipoprotein cholesterol, and low-density lipoprotein cholesterol. To convert triglyceride from mg/dL to mmol/L, divide by 88.57. AMI, acute myocardial infarction; CVD, cardiovascular disease; HF, heart failure; HR, hazard ratio; HStr, haemorrhagic stroke; IHD, ischaemic heart disease; IStr, ischaemic stroke; TG, triglyceride.](https://oup.silverchair-cdn.com/oup/backfile/Content_public/Journal/eurjpc/31/3/10.1093_eurjpc_zwad330/1/m_zwad330f3.jpeg?Expires=1749151473&Signature=t8FHiMLezUZPdNJXH2hkMWAfMf0DjxCrTZpJFbkTPqfKDqvC9~NeJhBofhiSWbGaJTzqWiJZTAkEnnjCWNlLNdnMX8787OAQ1vdHBESmhzZU3U~7VqFU4DZuQrB8nIZcd8RKm6KdhIQu7sI0RxNCIpbaLK~l59NIPhqbLlaBW~Sp6-iLtqFTogSUDmdjGQkbnQeY84Ixt-tuWBaRxeF8XtADr~DtgMBStX7b4wXH9KdBYCv-aN0A6Ojv9M7rNjxhxZelk~s6atqalocM8~sv8dO6MAuEhfYN4uh0TJvQQ2gXteQy2Zxlx~rgsLvFMJCVrH6oS-akngTk-Z9NV4ps~A__&Key-Pair-Id=APKAIE5G5CRDK6RD3PGA)
Hazard ratios* across 11 categories of triglyceride for mortality from cardiovascular disease and its subtypes. Triglyceride categories [mg/dL: <50, 50–74 (reference) to 175–199 by 25, 200–349, 350–499, 500–749, and ≥750]. The median was used as a representative value of each TG category. *Hazard ratios and 95% confidence intervals were calculated using Cox proportional hazard models with adjustment for age at baseline, sex, smoking status, alcohol consumption frequency, physical activity, household income, systolic blood pressure, fasting glucose, body mass index, cholesterol-lowering medication use, high-density lipoprotein cholesterol, and low-density lipoprotein cholesterol. To convert triglyceride from mg/dL to mmol/L, divide by 88.57. AMI, acute myocardial infarction; CVD, cardiovascular disease; HF, heart failure; HR, hazard ratio; HStr, haemorrhagic stroke; IHD, ischaemic heart disease; IStr, ischaemic stroke; TG, triglyceride.
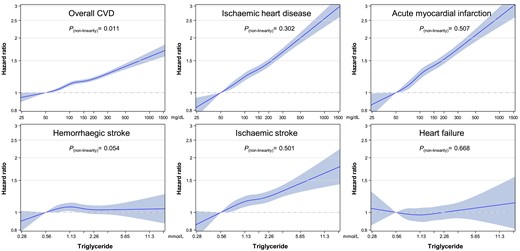
Hazard ratios* for mortality from cardiovascular disease and its subtypes using spline analysis. Restricted cubic splines of triglyceride with pre-defined five knots (5th, 27.5th, 50th, 72.5th, and 95th percentile) and 50 mg/dL as a reference were used. Hazard ratios and 95% confidence intervals were calculated using Cox proportional hazard models after adjustment for the same variables as in Figure 3. To convert triglyceride from mg/dL to mmol/L, divide by 88.57. CVD, cardiovascular disease.
Linear analysis
The multivariable-adjusted HRs of a doubling of TG levels for CVD mortality were 1.10 (95% CI 1.09–1.11) (Figure 5). Among CVD subtypes, the association was strongest for AMI (HR = 1.24, 95% CI 1.22–1.26) followed by IHD [HR = 1.22 (1.20–1.24)] and ischaemic stroke [HR = 1.10 (1.07–1.13)] (Figure 5). Among age groups, the association for overall CVD was strongest for youngest adults [HR = 1.13 (1.09–1.17)], followed by middle-aged adults [HR = 1.08 (1.06–1.09)], and older adults [HR = 1.06 (1.05–1.07)] (P for heterogeneity between age groups = 0.003) (Table 2). The corresponding HRs for IHD mortality in the young, middle, and old groups were 1.26 (95% CI 1.18–1.35), 1.20 (1.17–1.24), and 1.16 (1.13–1.18), respectively (Table 2). These log-linear associations for IHD, AMI, and ischaemic stroke remained consistent across LDL-C levels, even among those with LDL-C levels below 100 mg/dL in each age group (Table 2 and Supplementary material online, Table S3).
Hazard ratios* per two-fold increase in triglyceride for mortality from cardiovascular disease and its subtypes according to low-density lipoprotein cholesterol. *Hazard ratios and 95% confidence intervals were calculated using Cox proportional hazard models with adjustment for age at baseline, sex, smoking status, alcohol consumption frequency, physical activity, household income, systolic blood pressure, fasting glucose, body mass index, cholesterol-lowering medication use, high-density lipoprotein cholesterol, and low-density lipoprotein cholesterol (for all participants only). Same abbreviation was used as in Figure 3. To convert low-density lipoprotein cholesterol from mg/dL to mmol/L, multiply by 0.02586. AMI, acute myocardial infarction; CVD, cardiovascular disease; HF, heart failure; HR, hazard ratio; HStr, haemorrhagic stroke; IHD, ischaemic heart disease; IStr, ischaemic stroke; TG, triglyceride.
Hazard ratiosa per two-fold increase in triglyceride for deaths from cardiovascular disease and subtypes by ages and in the <100 mg/dL low-density lipoprotein cholesterol range
| CVD subtypes | Age group, | Total population (n = 15 672 028) | LDL-C < 100 mg/dL (n = 5 480 875) | ||||||
|---|---|---|---|---|---|---|---|---|---|
| (ICD-10) | Years | No. of death | P-value | HR (95% CI) | Pheterogeneity (age) | No. of death | P-value | HR (95% CI) | Pheterogeneity (age) |
| CVD | 18–99 | 105 174 | <0.001 | 1.10 (1.09–1.11) | 35 223 | <0.001 | 1.04 (1.02–1.05) | ||
| 18–44 | 5659 | <0.001 | 1.13 (1.09–1.17) | 0.003 | 1991 | <0.001 | 1.13 (1.07–1.19) | <0.001 | |
| 45–64 | 25 079 | <0.001 | 1.08 (1.06–1.09) | 8531 | 0.192 | 1.02 (0.99–1.04) | |||
| 65–99 | 74 436 | <0.001 | 1.06 (1.05–1.07) | 24 701 | 0.465 | 0.99 (0.98–1.01) | |||
| Ischaemic heart disease | 18–99 | 27 745 | <0.001 | 1.22 (1.20–1.24) | 8582 | <0.001 | 1.12 (1.09–1.15) | ||
| 18–44 | 1680 | <0.001 | 1.26 (1.18–1.35) | 0.012 | 441 | <0.001 | 1.22 (1.09–1.36) | 0.036 | |
| 45–64 | 8082 | <0.001 | 1.20 (1.17–1.24) | 2457 | <0.001 | 1.11 (1.06–1.16) | |||
| 65–99 | 17 983 | <0.001 | 1.16 (1.13–1.18) | 5684 | <0.001 | 1.06 (1.03–1.10) | |||
| Acute myocardial infarction | 18–99 | 20 623 | <0.001 | 1.24 (1.22–1.26) | 6260 | <0.001 | 1.15 (1.12–1.19) | ||
| 18–44 | 1164 | <0.001 | 1.23 (1.14–1.33) | 0.332 | 302 | 0.006 | 1.21 (1.06–1.38) | 0.428 | |
| 45–64 | 6122 | <0.001 | 1.22 (1.18–1.26) | 1811 | <0.001 | 1.13 (1.07–1.19) | |||
| 65–99 | 13 337 | <0.001 | 1.18 (1.16–1.21) | 4147 | <0.001 | 1.10 (1.06–1.15) | |||
| Haemorrhagic stroke | 18–99 | 16 575 | 0.746 | 1.00 (0.98–1.02) | 6114 | 0.994 | 1.00 (0.97–1.03) | ||
| 18–44 | 1869 | 0.023 | 1.07 (1.01–1.14) | 0.007 | 783 | 0.013 | 1.11 (1.02–1.21) | 0.003 | |
| 45–64 | 5940 | 0.191 | 0.98 (0.94–1.01) | 2199 | 0.280 | 0.97 (0.93–1.02) | |||
| 65–99 | 8766 | 0.012 | 0.96 (0.93–0.99) | 3132 | 0.011 | 0.94 (0.90–0.99) | |||
| Ischaemic stroke | 18–99 | 13 166 | <0.001 | 1.10 (1.07–1.13) | 4198 | 0.010 | 1.05 (1.01–1.09) | ||
| 18–44 | 151 | 0.371 | 1.10 (0.89–1.37) | 0.964 | 43 | 0.179 | 1.28 (0.89–1.85) | 0.360 | |
| 45–64 | 1803 | 0.005 | 1.09 (1.03–1.16) | 582 | 0.951 | 1.00 (0.91–1.10) | |||
| 65–99 | 11 212 | <0.001 | 1.08 (1.06–1.11) | 3573 | 0.051 | 1.04 (1.00–1.09) | |||
| Heart failure | 18–99 | 6638 | 0.387 | 1.02 (0.98–1.05) | 2358 | 0.001 | 0.91 (0.87–0.97) | ||
| 18–44 | 73 | 0.511 | 0.90 (0.66–1.23) | 0.018 | 34 | 0.256 | 0.79 (0.53–1.19) | 0.563 | |
| 45–64 | 708 | 0.011 | 1.14 (1.03–1.26) | 266 | 0.524 | 0.95 (0.83–1.10) | |||
| 65–99 | 5857 | 0.288 | 0.98 (0.94–1.02) | 2058 | <0.001 | 0.89 (0.84–0.94) | |||
To convert LDL-C from mg/dL to mmol/L, multiply by 0.02586.
CI, confidence interval; CVD, cardiovascular disease; HR, hazard ratio; ICD-10, International Classification of Diseases 10th revision; LDL-C, low-density lipoprotein cholesterol; TG, triglyceride.
aHazard ratios were calculated by Cox models, after adjustment for age at baseline, sex, smoking status, alcohol use, physical activity, household income, body mass index, systolic blood pressure, diabetes status, cholesterol-lowering medication use, low-density lipoprotein cholesterol (for all participants only), and high-density lipoprotein cholesterol.
Association between triglyceride levels and cardiovascular mortality by low-density lipoprotein cholesterol levels
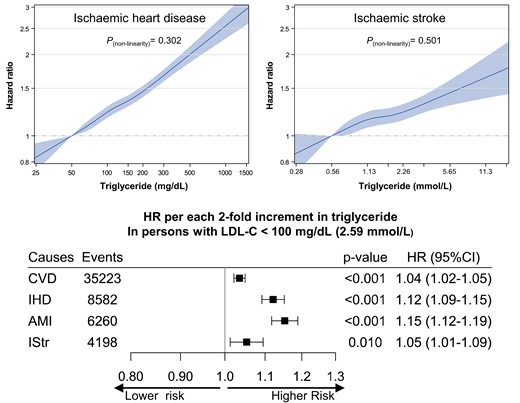
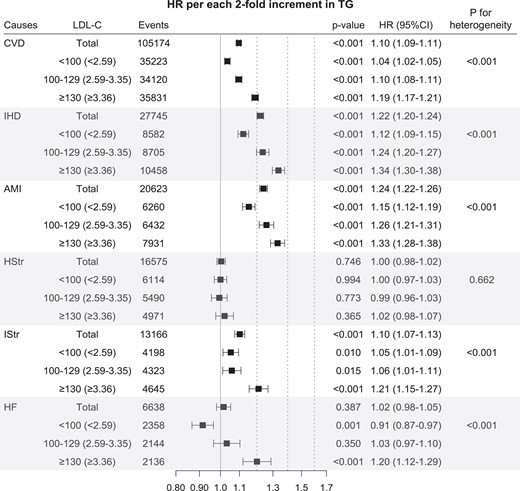
The associations between TG levels and CVD mortality, especially for IHD (including AMI) and ischaemic stroke, were strongest in the ≥130 mg/dL LDL-C group (HR per two-fold increase in TG = 1.19, 95% CI 1.17–1.21) followed by the 100–129 mg/dL LDL-C group (HR 1.10, 95% CI 1.08–1.11) and the <100 mg/dL LDL-C group (HR 1.04, 95% CI 1.02–1.05) (Figure 5). In addition, regardless of LDL-C subgroups, TG levels of <50 mg/dL were associated with the lowest mortality from overall CVD and ASCVD, including IHD, AMI, and ischaemic stroke (see Supplementary material online, Figure S10). In the lowest LDL-C group (<100 mg/dL), although the association was weakest among the LDL-C groups, log-linear associations of TG levels with ASCVD were clear (Figure 5). In addition, this log-linear association between TG and the overall CVD, IHD, AMI and ischaemic stroke mortality persisted even within the statin user population as shown in Supplementary material online, Figure S11. The HRs per two-fold increase in TG were 1.12 for IHD (95% CI 1.09–1.15), 1.15 for AMI (95% CI 1.12–1.19), and 1.05 for ischaemic stroke (95% CI 1.01–1.09) (Figure 5). Among individuals with TG < 400 mg/dL, in whom the accuracy of LDL-C calculation was higher, the patterns of associations were not different (see Supplementary material online, Table S4 and Figure S12). An analysis according to non-HDL-C instead of LDL-C showed that log-linear associations of TG levels with ASCVD were also clear in the lowest non-HDL-C groups (<130 mg/dL) (see Supplementary material online, Table S5 and Figure S13). In those with LDL-C levels less than 100 mg/dL, the log-linear correlation between TG levels and overall CVD was strongest in the youngest age group (Table 2).
Discussion
In our large-scale prospective cohort study of the Korean general population, HTG was independently associated with a higher risk of CVD mortality after adjustment for various other CVD risk factors, including HDL-C and LDL-C. Regarding CVD mortality, especially IHD (including AMI) and ischaemic stroke, log-transformed TG had a clear linear association (a log-linear association) even below 50 mg/dL, but this was not found for haemorrhagic stroke and HF. Each two-fold increase in TG was associated with 1.10-fold (overall CVD), 1.22-fold (IHD), 1.24-fold (AMI), and 1.10-fold (ischaemic stroke) higher CVD mortality, respectively. The associations were stronger in younger than in older participants, while they were not materially different between men and women.
When stratified by baseline LDL-C levels, stronger associations of TG with overall CVD mortality were found in the higher LDL-C levels, with the strongest association found in the ≥130 mg/dL LDL-C group, followed by the 100–129 mg/dL LDL-C group and the <100 mg/dL LDL-C group. Notably, TG levels had clear log-linear associations with overall CVD and IHD (including AMI), even in younger (<45 years) adults with low (<100 mg/dL) LDL-C levels.
Hypertriglyceridaemia as an independent risk factor for cardiovascular disease mortality
Our study showed that TG levels had a positive graded association with overall CVD mortality, especially ASCVD (including AMI and ischaemic stroke) in the general population. In prior studies, the associations of HTG with CVD were substantially weakened after adjustment for major risk factors, including lipids19,20; thus, some researchers cast doubts on the role of HTG as an independent risk factor for CVD.21 Particularly, in the Emerging Risk Factors Collaboration study, the association of TG with CVD risk was nullified after adjusting for HDL-C and non-HDL-C.20 The current study demonstrated that the higher CVD mortality associated with HTG was maintained after adjustment for major CVD risk factors such as BMI, blood pressure, fasting glucose, diabetes status, and lipid levels, including HDL-C and LDL-C, as well as behavioural and socio-demographic factors. Moreover, even after adjustment for non-HDL-C levels, which may well represent TG-rich remnant cholesterol, rather than adjusting for LDL-C, the association of CVD mortality with TG persisted. A recent study showed that an increase in the TG component itself was associated with an increased risk of ASCVD, regardless of the lipoprotein particle subtypes or subclasses.22 Taken together, these results suggest that HTG may be an independent risk factor for CVD, especially ASCVD.
Log-linear association of triglyceride levels with cardiovascular disease mortality
We also demonstrated a clear linear association between log-transformed TG and overall CVD mortality (a log-linear association), especially IHD (including AMI) and ischaemic stroke, including at TG levels below 50 mg/dL. Despite the extreme right skewness of the TG level distribution, many previous studies examined the associations using linear rather than log-transformed scales of TG,4,19,23–26 while several other large-scale studies examined log-linear associations.20,27 The present study clearly demonstrated a distinct log-linear, rather than linear, correlation between TG levels and mortality from IHD (including AMI) and ischaemic stroke, both in a graphical display of the association and in formal statistical testing for non-linearity. Regarding the magnitude of associations, in our study, the risk increased by 10% (14%) and 24% (36%) for overall CVD mortality and AMI, respectively, for each two-fold increment of TG (or each 1-unit increase in log2TG) after adjustment for other major risk factors, including lipids. These results were comparable with previous meta-analyses reporting 16% higher mortality from CVD25 or 33% higher mortality from IHD27 per 1-unit increase in the logeTG level. Our result showed a similar CVD mortality related to HTG, despite the facts that our study included a relatively young and low-risk population and our study adjusted for more confounding variables, compared with the studies included prior meta-analyses.
Hypertriglyceridaemia and mortality from heart failure or haemorrhagic stroke
In the present study, we found no significant association between HF mortality and TG levels. Several prior studies had reported that low TG levels were associated with increased mortality in patients with established HF.28,29 However, a Danish study reported that TG seemed to be simply a mediator of the risk factors for HF such as alcohol, diabetes, and obesity; thus, TG appeared not to be an independent risk factor for HF mortality,30 which is in line with our results. Our data also showed no clear association of haemorrhagic stroke with TG. Previous study results have been inconsistent regarding the association between haemorrhagic stroke and TG.31–34 In prior meta-analyses including Asian populations, no significant associations were noted between TG levels and haemorrhagic stroke,22,26,27 in accordance with our results.
Cardiovascular disease mortality risk of hypertriglyceridaemia by age
In our data, a substantial number of younger adult individuals had HTG (≥150 mg/dL) (24.8% in all 18–44 years old), and we were able to demonstrate that the younger population had a stronger association between TG levels and mortality from overall CVD, IHD, and AMI than the older population, even though significant associations persisted across all age groups. Noticeably, for AMI mortality, the young age group (18–44 years) showed the strongest associations (up to 24% higher for every two-fold increase in TG levels). The stronger associations in younger adults are in line with prior studies.23,35 It's important to note that these associations remained evident even in the group with LDL-C levels below 100 mg/dL.
Cardiovascular disease mortality risk of hypertriglyceridaemia by low-density lipoprotein cholesterol levels
The novel finding of our present study is that the impact of HTG on overall CVD mortality, especially ASCVD (including IHD, AMI, and ischaemic stroke), was maintained in individuals with optimal LDL-C levels (<100 mg/dL). A recent study showed that HTG was associated with subclinical atherosclerosis in participants with normal LDL-C levels (<100 and <116 mg/dL for moderate and low CVD risk individuals, respectively), which might provide a potential mechanism of ‘residual CVD risk’ after adequate LDL-C control.36 To our best knowledge, the current study is the first to investigate the association between TG and CVD mortality in individuals below 100 mg/dL of LDL-C, which is clinically considered as the optimal target of LDL-C in individuals with low to moderate ASCVD risk. In individuals with LDL-C < 100 mg/dL, every doubling of TG levels increased AMI mortality by 15%. These results highlight the clinical importance of HTG as an indicator of residual CVD risk even in adults with low LDL-C levels, who are often less aggressively treated.
The impact of HTG on overall CVD or IHD (including AMI) was strongest in persons with LDL-C ≥ 130 mg/dL, followed by those with levels of 100–129 and <100 mg/dL. These findings indirectly support the current guidelines’ recommendations for HTG—that is, first to achieve the LDL-C goal in persons with high LDL-C levels rather than lowering TG levels.12–14 Hence, TG lowering was only recommended when HTG persists after achieving the LDL-C target in high ASCVD risk individuals. However, the risk assessment or management of HTG is not recommended in persons with low to moderate ASCVD risk, particularly for primary prevention purposes. In our study, higher ASCVD risk was clearly associated with HTG even in the youngest adults (18–44 years) with LDL-C < 100 mg/dL—namely, those who are considered as the lowest-risk individuals. Therefore, our study suggests that the management of HTG might be beneficial even in low-risk populations, such as young individuals with normal or optimal LDL-C levels.
Optimal target goal of triglyceride levels
Current clinical guidelines do not provide therapeutic target goals of TG levels to lower CVD risk, due partly to insufficient evidence on the detailed association between TG and CVD. Assuming causality, we suggest achieving a therapeutic target goal of TG according to our data. In persons with HTG above 200 mg/dL, the first target goal may be <200 mg/dL. The reason for this proposed target is that in our analysis, ASCVD mortality risks were clearly distinguished between TG levels below and above 200 mg/dL, regardless of age, sex, or LDL-C subgroup. The second target goal may be <100 mg/dL rather than <150 mg/dL. The reason for this is that the risk differences were relatively modest between TG groups in the TG range of 100–199 mg/dL, with overlapping CIs in prior several large-scale studies23,27,37 and in our study in persons with LDL-C < 130 mg/dL, especially in those with <100 mg/dL; in this group, a TG level of <100 mg/dL, especially <50 mg/dL, was associated with the lowest ASCVD mortality. The current normal range of TG < 150 mg/dL may be acceptable in the total population, which includes a substantial number of people with LDL-C ≥ 130 mg/dL. However, for the therapeutic target in persons with relatively controlled LDL-C levels (such as <130 or <100 mg/dL), this target may have less merit. Meanwhile, people with TG levels of <100 mg/dL showed the lowest risks. Therefore, based on these results, we suggest an optimal TG target of <100 mg/dL, which is in line with the optimal level based on experts’ consensus.11 Beyond what was previously mentioned, the observation of a persistent log-linear association between TG and ASCVD mortality, even among statin users with LDL-C < 100 mg/dL, implies that further management of TG could be advantageous in this group.
Study strengths and limitations
This study included the largest number of CVD deaths among all studies to date on the association of TG with CVD mortality in the general population, which enabled high statistical power, the use of detailed TG categories, and analyses of various subgroups, which are strengths of this study. A careful consideration of the most important risk factors and mediators, including blood pressure, diabetes, smoking, and lipids, is another strength. The prospective design and nearly complete follow-up through record linkage to a national database is another strength of this study.
Nonetheless, our study has several limitations. Firstly, given the observational nature of the data, we cannot make definitive causal inferences. Secondly, information on the subtypes of TG-rich lipoproteins (TRLs) was not available; therefore, we could not reveal mechanisms in more detail, such as exploring how certain types of TRLs were associated with CVD mortality. Lastly, since our study included a single ethnicity (the Korean population) and geographical location (South Korea), our results may not necessarily be generalizable to other regional and ethnic groups. However, the associations between TG levels and ASCVD risks were consistently maintained in different CV risk profile groups by age, sex, and LDL-C levels, which might enhance the generalizability of our results.
Conclusions
In this study, we confirmed the independent clinical impact of HTG on CVD mortality after a comprehensive adjustment for major CVD risk factors in the Korean general population. A residual CVD risk of HTG was revealed in the general population with low LDL-C (<100 mg/dL), even among the youngest individuals (18–44 years). Triglyceride management might be beneficial even in low-risk individuals with well-controlled LDL-C levels; thus, careful medical supervision might be required.
Supplementary material
Supplementary material is available at European Journal of Preventive Cardiology.
Author contributions
SWY and HBP contributed to the conception or design of the work. SWY and JJY contributed to the acquisition and statistical analysis of data. HBP, SWY, RA, SJH, and JJY contributed to the analysis, or interpretation of data for the work. HBP and YSW drafted the manuscript. RA, SJH, and JJY critically revised the manuscript. All gave final approval and agree to be accountable for all aspects of work ensuring integrity and accuracy.
Data availability
The data supporting the findings of this study are available from the NHIS (http://nhiss.nhis.or.kr/bd/ab/bdaba000eng.do), which provides access to researchers upon review and approval of their proposal.
References
Author notes
Conflict of interest: None declared.

Comments