


Abstract
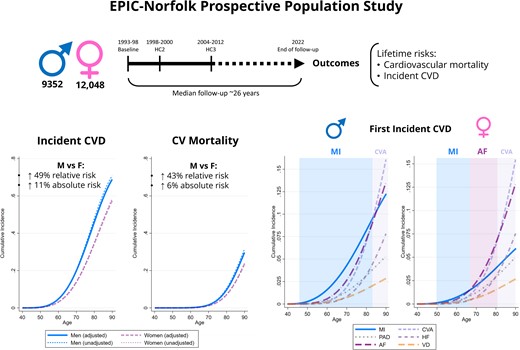
Better understanding of sex differences in cardiovascular disease (CVD) is essential in tailoring appropriate preventative strategies. Using a large population-based study with follow-up >25 years, we aimed to determine sex-specific lifetime risks of incident CVD and cardiovascular (CV) mortality amongst populations with and without prevalent CVD.
Participants were drawn from the European Prospective Investigation into Cancer-Norfolk and followed up for a median of 26.2 years. Sex-specific lifetime risks were ascertained accounting for the competing risk of death. Models were adjusted for ethnicity and time-updated covariates: material deprivation, CV risk factors, lifestyle factors, comorbidities, and medication. A total of 23 859 participants [54.5% women; mean age (standard deviation) 59.2 (9.3) years at baseline] were included. Adjusted lifetime risks of incident CVD were higher in men than in women (69.1 vs. 57.7% at age 75): cause-specific hazard ratio (cHR) (99% confidence interval)—1.49 (1.41–1.57), while the risks of CV mortality at age 75 were 4.4% (men) and 3.1% (women): cHR—1.42 (1.31–1.54). Myocardial infarction was the predominant first presentation in men until the eighth decade. In women, the first CVD manifestations after their sixth decade were predominantly atrial fibrillation and stroke. The male-associated excess relative risks of incident CVD and CV mortality were halved in people with prevalent CVD.
We characterized the sex-specific lifetime CV risks in a large cohort. Men had substantially higher risk of incident CVD and CV mortality than women, which was attenuated amongst people with prevalent CVD. Our findings provide an evidence base for sex-specific CV prevention.
Lay Summary
In this population-based study, we aimed to understand the sex-specific lifetime trajectories of different heart and circulatory disorders and their relationship with death from heart disease. We included ∼24 000 participants in the analyses, who were followed up for >25 years. Men had a higher lifetime risk of heart and circulatory disorders compared with women. Heart attacks were the predominant first presentation in men until the eighth decade, while in women this was manifested as heart rhythm disorders and stroke after their sixth decade. The excess risk of death from heart disease observed in men with pre-existing heart disease was attenuated compared with those free of heart disease at baseline. In conclusion, men and women require tailored heart disease prevention efforts given the marked sex disparities in heart disease and death over the very long-term highlighted by our study.
See the editorial comment for this article ‘Gender disparities in cardiovascular lifetime risk: do not forget myocardial infarction in men’, by E. Prescott, https://doi.org/10.1093/eurjpc/zwad336.
Introduction
Cardiovascular disease (CVD) remains an important driver of death, disability, and healthcare expenditure worldwide,1 rendering a granular understanding of CVD epidemiology essential in tailoring effective preventative efforts at an individual patient level. Sex differences are an important such consideration. While it is known that men have higher rates of incident CVD than women,2–13 the estimates for different important incident cardiovascular (CV) disorders in people with and without prevalent CVD were not derived from the same populations. This renders their direct comparison difficult due to inter-population heterogeneity. This is particularly important, as these different scenarios are likely to have different implications for primary and secondary prevention.
A comprehensive analysis of sex differences of a wide range of relevant CV outcomes both in people with and without prevalent CVD of the same population is therefore warranted. Such an investigation requires an extensive and reliable follow-up information in order to inform robust sex-specific lifetime risk estimates. The European Prospective Investigation into Cancer (EPIC)-Norfolk study14 is a large population-based cohort with very long follow-up data in excess of 25 years and benefits from robust ascertainment of incident CV events.15
We therefore aimed to utilize these unique advantages of the EPIC-Norfolk cohort in order to comprehensively characterize the sex-specific lifetime trajectories of different CV phenotypes [incident CVD further subdivided into myocardial infarction (MI), stroke, peripheral artery disease (PAD), atrial fibrillation (AF), heart failure (HF), and valve disease (VD)] and their relationship with CV mortality. We aimed to determine these both before and after CVD incidence in the same population, given the different implications for primary and secondary prevention, respectively.
Methods
Ethical considerations
This study was conducted in accordance with the Declaration of Helsinki (1975) and later amendments. Ethical approval was obtained from the Norwich District Health Authority Ethics Committee (Rec Ref: 98NC01). All participants gave informed signed consent for the examination of medical records and use of the data.
Data source
Participants were selected from the EPIC-Norfolk prospective cohort study. Study recruitment methods have been previously described.14 Briefly, men and women aged 40–79 years (at study baseline) from 35 General Practices in Norfolk, UK, were invited to participate. Three health checks (HC1, HC2, and HC3) occurred in 1993–98 (study baseline), 1998–2000, and 2004–12. At each HC, data on age, demographic characteristics, behavioural parameters, blood pressure measurements, and medication were collected. Plasma levels of important biomarkers, including LDL cholesterol (LDLc) and glycated haemoglobin A1c (HbA1c), were determined from blood samples collected at each health check. Self-reported co-morbidities were ascertained during the first and second HCs. A follow-up questionnaire obtained between 2000 and 2006 ascertained self-reported co-morbidities before the third health check.16
Inclusion and exclusion criteria
Figure 1 illustrates the participant population flowchart. Of the 25 636 eligible participants attending the HC1, 229 participants were excluded due to missing or implausible follow-up information. Further 1536 participants were excluded due to missing data on key variables collected at HC1: ethnicity, the Townsend index, systolic blood pressure, smoking status, alcohol intake, physical activity levels, body mass index (BMI), and fruit/vegetable intake. After the further exclusion of 12 participants aged <40 years at HC1, a total of 23 859 participants were included in the present study.
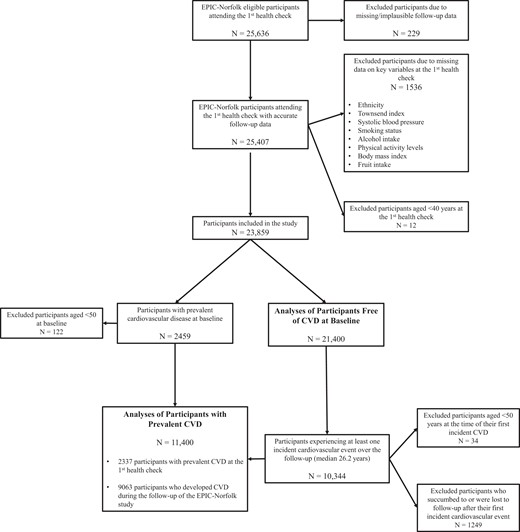
Patient population flowchart.
Analyses of participants free of cardiovascular disease at baseline
In order to ascertain sex differences in the lifetime risk of incident CVD, 2459 participants who self-reported prevalent CVD at the study baseline—HC1—were excluded for these analyses, leading to the inclusion of 21 400 participants.
Analyses of participants with prevalent cardiovascular disease
In order to ascertain sex differences in CV mortality and recurrent CVD amongst participants with prevalent CVD, this cohort was established by including (i) 2337 participants aged 50 years or older self-reporting prevalent CVD at the study baseline—defined as self-reported angina, MI, cerebrovascular, peripheral vascular disease, or a prescription of digoxin at HC1 and (ii) 9063 participants aged 50 years or older who developed CVD over the duration of the EPIC-Norfolk study follow-up (median 26.2 years) and did not succumb to their first incident CVD event, leading to the inclusion of a total of 11 400 participants.
Definition of outcomes, exposure, and confounders
Outcomes and exposure
The exposure of interest was participants’ sex. The outcomes of interest were incident CVD other than essential uncomplicated hypertension [International Classification of Disease (ICD), ninth edition (ICD-9), 402–448; ICD-10, I11–I79], further subdivided into MI (410 and I21–I22), stroke (430–438 and I60–I69), AF (427.3 and I48), HF (428 and I50), peripheral arterial disease (440–448 and I70–I79), and VD (I34–I37) as well as CV mortality. Cardiovascular mortality was ascertained using death certificate data and ICD-10 codes (I10–I79) obtained through record linkage with the National Health Service hospital information system and East Norfolk Commission Record to allow notification of any hospital admission. Incident CVD was defined as any hospital admission/primary care diagnosis with the relevant ICD-9/10 codes.
Confounders
All multivariable models were adjusted for baseline ethnicity, the Townsend deprivation index,17,18 and the following other potential confounders ascertained at HC1, HC2, and HC3: systolic blood pressure, hypercholesterolaemia, diabetes mellitus, smoking status, alcohol consumption, BMI, fruit and vegetable consumption (HC1 and HC2 only), self-reported non-CV comorbidities (cancer, asthma, bronchitis), and medication (aspirin, antihypertensive agents, digoxin, lipid-lowering agents, and antidiabetic agents). Hypercholesterolaemia was defined as self-reported high cholesterol levels at baseline, LDLc > 3.3 mmol/L, or therapy with lipid-lowering medication at the respective HC. Similarly, diabetes mellitus was defined as self-reported diabetes at baseline, HbA1c > 6.5%, or therapy with antidiabetic agents at the respective HC. Food and vegetable consumption levels were derived from the food frequency questionnaires collected at HC1 and HC2.19
Statistical analyses
Data were analysed using Stata 15.1 SE for Windows (StataCorp 2017, Stata Statistical Software: Release 15, College Station, TX, USA). A 1% threshold of statistical significance was used (P < 0.01) in order to reduce the probability to Type I error given the multiple statistical comparisons undertaken.
Handling of missing data
Participants with missing data on any key variables collected at HC1 were excluded. The only variables with missing data at HC1 were plasma levels of LDLc [2013 (9.41%)] and HbA1c [12 027 (56.20%)], leading to the utilization of a compound definition also including the self-reported and medication data in order to ascertain hypercholesterolaemia and diabetes mellitus. Some of the included key variables of interest measured at HC2 and HC3 had missing data (see Supplementary material online, Tables S1 and S2). For the purposes of their inclusion as time-updated covariates in survival analyses, these were replaced by values carried forward from the most recent health check at which they were last ascertained successfully.
Descriptive statistics
Patient characteristics were compared between men and women at each health check for the cohorts included in both the analyses of participants with and without prevalent CVD, using the χ2 test, Student’s t-test, or Mann–Whitney U test, as appropriate.
Survival analyses
The participants included in the analysis of people without CVD at baseline were followed up from HC1 until death (n = 9376), attrition from the study (n = 806), or the end of March 2022 (n = 11 218). The median [inter-quartile range (IQR)] follow-up time was 26.2 (25.1–27.3) years, while the maximum follow-up was 29 years. In order to ascertain lifetime risks, delayed entry survival models were constructed, with participants entering the ‘at risk’ group at the age at which they were recruited in the EPIC-Norfolk study at HC1. Additional analyses of all incident CVD and CV mortality stratifying by (i) smoking status and (ii) whether participants developed cancer during the study follow-up were undertaken for this group in order to estimate the smoking- and cancer-related lifetime CVD risks.
The participants included in the analyses of people with prevalent CVD either had prevalent CVD at baseline or developed incident CVD over the EPIC-Norfolk study follow-up. They were followed up from the date of their incident CVD until death (n = 7081), attrition from the study (n = 154), or the end of March 2022 (n = 4165), yielding a median (IQR) follow-up time of 17.8 (8.9–25.1) years, while the maximum follow-up was 29 years. In order to ascertain lifetime risks, delayed entry survival models were constructed, with participants entering the ‘at risk’ group at the age at which they developed CVD. Given that the EPIC-Norfolk data linkage only ascertained the first incident event for each given combination of ICD-9/10 codes, participants with specific prevalent conditions were excluded from analyses of incidence of the same condition.
The satisfaction of the proportional hazards assumption was verified by plotting log-negative plots of the sex-stratified survival function by time for each analysis. Cause-specific hazard ratios were ascertained using Weibull regression models. In order to determine absolute risk estimates, sex-specific cumulative incidence functions (CIFs) for each outcome of interest were determined using the Stata stpm2cif command, an extension of the Royston–Parmar flexible parametric survival model accounting for competing risks.20 For analyses of incident CVD, the competing risk of death was considered, while analyses of CV mortality considered the competing risk of non-CV mortality. This approach ensures that participants leaving the analyses having reached a competing risk are not considered at risk for the outcome of interest, therefore avoiding over-estimation of its cumulative incidence.21 All models were adjusted for the confounders detailed above. Covariates were time-updated for the duration of the EPIC-Norfolk study, integrating changes in each parameter ascertained at HC2 and HC3, where these data were available. The sex-specific CIFs were determined at the mean values of all included covariates for the respective cohort.
In order to delineate potential treatment effects, additional survival regressions modelling the risk of CV mortality amongst participants with prevalent CVD were constructed, also including an interaction term between sex and prescription of CV preventative medications (lipid-lowering agents, antihypertensive, and antidiabetic drugs). Sex differences in the likelihood of ever being prescribed CVD preventative medications were determined using Poisson with a robust variance estimator,22,23 both as univariable models as well as multivariable models adjusting for age, ethnicity, the Townsend index, comorbidities, and lifestyle factors.
Results
Descriptive statistics
Table 1 and Supplementary material online, Tables S3 and S4 detail the sex-stratified descriptive statistics across the three health checks for those without prevalent CVD at baseline and with prevalent CVD. Amongst participants free of CVD at baseline, men were older, had higher systolic blood pressure levels, had higher HbA1c, had higher alcohol intake, had lower fruit/vegetable intake, and more likely to have ever smoked. They conversely had a lower BMI and were more likely to be physically active compared with women. Compared with women, men were more likely to be taking aspirin and antidiabetic agents. Men were only more likely to be taking lipid-lowering agents at the third health check, but not at preceding health checks. Men had higher raw rates of CV mortality and incident CVD.
Descriptive statistics of the 21 400 participants aged 40 years or older from the European Prospective Investigation into Cancer-Norfolk study free of cardiovascular disease at the first health check of the study, stratified by sex
| Men | Women | P-value | |
|---|---|---|---|
| N | |||
| First health check (1993–98) | 9352 | 12 048 | |
| Second health check (1998–2000) | 5459 | 7447 | |
| Third health check (2004–12) | 3169 | 4072 | |
| Age, median (IQR) | |||
| First health check | 58.40 (50.70; 66.30) | 57.80 (50.30; 65.90) | 0.002 |
| Second health check | 62.70 (55.30; 69.90) | 61.20 (54.10; 68.70) | <0.001 |
| Third health check | 68.90 (63.00; 75.00) | 67.00 (62.10; 73.80) | <0.001 |
| Ethnicity, N (%) | 0.073 | ||
| White | 9310 (99.55%) | 12016 (99.73%) | |
| Black | 11 (0.12%) | 11 (0.09%) | |
| South Asian | 12 (0.13%) | 5 (0.04%) | |
| Other | 19 (0.20%) | 16 (0.13%) | |
| Townsend index, median (IQR) | −2.65 (−3.68; −1.21) | −2.61 (−3.65; −1.09) | 0.085 |
| Blood pressure (mmHg), mean (SD) | |||
| First health check | |||
| Systolic | 138.36 (17.93) | 134.97 (19.28) | <0.001 |
| Diastolic | 84.87 (11.64) | 81.48 (11.74) | <0.001 |
| Second health check | |||
| Systolic | 137.92 (17.98) | 134.06 (18.94) | <0.001 |
| Diastolic | 84.37 (11.61) | 80.75 (11.45) | <0.001 |
| Third health check | |||
| Systolic | 135.94 (15.95) | 135.44 (17.84) | 0.215 |
| Diastolic | 79.50 (10.11) | 76.73 (9.62) | <0.001 |
| LDL cholesterol (mmol/L), mean (SD) | |||
| First health check | 3.91 (0.96) | 3.99 (1.08) | <0.001 |
| Second health check | 3.70 (0.97) | 3.84 (1.09) | <0.001 |
| Third health check | 2.96 (0.96) | 3.39 (0.97) | <0.001 |
| HbA1c (%), mean (SD) | |||
| First health check | 5.32 (0.85) | 5.25 (0.77) | <0.001 |
| Second health check | 5.50 (0.68) | 5.46 (0.61) | <0.001 |
| Third health check | 5.83 (0.66) | 5.79 (0.56) | 0.035 |
| Body mass index (kg/m2), mean (SD) | |||
| First health check | 26.40 (3.24) | 26.14 (4.29) | <0.001 |
| Second health check | 26.78 (3.29) | 26.47 (4.33) | <0.001 |
| Third health check | 26.78 (3.29) | 26.47 (4.33) | <0.001 |
| Smoking status, N (%) | |||
| First health check | <0.001 | ||
| Current | 1137 (12.16%) | 1360 (11.29%) | |
| Former | 4923 (52.64%) | 3821 (31.71%) | |
| Never | 3292 (35.20%) | 6867 (57.00%) | |
| Second health check | <0.001 | ||
| Current | 534 (8.61%) | 732 (8.56%) | |
| Former | 3360 (54.17%) | 2787 (32.59%) | |
| Never | 2309 (37.22%) | 5034 (58.86%) | |
| Third health check | <0.001 | ||
| Current | 156 (4.22%) | 236 (4.71%) | |
| Former | 2125 (57.48%) | 1805 (36.05%) | |
| Never | 1416 (38.30%) | 2966 (59.24%) | |
| Comorbidities, N (%) | |||
| Hypercholesterolaemia | |||
| First health check | 6268 (67.02%) | 7986 (66.28%) | 0.256 |
| Second health check | 4222 (77.34%) | 5792 (77.78%) | 0.557 |
| Third health check | 2455 (77.47%) | 3269 (80.28%) | 0.004 |
| Diabetes | |||
| First health check | 380 (4.06%) | 310 (2.57%) | <0.001 |
| Second health check | 529 (9.69%) | 668 (8.97%) | 0.163 |
| Third health check | 563 (17.77%) | 711 (17.46%) | 0.735 |
| Cancer | |||
| First health check | 352 (3.76%) | 807 (6.70%) | <0.001 |
| Second health check | 277 (5.49%) | 636 (9.91%) | <0.001 |
| Third health check | 278 (8.77%) | 487 (11.96%) | <0.001 |
| Medications, N (%) | |||
| Aspirin | |||
| First health check | 408 (4.36%) | 370 (3.07%) | <0.001 |
| Second health check | 559 (10.24%) | 481 (6.46%) | <0.001 |
| Third health check | 717 (22.63%) | 493 (12.11%) | <0.001 |
| Antihypertensive agents | |||
| First health check | 1178 (12.60%) | 1928 (16.00%) | <0.001 |
| Second health check | 1036 (18.98%) | 1558 (20.92%) | 0.006 |
| Third health check | 1194 (37.68%) | 1405 (34.50%) | 0.005 |
| Digoxin | |||
| First health check | 0 (0%) | 0 (−%) | — |
| Second health check | 35 (0.64%) | 12 (0.16%) | <0.001 |
| Third health check | 39 (1.23%) | 24 (0.59%) | 0.004 |
| Lipid-lowering agents | |||
| First health check | 50 (0.53%) | 131 (1.09%) | <0.001 |
| Second health check | 176 (3.22%) | 252 (3.38%) | 0.616 |
| Third health check | 789 (24.90%) | 742 (18.22%) | <0.001 |
| Diabetes medication | |||
| First health check | 178 (1.90%) | 142 (1.18%) | <0.001 |
| Second health check | 121 (2.22%) | 102 (1.37%) | <0.001 |
| Third health check | 165 (5.21%) | 109 (2.68%) | <0.001 |
| Outcomes, N (%) | |||
| All-cause mortality | 4549 (48.64%) | 4827 (40.06%) | <0.001 |
| Cardiovascular mortality | 2077 (22.21%) | 2099 (17.42%) | <0.001 |
| Incident cardiovascular disease | 5115 (54.69%) | 5229 (43.40%) | <0.001 |
| Myocardial infarction | 948 (10.14%) | 662 (5.49%) | <0.001 |
| Stroke | 1453 (15.54%) | 1897 (15.75%) | 0.677 |
| Atrial fibrillation | 2016 (21.56%) | 1952 (16.20%) | <0.001 |
| Heart failure | 1366 (14.61%) | 1393 (11.56%) | <0.001 |
| Peripheral arterial disease | 878 (9.39%) | 698 (5.79%) | <0.001 |
| Valve disease | 597 (6.38%) | 599 (4.97%) | <0.001 |
Further descriptives statistics are detailed in Supplementary material online, Table S3.
IQR, inter-quartile range; SD, standard deviation; HbA1c, glycated haemoglobin A1.
Amongst participants with prevalent CVD, there were no sex differences in age, systolic blood pressure, or HbA1c. Men had higher alcohol intake, had lower fruit and vegetable intake, and were more likely to have ever smoked. They conversely had lower LDLc levels, lower BMI, higher physical activity levels, and lower rates of non-CV comorbidities compared with women.
Analyses of participants free of cardiovascular disease at baseline
Figure 2 and Supplementary material online, Figure S1 detail the unadjusted and fully adjusted sex-specific lifetime risks of incident CVD and CV mortality amongst participants free of CVD at baseline. After full confounder adjustment, the cumulative incidence of all CVD was 4.7% for men and 3.2% for women at age 60 years, 31.9% for men and 22.9% for women at age 75 years, and 68.9% for men and 57.4% for women at age 90 years. This translated into a 49% increase in relative risk of all incident CVD for men vs. women: cause-specific hazard ratio [99% confidence interval (CI)] for overall incident CVD [1.49 (1.42–1.58)], incident MI [1.96 (1.71–2.23)], incident AF [1.48 (1.36–1.61)], incident HF [1.41 (1.28–1.56)], incident PAD [1.71 (1.50–1.96)], and incident VD [1.37 (1.18–1.59)]. There were no statistically significant sex differences in incident stroke [1.09 (0.99–1.19)]. The fully adjusted cumulative incidence of CV mortality was 0.11% for men and 0.08% for women at age 60, 4.3% for men and 3.0% for women at age 75, and 29.7% for men and 23.5% for women at age 90, resulting in a 43% relative risk increase [1.43 (1.31–1.55)]. Figure 3 details the results of the analyses of the sex-specific risk of the type of first incident CVD. Amongst men, MI had the highest incidence as a first CV event throughout lifetime. The earliest incidence rise in MI occurred by 50 years and was followed by AF, stroke, PAD, and HF over the following decades. In women, the incidence of MI as a first CV event was highest between 50 and 60 years but was overtaken by AF by 65 years, stroke by 70 years, and HF by 85 years. Compared with women, men had therefore higher risk of first incident MI [2.22 (1.91–2.58)], PAD [1.88 (1.59–2.22)], AF [1.50 (1.35–1.67)], HF [1.39 (1.20–1.61)], VD [1.29 (1.00–1.66)], and stroke [1.15 (1.03–1.28)].
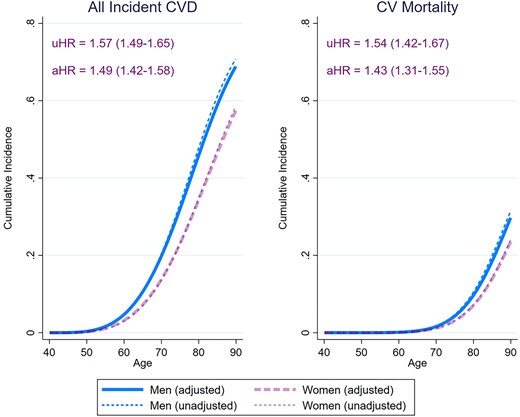
Sex-specific lifetime risk of all incident cardiovascular disease and cardiovascular mortality amongst 21 400 men and women participants of the European Prospective Investigation into Cancer-Norfolk study followed up for a median 26.2 years. The cause-specific hazard ratios were obtained from Weibull regression models. The adjusted estimates were obtained also adjusting for ethnicity, ethnicity, the Townsend deprivation index, systolic blood pressure, hypercholesterolaemia, diabetes mellitus, smoking status, alcohol consumption, body mass index, fruit and vegetable consumption, self-reported non-cardiovascular comorbidities (cancer, asthma, bronchitis), and medication (aspirin, antihypertensive agents, digoxin, lipid-lowering agents, and antidiabetic agents). The sex-specific cumulative incidence functions were determined using modified univariable and multivariable Royston–Parmar regression models, also taking into account the the competing risk of death (for incident cardiovascular disease) or non-cardiovascular mortality (for cardiovascular mortality). The cumulative incidence estimates from the multivariable models were obtained by setting the values of all covariates at their mean values within the cohort. CVD, cardiovascular disease; uHR, unadjusted cause specific hazard ratio (99% confidence interval); aHR, adjusted cause specific hazard ratio (99% confidence interval), men vs. women.
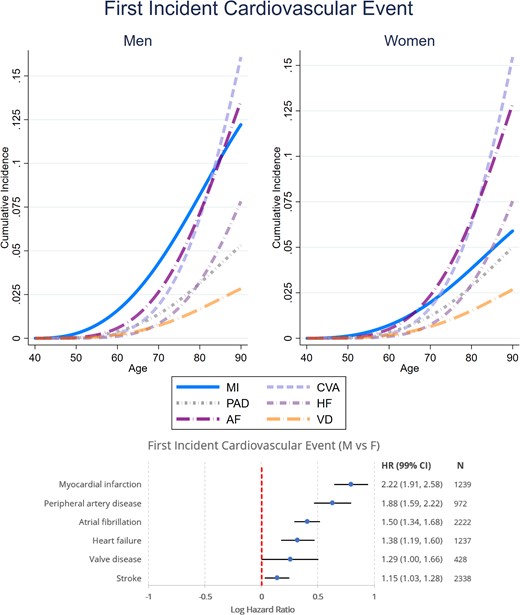
Sex-specific lifetime risk of different first incident cardiovascular diseases amongst 21 400 men and women participants of the European Prospective Investigation into Cancer-Norfolk study followed up for a median 26.2 years. The cause-specific hazard ratios were determined using a multivariable Weibull regression model also adjusting for ethnicity, ethnicity, the Townsend deprivation index, systolic blood pressure, hypercholesterolaemia, diabetes mellitus, smoking status, alcohol consumption, BMI, fruit and vegetable consumption, self-reported non-cardiovascular comorbidities (cancer, asthma, bronchitis), and medication (aspirin, antihypertensive agents, digoxin, lipid-lowering agents, and antidiabetic agents). The sex-specific cumulative incidence functions were determined using a modified multivariable Royston–Parmar regression model also taking into account the competing risk of death, setting the values of all covariates at their mean values within the cohort. MI, myocardial infarction; CVA, cerebrovascular accident; AF, atrial fibrillation; HF, heart failure; PAD, peripheral arterial disease; VD, valve disease; CV, cardiovascular; HR, cause specific hazard ratio (99% confidence interval), men vs. women.
Supplementary material online, Figure S2 details the results of the analyses stratifying by smoking status. The cause-specific hazard ratios for sex were similar amongst smokers and non-smokers for both incident CVD [1.63 (1.39–1.92) vs. 1.56 (1.48–1.65), respectively] and CV mortality [1.60 (1.25–1.92) vs. 1.56 (1.48–1.65), respectively]. In terms of absolute risk, active smokers experienced CVD and CV mortality earlier, with differences in absolute risks as high as 17.1% for incident CVD in men, 13.4% for incident CVD in women, 11.6% for CV mortality in men, and 9.7% for CV mortality in women.
Supplementary material online, Figure S3 details the results of the analyses stratifying by whether participants developed cancer during the study follow-up. The cause-specific hazard ratios for sex were similar amongst people with and without cancer for both incident CVD [1.43 (1.26–1.63) and 1.51 (1.42–1.60), respectively] and CV mortality [(1.48 (1.25–1.74) and 1.40 (1.28–1.55)].
Analyses of participants with prevalent cardiovascular disease
Figure 4 details the sex-specific lifetime risk of CV mortality and incident MI, stroke, HF, and PAD amongst patients with prevalent CVD. Compared with women, men with CVD had a higher lifetime risk of CV mortality [cause-specific hazard ratio—1.22 (1.12–1.33)], incident MI [1.63 (1.37–1.94)], incident PAD [1.56 (1.32–1.83)], and incident HF [1.27 (1.13–1.42)], but not incident stroke [0.95 (0.84–1.07)]. Figure 5 details the sex-specific lifetime risk of CV mortality amongst participants with different prevalent CV disorders. Compared with women, men had a significantly higher risk of CV mortality after MI [1.22 (1.02–1.45)] and stroke [1.23 (1.07–1.42)], but not after developing AF [1.12 (0.99–1.28)], HF [1.08 (0.94–1.25)], or PAD [1.17 (0.98–1.41)]. Supplementary material online, Figure S4 details differential treatment effects on sex-specific CV mortality amongst participants with prevalent CVD. After adjustment for potential confounders, men had higher likelihood of receiving lipid-lowering drugs [risk ratio (99% CI) −1.32 (1.16–1.50)], inhibitors of the renin-angiotensin-aldosterone system [1.45 (1.27–1.66)], and antidiabetic agents [2.00 (1.58–2.53)] as well as antihypertensive agents overall [1.06 (1.00–1.13)] compared with women throughout the duration of the study. There were, however, no statistically significant interactions between treatment with preventative agents and the male-associated excess risk of CV mortality.
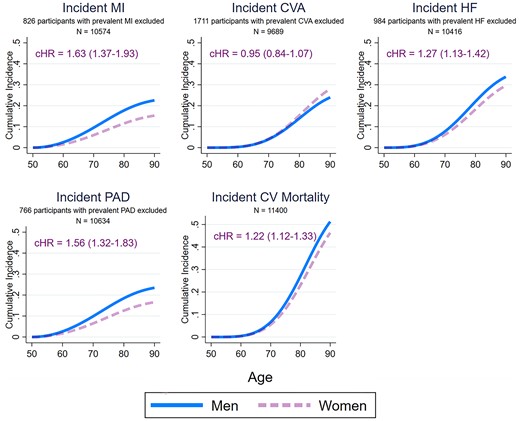
Sex-specific lifetime risk of different incident cardiovascular diseases and cardiovascular mortality amongst 11 400 men and women participants of the European Prospective Investigation into Cancer-Norfolk study with prevalent cardiovascular disease followed up for a median 17.5 years. Participants with a prevalent cardiovascular disorder were excluded from the analyses of incidence of the same disorder. The cause-specific hazard ratios were determined using multivariable Weibull regressions model also adjusting for ethnicity, ethnicity, the Townsend deprivation index, systolic blood pressure, hypercholesterolaemia, diabetes mellitus, smoking status, alcohol consumption, body mass index, fruit and vegetable consumption, self-reported non-cardiovascular comorbidities (cancer, asthma, bronchitis), and medication (aspirin, antihypertensive agents, digoxin, lipid-lowering agents, and antidiabetic agents). The sex-specific cumulative incidence functions were determined using modified multivariable Royston–Parmar regression models also taking into account the competing risk of death (for incident cardiovascular disorders) or non-cardiovascular mortality (for cardiovascular mortality), setting the values of all covariates at their mean values within the cohort. MI, myocardial infarction; CVA, cerebrovascular accident; AF, atrial fibrillation; HF, heart failure; PAD, peripheral arterial disease; CV, cardiovascular; cHR, cause specific hazard ratio (99% confidence interval), men vs. women.
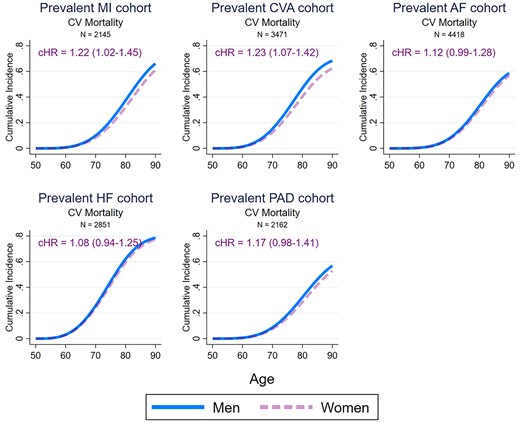
Sex-specific lifetime risk of cardiovascular mortality amongst men and women participants of the European Prospective Investigation into Cancer-Norfolk study with different prevalent cardiovascular diseases. The cause-specific hazard ratios were determined using multivariable Weibull regressions model also adjusting for ethnicity, ethnicity, the Townsend deprivation index, systolic blood pressure, hypercholesterolaemia, diabetes mellitus, smoking status, alcohol consumption, body mass index, fruit and vegetable consumption, self-reported non-cardiovascular comorbidities (cancer, asthma, bronchitis), and medication (aspirin, antihypertensive agents, digoxin, lipid-lowering agents, and antidiabetic agents). The sex-specific cumulative incidence functions were determined using modified multivariable Royston–Parmar regression models also taking into account the competing risk of non-cardiovascular mortality, setting the values of all covariates at their mean values within the cohort. MI, myocardial infarction; CVA, cerebrovascular accident; AF, atrial fibrillation; HF, heart failure; PAD, peripheral arterial disease; CV, cardiovascular; cHR, cause specific hazard ratio (99% confidence interval), men vs. women.
Discussion
In this large British population-based cohort, we have comprehensively characterized the sex differences in the lifetime risks of CVD incidence and mortality over a follow-up in excess of 25 years. Our analyses including >20 000 participants free of CVD at baseline have delineated that men had a higher lifetime absolute risk of up to ∼11% for any incident CVD compared with women (68.9% in men vs. 57.4% in women by the age of 90 years), after an extensive adjustment for relevant confounders. These differences were largely driven by incident MI and PAD, followed by AF and HF. There were no sex differences in incident stroke. We also described the sex-specific presentation patterns of first incident CV event over an extensive follow-up period: MI was the most common first CVD event in men until the eighth decade, while in women, this was overtaken by AF and stroke after the sixth decade. Men also had up to ∼6% higher lifetime absolute risk of CV mortality compared with women (29.7% in men vs. 23.5% in women by the age of 90 years). Interestingly, these differences were similar in univariable models, suggesting that they were not driven by sex differences in potential confounders, such as lifestyle factors, cardio-metabolic profile, or comorbidity burden.
Similar sex differences in incident CVD were also observed amongst the ∼11 000 participants with prevalent CVD. The sex differences in both incident CVD CV mortality amongst participants with prevalent CVD were less pronounced, with the male-associated excess relative risk halved in people with prevalent CVD. These differences were only observed amongst participants with prevalent MI and stroke, but not HF, AF, or PAD. This interesting pattern may be determined by the higher male-associated case fatality of incident CVD, leading to the selection of less severe phenotypes amongst men with prevalent CVD. Women were consistently undertreated with secondary CV preventative therapies throughout the duration of the study. These differences did not result in any significant treatment effects on the male-associated excess risk of CV mortality amongst participants with prevalent CVD.
This study presents the most comprehensive analysis of sex differences in lifetime risks of a wide range of relevant CV outcomes both in people with and without prevalent CVD of the same population, utilizing a large cohort with the longest follow-up period described so far. Our results reinforce our current understanding of this important topic by extending previous findings and adding important insights. A previous Dutch cohort study including ∼8400 participants free from CVD at baseline who were followed up for a median of 13.5 years found less marked sex differences in incident CVD or CV mortality but described a similar sex-specific pattern of first incident CVD event, with men more likely to suffer coronary heart disease first while cerebrovascular disease was the predominant first presentation in women.5 A similar pattern was also described in other cohorts.3,8 Our results were able to not only confirm this but also show that stroke incidence in women is preceded very closely by incident AF, highlighting the importance of appropriate AF management in women for stroke prevention.
A previous study of the UK Biobank with a maximum follow-up of 9 years found that men had an overall higher incidence of stroke compared with women over a maximum follow-up of 9 years.24 While our study found a numerically higher cumulative incidence of stroke in men, this difference failed to reach statistical significance despite having observed ∼3400 incident stroke events throughout the duration of the study. Our results therefore highlight that sex differences in stroke incidence may be attenuated over longer follow-up, given previous observations that stroke incidence in women significantly increases in later life.25 It has been previously recognized that male sex is a significant risk factor for incident HF, particularly HF with a reduced ejection fraction.26 Our study reinforces these findings not only amongst people free of CVD at baseline but also amongst those with prevalent CVD. Men have higher burden of AF risk factors and incident AF compared with women.10,27,28 Women with AF had higher rates of adverse outcomes including stroke and mortality.10 Our results confirm the male-associated lifetime excess risk of incident AF, even after extensive adjustment for relevant risk factors. Recent studies have shown that women may have a higher burden of PAD, especially in later life, also recognizing the potential relative under-diagnosis of this condition in women.29,30 Adverse outcomes amongst PAD patients have been previously described as similar between men and women.30 However, a recent Swedish study including ∼52 000 participants with prevalent PAD followed up for a maximum of 8 years found a 10–20% male-associated excess of CV events and mortality.9 Our analyses suggest that the sex-specific lifetime incidence of PAD largely mirrored MI incidence, with a clear male-associated excess risk both in participants with and without prevalent CVD. We did not find any statistically significant CV mortality differences between men and women with PAD.
The results of our study allow the derivation of several important implications for clinical practice. Firstly, we highlight the need to focus primary preventative efforts in a sex-specific manner. Men require early and heavy focus on MI prevention given their two-fold relative increase in lifetime risk of MI with early onset as first-ever incident CVD shortly after the age of 50 years. On the other hand, in women, first incident CVD was more likely to manifest as AF and stroke, with a later onset from the age of 60 years onwards, suggesting the primary preventative efforts in women should focus on specific stroke risk factors, including AF, diabetes, hypertension, and obesity.24,31 Furthermore, routine screening for AF in this age group amongst women may be an effective intervention to reduce overall CVD burden, although further interventional studies are required to evaluate the cost and clinical effectiveness of this approach. Enhanced stroke preventative efforts are also warranted in women with female-specific risk factors such as gestational hypertension, pre-eclampsia, multiparity, and early menopause.31 In terms of the secondary preventative setting, our study highlights that the male-associated excess relative risk of adverse CV events is almost halved in people with prevalent CVD. This is an important observation, especially as it pertains to the same unselected population, minimizing issues with heterogeneity which may have affected previous similar estimates.32 This may be explained by the higher case fatality of incident CV events in men, driving the selection of less severe phenotypes amongst men with prevalent CVD. Interestingly, further analysis of specific prevalent CV conditions revealed no significant sex differences in CV mortality amongst patients with prevalent AF, HF, or PAD in the context of high absolute CV mortality rates for both men and women. This is particularly important given the relative under-treatment of women, which was observed not only in our cohort but also in several previous studies9,11–13 and reinforces the importance of minimizing sex disparities in secondary prevention in contemporary practice. Clinicians should evaluate their services to detect whether such disparities exist in their clinical services and aim to understand the driving factors which may be targeted effectively by specific local interventions.
This study has several strengths. Firstly, we included a large cohort of participants selected from the general population in Norfolk and were followed up for an extensive period between 1993–1998 and 2022 with low attrition rates, leading to a median follow-up time of 26 years, the longest described to date in the literature. This allowed us to delineate sex differences in CV risk both in individuals with and without pre-existing CVD from the same population. Furthermore, data linkage with hospital admissions within the National Health Service over the follow-up period allow accurate determination of all incident CV events, including AF, PAD, and HF. Record linkage with death certification data also allowed robust ascertainment of CV mortality. We were able to adjust for prospectively collected data on relevant confounders including CV medication, our models also accounting for time-updated covariates as informed by measurements at subsequent health checks of the study. We employed robust survival analyses methods which also account for competing risks, allowing accurate ascertainment of absolute risk values. Therefore, having undertaken a comprehensive analysis powered by an adequate sample size, a long follow-up period, and a robust statistical methodology, our results are an important contribution to current knowledge of sex differences in CVD.
Limitations
We also acknowledge some limitations. As a volunteer study with long-term follow-up, healthy volunteer bias needs to be considered. Indeed, our absolute rates of incident CVD at age 55 were substantially lower than in a similar study of a Dutch cohort,5 which may be driven by healthy volunteer bias. Furthermore, our included cohort were 99.6% White British, and therefore, our results may not be generalizable to more ethnically diverse populations. We were also unable to explore ethnic differences in sex disparities and treatment. We also lacked data on sexual orientation and were unable to provide CVD risk estimates across such groups. As an observational study, residual confounding cannot be excluded. Finally, we were unable to account for any changes in medications over the last 10–15 years of the study follow-up, as these data were not collected after the third health check (2004–12), and it is likely that prescription rates of antihypertensive, lower lipid, and antidiabetic medications may have increased substantially over this timeframe as participants entered their seventh decade and experienced increasing CVD rates.
Future directions
The results of our study have several important implications for further research efforts. The different patterns of presentation of first CV event should warrant formulation of sex-specific CVD preventative guidelines. Our results showing that the predominant presentations of CVD in women after their sixth decade were AF and stroke suggest that further investigations assessing whether routine AF screening in this group is warranted to reduce overall CVD burden in this group, especially in the context of recent results from the STROKESTOP study supporting clinical and cost effectiveness of this intervention.33,34 Further research efforts should focus on evaluating the main drivers of the sex disparities in outcomes delineated in this study, with a particular focus on factors such as differential treatment and prevention as well as the impact of race/ethnicity and socio-economic factors. Finally, reporting sex- and race-specific estimates in future CV epidemiological investigations is essential in order to explore these disparities in different settings.
Conclusions
This study provides a comprehensive description of sex differences in lifetime CV risk using a large, population-based cohort with >25 years of follow-up. Men had a higher lifetime risk of incident MI, PAD, AF, and HF, but not stroke. First presentation of CVD in men was driven predominantly by MI until their eighth decade, while in women this was driven by AF and stroke after their sixth decade. The male-associated excess risk of CV mortality observed in participants free of CVD at baseline was attenuated in those with prevalent CVD. Women experienced absolute lifetime CV mortality risks as high as men amongst participants with prevalent AF, HF, and PAD. These results provide evidence to develop and implement sex-specific primary and secondary CV preventative strategies in order to more effectively address ongoing global burden of CVD.
Supplementary material
Supplementary material is available at European Journal of Preventive Cardiology.
Acknowledgements
We are grateful to all the participants who have been part of the project and to the many members of the study teams at the University of Cambridge who have enabled this research. We would like to acknowledge the principal investigators and staff of the EPIC-Norfolk study. We would also like to thank Dr Graham Horgan, PhD (Principal Consultant for Human Health and Nutrition, Biomathematics & Statistics Scotland), for his help and support with the statistical analyses.
Authors’ contributions
T.A.P., D.K.D., and P.K.M. conceived the study. N.J.W. and K.-T.K. are PIs of EPIC-Norfolk cohort. TAP performed the literature search, data analysis, and writing the first draft of the paper. T.A.P. and .P.K.M. verified the underlying data. All authors contributed in writing the paper. P.K.M. is the guarantor.
Funding
The EPIC-Norfolk study (DOI 10.22025/2019.10.105.00004) has received funding from the Medical Research Council (MR/N003284/1 and MC-UU_12015/1) and Cancer Research UK (C864/A14136).
Data availability
The data underlying this study are available from the EPIC-Norfolk Steering Committee upon reasonable request to the authors. The Stata code used to perform the analyses has been supplied as Supplementary material online (see Supplementary material online, File S1).
References
Author notes
Conflict of interest: None declared.

Comments