


Abstract
The Fick principle states that oxygen uptake (V̇O2) is cardiac output (Qc) * arterial-venous O2 content difference [ΔC(a-v)O2]. Blood flow distribution is hidden in Fick principle, and its relevance during exercise in heart failure (HF) is undefined. To highlight the role of blood flow distribution, we evaluated peak exercise V̇O2, Qc, and ΔC(a-v)O2, before and after HF therapeutic interventions.
Symptom-limited cardiopulmonary exercise tests with Qc measurement (inert gas rebreathing) was performed in 234 HF patients before and 6 months after successful exercise training, cardiac resynchronization therapy, or percutaneous edge-to-edge mitral valve repair. Considering all tests (n = 468), a direct correlation between peakV̇O2 and peakQc (R2 = 0.47) and workload (R2 = 0.70) was observed. Patients were grouped according to treatment efficacy in Group 1 (peakV̇O2 increase >10%, n = 93), Group 2 (peakV̇O2 change between 0 and 10%, n = 60), and Group 3 (reduction in peakV̇O2, n = 81). Post-treatment peakV̇O2 changes poorly correlated with peakQc and peakΔC(a-v)O2 changes. Differently, post-procedure peakQc vs. peakΔC(a-v)O2 changes showed a close negative correlation (R2 = 0.46), becoming stronger grouping patients according to peakV̇O2 improvement (R2 = 0.64, 0.79, and 0.58 in Groups 1, 2, and 3, respectively). In 76% of patients, peakQc and ΔC(a-v)O2 changes diverged regardless of treatment.
The bulk of these data suggests that blood flow distribution plays a pivotal role on peakV̇O2 determination regardless of HF treatment strategies. Accordingly, for assessing HF treatment efficacy on exercise performance, the sole peakV̇O2 may be deceptive and the combination of V̇O2, Qc and ΔC(a-v)O2, must be considered.
Lay Summary
This study aimed to understand how oxygen uptake during exercise is affected by heart failure therapeutic intervention. We evaluated 234 heart failure patients before and after treatments such as exercise training, cardiac resynchronization therapy, or mitral valve repair, finding that changes in oxygen uptake were poorly correlated with changes in cardiac output and oxygen content difference between arteries and veins. However, we observed a strong negative correlation between changes in cardiac output and oxygen content difference, especially in patients with significant improvement in oxygen uptake. This suggests that blood flow distribution is crucial for oxygen uptake during exercise, regardless of treatment. Therefore, relying solely on oxygen uptake may not accurately assess treatment effectiveness, and considering a combination of oxygen uptake, cardiac output, and oxygen content difference is important.
See the editorial comment for this article ‘Unravelling the complexities of exercise physiology in heart failure: begin with deconstructing the Fick principle’, by E.H. Van Iterson, https://doi.org/10.1093/eurjpc/zwae268.
Oxygen uptake during exercise was strongly related to cardiac output and workload.
Changes in cardiac output and oxygen content difference were closely related after treatments, especially in patients with significant improvement in oxygen uptake.
Introduction
The Fick principle states that oxygen uptake (V̇O2) is equal to cardiac output (Qc) * arterial-venous O2 content difference [ΔC(a-v)O2].1 Consequently, for the same V̇O2, if Qc increases, ΔC(a-v)O2 reduces, and vice versa, if Qc reduces, ΔC(a-v)O2 increases. Qc is cardiac function and ΔC(a-v)O2 has been used as a metric to reflect the muscle capacity to extract O2.2–7 However, evidence suggests that changes in Qc and ΔC(a-v)O2 do not completely reflect changes in VO2.4,8,9 As a matter of fact, V̇O2 is directly related to Qc, lung function, and haemoglobin level, as well as diffusion capacity of O2 from the capillaries to the mitochondria and to muscle performance.3,9,10 In the Fick principle, the concept of distribution of blood flow is hidden. This is a relevant issue in normal subjects since during exercise, blood flow to the working muscle increases more than total blood flow.9 Differently in heart failure (HF), maladaptive vasoconstrictor control mechanisms prevent redistribution of blood flow from non-working muscles, kidney, gut, and liver to working muscles.11,12 This is relevant even at rest, where VO2 progressively reduces as HF severity increases, so VO2 needs to be measured and cannot be estimated by any prediction formula.13,14 Moreover, during exercise, distribution of blood flow is difficult to be measured and only indirect data are available to support its role.9,15 In an attempt to analyse the presence and relevance of blood flow distribution during exercise, we evaluated the three components of the Fick principle, V̇O2, Qc, and ΔC(a-v)O2, during exercise before and after a clinical HF intervention aimed at improving exercise through different mechanisms. These included cardio-respiratory exercise training, cardiac resynchronization therapy (CRT), and percutaneous edge-to-edge mitral valve repair (pMVR). Indeed, purported primary effects of exercise training are blood flow increase and oxygen extraction by the muscles, of CRT is Qc increase, and of pMVR are Qc increase and capillary pulmonary pressure reduction, respectively.16–18
In brief, the purpose of the present study was to evaluate whether blood flow redistribution during exercise is affected by different interventions aimed at improving HF status.
Methods
Study population
We evaluated the results from HF patients regularly followed at HF Unit of Centro Cardiologico Monzino Milan enrolled in three different treatment protocols concerning haemodynamic effects of exercise training, CRT, and pMVR reported in previous publications.8,19,20 Of note, the exercise training study included patients evaluated at Inselspital, Bern University Hospital, Bern, Switzerland. All patients had been familiarized with cardiopulmonary exercise testing (CPET). Study inclusion criteria were HF due to ischaemic or dilated cardiomyopathy, stable clinical conditions, New York Heart Association (NYHA) class II or III, optimal HF treatment, and capability of performing CPET with Qc determination by inert gas rebreathing (IGR) method.21,22 Further inclusion criteria were applied for each protocol, specifically left ventricular ejection fraction (LVEF) < 40% for the exercise training protocol,8 the presence of the protocol-specific criteria for CRT selection,20 and clinical indication according to guidelines for CRT and pMVR protocols,19 respectively.
Study exclusion criteria were any comorbidities directly affecting exercise performance, planned cardiovascular or extra-cardiac procedures, and significant pulmonary dysfunction.
In each study, HF patients who meet the study inclusion/exclusion criteria were asked to participate to the different studies and eventually recruited consecutively. Of note, the three studies were done at different times being exercise training the oldest study, CRT intermediate, and pMVR the most recent one. Each study complied with the Declaration of Helsinki, the locally appointed Scientific and Ethics Committees approved all the research protocols, and informed consent was obtained from all patients. The present analysis of data was approved by the local Ethics Committee (CCM1896). Of note, the present was a retrospective analysis of data obtained by three independent prospective studies. The analysis plan was developed in advance and built knowing the results of each original study except for the analysis of different groups based on peak VO2 changes, which was done a posteriori.8,19,20
Study design
Pre-treatment evaluation
All patients received a careful clinical evaluation including clinical history and recent instrumental data to confirm treatment selection. All subjects underwent an electrocardiogram, a standard echocardiogram, a CPET (cycle ergometer) for familiarization purposes, and at least one teaching session to familiarize subjects with IGR methodology. Finally, a CPET based on a personalized ramp protocol aimed at achieving maximal effort was performed along with Qc measurement by IGR at rest and at peak exercise. ΔC(a-v)O2 was calculated following the Fick principle as ΔC(a-v)O2 = V̇O2/Qc.
Post-treatment evaluation
At the end of the rehabilitation programme and after at least 6 months of follow-up in case of CRT and pMVR, patients underwent clinical and instrumental evaluation, including a CPET with Qc measurement and using the same ramp workload protocol as in the pre-treatment study. Of note, patients who underwent CRT or pMVR were not enrolled in any rehabilitation programme.
Echocardiography
Standard 2D, colour, and spectral Doppler measurements were performed. Left ventricular ejection fraction was determined using the Simpson rule algorithm by tracing the left ventricular 2D area in standard apical two- and four-chamber views at end-systole and end-diastole.
Cardiopulmonary exercise testing
Cardiopulmonary exercise testing was performed on a cycle ergometer with progressive work rate increase in a ramp pattern, after 3 min of rest and 3 min of unloaded cycling. Expired O2, carbon dioxide (CO2), and ventilation were measured breath by breath (Innocor® rebreathing system, Innovision A/S, Odense, Denmark). A 12-lead electrocardiogram was recorded continuously during the test (Marquette, Case800, Milwaukee, WI). Patients were strongly encouraged to perform a maximal test, allowing the final 30 s for the rebreathing manoeuvre. The work rate increase during the test was individualized to achieve peak exercise in 8–10 min during the increasing work rate period.23 The CPET was interpreted and reported as previously outlined in detail.24 PeakV̇O2 values were averaged over 20 s.
Qc measurement
Non-invasive Qc measurements were performed during CPET at rest and at peak exercise using the Innocor rebreathing system.22 The IGR technique has been previously described in detail.21 In brief, IGR uses an oxygen-enriched mixture of an inert soluble gas [0.5% nitrous oxide (N2O)] and an inert insoluble gas [0.1% sulfur hexafluoride (SF6)] from a pre-filled bag. Patients breathed into a respiratory valve via a mouthpiece and a bacterial filter with a nose clip. At the end of the expiration, the valve is activated, so that the patient re-breathes from the pre-filled bag for a period of 10–20 s. After this period, the patient is switched back to ambient air, and the Qc measurement is terminated. Photo-acoustic analysers measure gas concentration over a five-breath interval. SF6 is insoluble in blood, and it is used to determine lung volume. N2O is soluble in blood, and its concentration decreases during rebreathing with a rate proportional to pulmonary blood flow (PBF), which is the blood flow that perfuses the part of the alveoli where gas exchange takes place. Qc is equal to PBF when the arterial oxygen saturation measure (SpO2) is high (>98% using the pulse oximeter). In a case of minor desaturation, shunt flow estimation is added to PBF to calculate Qc. Differently, in the case of SpO2 ≤ 90%, the estimation of shunt flow became questionable and Qc measurement by IGR unreliable.
Statistical analysis
Continuous variables are presented as mean ± standard deviation (SD). When the distribution was not normal, variables were log-transformed to allow homogeneous comparisons. Differences between before and after treatment were evaluated by paired t-test. Differences between multiple groups were assessed by repeated measures analysis of variance, accounting for both between-group and within-group differences, followed by Bonferroni post hoc correction. Correlation coefficients between the three components of the Fick principle were assessed by best fit method. All tests were two sided. A P < 0.05 was considered statistically significant. Analyses were performed using IBM SPSS statistics 27.
Results
We studied 273 HF patients who were treated with one of the following interventions: pMVR, CRT, and exercise training. Thirty-nine patients did not perform the 6-month evaluation due to death or inability to exercise (3 cases each); cerebral stroke, pMVR failure, or peak exercise measurement failure were reported in 2 cases each; lung cancer, aortic aneurism, and atrial fibrillation (CRT group) were reported in 1 patient each; and 24 patients withdrew informed consent or were lost to follow-up. The remaining 234 patients were included in the present analysis. Of these, 71 underwent pMVR, 93 CRT, and 70 exercise training. Table 1 reports demographic data, HF aetiology, NYHA class, cardiac ultrasound data, and therapy before intervention for the entire study population and according to treatment.
Pre-intervention characteristics of the entire population and according to the three procedures undertaken
| Entire population, n = 234 | Exercise training, n = 70 | CRT, n = 93 | pMVR, n = 71 | P | |
|---|---|---|---|---|---|
| Age (years) | 68 ± 11 | 62 ± 10 | 67 ± 10 | 75 ± 9 | <0.01 |
| Sex (male/female) | 182/52 | 54/16 | 77/16 | 51/20 | 0.28 |
| Heart failure aetiology (ischaemic/not ischaemic) | 124/110 | 37/33 | 56/37 | 31/40 | ns |
| NYHA class | 2.4 ± 0.6 | 2.0 ± 0.5 | 2.5 ± 0.5 | 2.5 ± 0.6 | <0.01 |
| EDV (mL) | 193 ± 73 | 192 ± 76 | 212 ± 69 | 168 ± 68 | <0.01 |
| ESV (mL) | 129 ± 67 | 135 ± 70 | 150 ± 60 | 93 ± 58 | <0.01 |
| LVEF (%) | 34 ± 12 | 32 ± 10 | 28 ± 6 | 46 ± 13 | <0.01 |
| ACEi/ARB/ARNI | 85% | 93% | 89% | 77% | <0.01 |
| Beta-blockers | 80% | 96% | 83% | 62% | <0.01 |
| Loop diuretic | 79% | 80% | 81% | 77% | <0.01 |
| MRA | 45% | 57% | 38% | 39% | <0.01 |
| Antiplatelet therapy | 57% | 57% | 62% | 52% | ns |
| Oral anticoagulant | 33% | 40% | 26% | 33% | ns |
| Digoxin | 6% | 7% | 2% | 10% | ns |
| Amiodarone | 34% | 29% | 43% | 30% | ns |
CRT, cardiac resynchronization therapy; pMVR, percutaneous mitral valve repair; NYHA, New York Heart Association; EDV, end-diastolic volume; ESV, end-systolic volume; LVEF, left ventricular ejection fraction; ACEi, angiotensin-converting enzyme inhibitor; ARB, angiotensin receptor blocker; ARNI, angiotensin receptor-neprilysin inhibitor; MRA, mineralocorticoid receptor antagonist; ns, not significant.
Major resting and peak exercise cardiorespiratory data of the entire population and of the three clinical interventions are reported in Table 2.
Exercise parameters of the entire population and according to the three procedures undertaken
| Total n = 234 | Exercise training n = 70 | CRT n = 93 | pMVR n = 71 | ||||||
|---|---|---|---|---|---|---|---|---|---|
| Pre | Post | Pre | Post | Pre | Post | Pre | Post | Pb | |
| Rest V̇O2 (mL/min) | 309 ± 87 | 307 ± 69NS | 337 ± 108 | 312 ± 74NS | 301 ± 82 | 312 ± 70NS | 294 ± 62 | 294 ± 59NS | 0.460 |
| Rest HR (b.p.m.)a | 71 ± 13 | 69 ± 13* | 75 ± 15 | 73 ± 15NS | 67 ± 12 | 66 ± 10NS | 71 ± 12 | 69 ± 12NS | 0.016 |
| Rest Qc (L/min)a | 3.3 ± 1.0 | 3.5 ± 1.0* | 3.7 ± 1.1 | 3.9 ± 1.1NS | 3.2 ± 1.0 | 3.4 ± 0.9NS | 3.1 ± 0.8 | 3.3 ± 0.8NS | 0.005 |
| Rest ΔC(a-v)O2 (mL/100 mL)a | 9.9 ± 3.6 | 9.3 ± 2.8NS | 9.8 ± 4.3 | 8.6 ± 2.6* | 9.9 ± 3.5 | 9.8 ± 3.0NS | 10 ± 2.9 | 9.4 ± 2.5NS | 0.065 |
| Hb (g/dL) | 13.6 ± 1.6 | 13.3 ± 1.5NS | 13.6 ± 1.7 | 13.3 ± 2NS | 13.3 ± 1.4 | 13.1 ± 1.4NS | 13.7 ± 1.7 | 13.6 ± 1.6NS | 0.141 |
| Peak workload (Watt)a | 63 ± 27 | 67 ± 29* | 69 ± 29 | 73 ± 32* | 67 ± 30 | 70 ± 30* | 54 ± 18 | 56 ± 19NS | <0.001 |
| Peak V̇O2 (mL/min) | 1023 ± 351 | 1089 ± 384* | 1111 ± 403 | 1191 ± 441* | 1067 ± 357 | 1156 ± 377* | 875 ± 226 | 897 ± 244NS | <0.001 |
| Peak V̇O2/kg (mL/kg/min) | 13.5 ± 3.9 | 14.3 ± 4.5* | 14.1 ± 3.9 | 15.1 ± 4.6* | 13.8 ± 3.8 | 14.9 ± 4.6* | 12.4 ± 3.7 | 12.4 ± 4.2NS | <0.001 |
| Peak HR (b.p.m.)a | 104 ± 22 | 102 ± 21NS | 110 ± 23 | 108 ± 23NS | 102 ± 20 | 98 ± 18* | 100 ± 23 | 100 ± 20NS | 0.146 |
| Peak Qc (L/min)a | 6.1 ± 1.9 | 6.9 ± 2.2* | 6.6 ± 2.2 | 7.3 ± 2.5° | 6.2 ± 1.8 | 7.0 ± 2.2* | 5.6 ± 1.5 | 6.3 ± 1.6* | <0.001 |
| Peak C(a-v)O2 (mL/100 m)a | 17.0 ± 4.1 | 16.3 ± 4.6* | 17.5 ± 5.1 | 16.6 ± 4.1NS | 17.1 ± 3.0 | 16.7 ± 2.9NS | 16.3 ± 4.0 | 14.7 ± 3.8* | 0.002 |
| Peak RER | 1.05 ± 0.11 | 1.05 ± 0.10NS | 1.04 ± 0.08 | 1.04 ± 0.08NS | 1.06 ± 0.12 | 1.05 ± 0.11NS | 1.04 ± 0.11 | 1.05 ± 0.11NS | 0.752 |
| V̇O2 AT (mL/min) | 740 ± 202 | 795 ± 240* | 723 ± 167 | 784 ± 222* | 802 ± 231 | 864 ± 270* | 676 ± 167 | 703 ± 171* | 0.003 |
| V̇E/VCO2 slope | 35 ± 8 | 34 ± 8NS | 32 ± 7 | 33 ± 7NS | 37 ± 8 | 35 ± 10* | 35 ± 7 | 35 ± 7NS | 0.344 |
VO2, oxygen consumption; HR, heart rate; Qc, cardiac output; ΔC(a-v)O2, arterial-venous oxygen difference; Hb, haemoglobin; RER, respiratory equivalent ratio; AT, anaerobic threshold; V̇E, ventilation; V̇CO2, carbon dioxide production; V̇O2, oxygen uptake.
NS: (post vs. pre) not significant; *: (post vs. pre) P < 0.05.
aNon-normally distributed variables were log transformed and compared by t-test. Bold identifies statistical significant comparisons.
bANOVA repeated measures.
The best fit correlation between V̇O2 vs. Qc and V̇O2 vs. workload at peak exercise in the entire population, both before and after treatments, is reported in Figure 1A and B, respectively. We confirmed the close correlation between peakV̇O2 and Qc and peak workload.
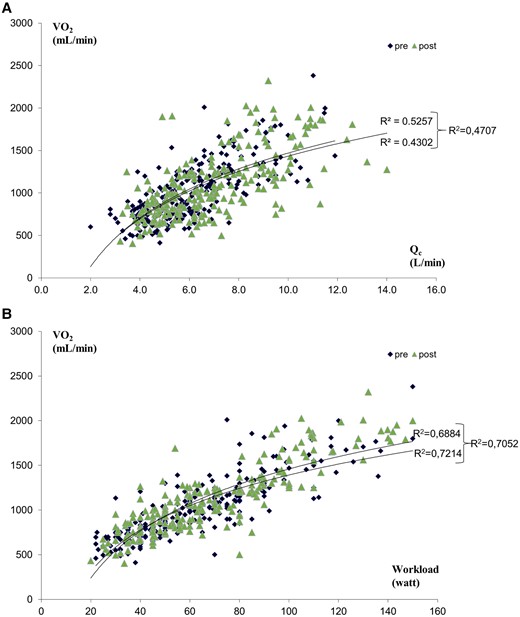
Correlation between V̇O2 and Qc (A) and between V̇O2 and workload (B) pre- and post-treatments in 234 heart failure patients’ population.
Patients were grouped according to treatment efficacy in Group 1 (peakV̇O2 increase >10%), Group 2 (peakV̇O2 change between 0 and 10%), and Group 3 (reduction in peakVO2 with treatment). In parallel with peak V̇O2 changes, changes in peak workload and peak Qc were observed (Table 3).
Differences in patients grouped according to treatment efficacy (ΔpeakVO2)
| Group 1 (ΔpeakVO2 > 10%), n = 93 | Group 2 (ΔpeakVO2 0–10%), n = 60 | Group 3 (ΔpeakVO2 < 0), n = 81 | P | |
|---|---|---|---|---|
| ΔPost–pre peak V̇O2 (%) | 28 ± 16*° | 4 ± 4°^ | −13 ± 13*^ | <0.001 |
| ΔPost–pre peak Qc (%)a | 29 ± 34*° | 10 ± 36^ | 5 ± 23^ | <0.001 |
| ΔPost–pre peak ΔC(a-v)O2 (%)a | 5 ± 32° | 5 ± 36° | −13 ± 22*^ | <0.001 |
| ΔPost–pre peak workload (%)a | 19 ± 24*° | 8 ± 13°^ | −4 ± 16*^ | <0.001 |
| Pre-treatment peak V̇O2 (mL/min) | 12.7 ± 3.6° | 13.5 ± 4 | 14.4 ± 3.8 | 0.002 |
| Pre-treatment peak Qc (L/min)a | 5.9 ± 1.8 | 6.4 ± 2 | 6.1 ± 1.8 | ns |
| Pre-treatment peak C(a-v)O2(mL/100 mL)a | 16.5 ± 4 | 17 ± 4.4 | 17.7 ± 3.9 | ns |
| Pre-treatment peak workload (watt)a | 62 ± 27 | 67 ± 27 | 63 ± 27 | ns |
VO2, oxygen consumption; Qc, cardiac output; ΔC(a-v)O2, arterial-venous oxygen difference; V̇O2, oxygen uptake; ns, not significant.
°P < 0.001 vs. Group 3; *P < 0.001 vs. Group 2; ^P < 0.001 vs. Group 1.
aNon-normally distributed variables.
A correlation between post-procedure–pre-procedure peakV̇O2 vs. post-procedure–pre-procedure peak workload (R2 = 0.226) was observed in the entire study population (see Supplementary material online, Figure S1). Similar correlations were observed when exercise training, CRT, and pMVR were considered separately: exercise training R2 = 0.19, CRT R2 = 0.24, and pMVR R2 = 0.26.
In terms of the effect of treatments on changes in Fick variables between post-procedure–pre-procedure peak V̇O2 vs. peak Qc, the relationship was poor across the entire population (Figure 2A) as was the correlation between post-procedure and pre-procedure peakV̇O2 vs. peakΔC(a-v)O2 (Figure 2B). However, following the different haemodynamic actions of the three treatments, some differences were observed; specifically, the peak V̇O2 vs. peak Qc correlation was R2 = 0.02, R2 = 0.27, and R2 = 0.16 for exercise training, CRT, and pMVR, respectively. As regards post-procedure—pre procedure peakV̇O2 vs. peakΔC(a-v)O2, the correlation was R2 = 0.04, R2 = 0.25, and R2 = 0.37 for exercise training, CRT, and pMVR, respectively.
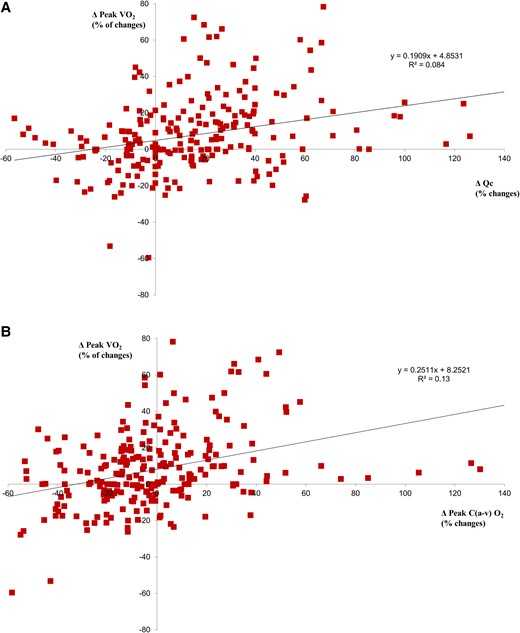
Correlation between peak V̇O2 vs. Qc and vs. ΔC(a-v)O2. (A) Post-treatment–pre-treatment peak V̇O2 vs. post-treatment–pre-treatment peak Qc relationship. (B) Post-treatment–pre-treatment peak V̇O2 vs. post-treatment–pre-treatment peak ΔC(a-v)O2 relationship.
The post-procedure–pre-procedure changes in peak exercise Qc vs. ΔC(a-v)O2 showed a close negative correlation in the entire study population (R2 = 0.46; Figure 3A). This correlation became stronger when separately considering patients who improved peakV̇O2 by >10% (Group 1, R2 = 0.64), patients who changed peakV̇O2 between 0 and 10% (Group 2, R2 = 0.79), and patients who showed a reduction in peakV̇O2 (Group 3, R2 = 0.58; Figure 3B and Table 3). The correlation was progressively shifted upwards and rightwards from Group 3 to Group 1. Considering different treatment strategies separately, the post-procedure–pre-procedure changes in peak exercise Qc vs. ΔC(a-v)O2 were R2 = 0.68, 0.22, and 0.20 for exercise training, CRT, and pMVR, respectively (see Supplementary material online, Figure S2A–C). Haemodynamic data of the entire study population are reported according to the quadrant (Figure 3A). Of note, the greatest peakV̇O2 and workload increases were observed in patients belonging to the right upper quadrant, but the greatest Qc increase was observed in those in the right lower quadrant. Indeed, post-procedure–pre-procedure changes between Qc vs. ΔC(a-v)O2 were consensual in 24% of cases in the entire study population and in 16, 28, and 27% of cases in exercise training, CRT, and pMVR groups, respectively.
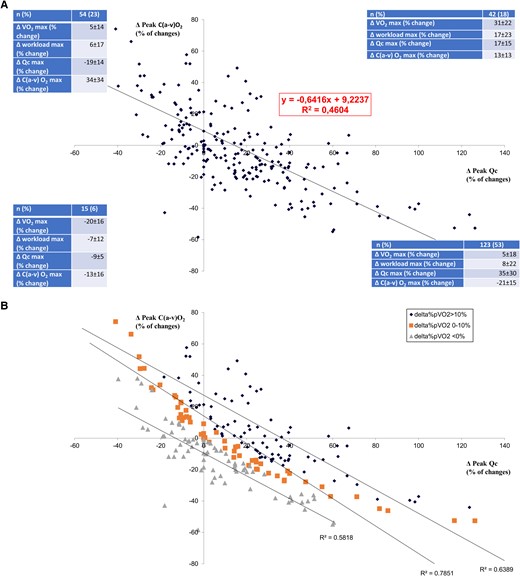
Correlation between peak exercise changes of ΔC(a-v)O2 vs. Qc. (A) Post-treatment–pre-treatment peak ΔC(a-v)O2 vs. post-treatment–pre-treatment peak Qc relationship. (B) Post-treatment–pre-treatment peak ΔC(a-v)O2 vs. post-treatment–pre-treatment peak Qc relationship, as in (A), but considering separately patients who improved peak V̇O2 by >10%, patients with peak V̇O2 between 0 and 10%, and patients who reduced peak V̇O2.
Discussion
The present study, applying consolidated parameters of exercise haemodynamic pre- and post-different therapeutic interventions, confirms a pivotal role of blood flow distribution on exercise performance in HF patients.25 Indeed, the Fick formula is based on the conservation of mass principle and report the correlation between VO2, Qc, and ΔC(a-v)O2 and, per se, is not misleading as suggested, provocatively, in the present report title. However, misleading may be its arbitrary application on the effect of exercise on changes of Fick generating parameters. Indeed, changes in VO2 after any intervention may be due to changes in Qc and/or ΔC(a-v)O2 that may be in parallel or not so that VO2 may not be assumed as always and fully indicative of the results of an intervention.
We measured resting and exercise Qc by IGR, which is a reliable technique in patients without cardiac disease or significant intrapulmonary shunt.21 Indeed, a few previous studies demonstrated the reliability of IGR Qc measurements during exercise.26,27 However, several studies reported that Qc measure by IGR is reliable even in this condition and does not alter main cardiopulmonary parameters.26,28 Nonetheless, IGR requires patient’s collaboration and instruction. Accordingly, several IGR familiarization sessions were completed before the study. The use of familiarization sessions resulted in only rare failure of IGR at peak exercise, which occurred in only in two cases. As regards IGR technique, it must be acknowledge that a limited misalignment between peak exercise VO2 and Qc measures exists. We used VO2 data collected in the 20 s preceding the IGR technique that lasted up to 10 s so that the error added by signal misalignment, if any, is really minor.
The presence of blood flow redistribution during exercise has been suggested for many years but it has been thought to be more of a ‘dogma’, in part because it is difficult to quantify. Indeed, it has been suggested that to optimally redistribute blood flow during exercise, there must be vasodilation to areas in need, such as skeletal muscle, and sympathetically mediated vasoconstriction to non-exercising areas, such as viscera and adipose tissue. Among the evidence of variable blood flow distribution in HF are data comparing O2 content in the femoral vein (CfvO2) and pulmonary artery (CpaO2) and data comparing leg blood flow vs. Qc. These studies have shown that CpaO2 and leg blood flow were closer to CfvO2 and Q, respectively, the greater the severity of HF.29–35 These data were suggestive of redistribution of blood flow towards the exercising muscle so that the percentage of Qc towards the working muscle was greater the greater the HF severity. However, these studies are challenging to perform and are invasive, requiring simultaneous femoral vein blood flow and Qc measurements or pulmonary artery, femoral vein, and systemic artery sampling during exercise.29,34–36 Thus, there have been a very limited number of such studies with very few patients as well as some uncertainness regarding the reliability of the measurements. The current study extends these previous efforts in that it is based on a sizable number of patients and applied consolidated techniques. Indeed, we used post- vs. pre-procedural exercise changes of Fick principle parameters to bring greater clarity to changes in blood flow distribution.
According to Sir Joseph Barcroft,37the condition of exercise is not a mere variant of the condition of rest, it is the essence of the machine. At peak exercise, V̇O2 was strongly correlated with both Qc and workload (Figure 1A and B). The V̇O2 vs. workload relationship had a R2 = 0.4707, which is suggestive of a role of both central and peripheral mechanisms in the determination of peakV̇O2. Also peakV̇O2, peakQc, and peakΔC(a-v)O2 changes with treatment offer minimal insight on blood flow distribution (Table 2). As a matter of fact, a peakV̇O2 increase should be associated with an increase in peakQc and/or in peakΔC(a-v)O2. However, in a few patients, albeit a relevant peakQc increase, peakΔC(a-v)O2 reduces (Figure 3A and B), and consequently, peak V̇O2 increase is blunted. Accordingly, something else may be occurring not well demonstrated by the Fick principle as suggested by the correlation between peakVO2 changes and workload changes after treatments (see Supplementary material online, Figure S1), which showed that only about 23% of peak workload increase was related to peakVO2. That means that the 77% of peak workload changes could not be attributed directly to peakVO2 changes. Notably, this was observed irrespective of the treatment strategies adopted that act primary on different haemodynamic and non-haemodynamic functions associated with exercise performance. Overall, these data cannot precisely identify blood flow distribution differences during exercise, but they provide surrogates to support our hypothesis that differences in blood flow distribution have an important impact on exercise tolerance.
Patients may improve peakV̇O2 with treatment by different combinations of changes in peakQc and peakΔC(a-v)O2. Of note, among patients who undergo interventions, those who simultaneously improved or reduced both peakQc and peakΔC(a-v)O2 were a minority, representing 18 and 6% of cases, respectively. Thus, in 76% of the cases, changes in peakQc and peakΔC(a-v)O2 diverged, so that exercise flood flow distribution likely changed between pre- and post-treatment conditions. The post-procedure–pre-procedure changes in peak exercise Qc vs. ΔC(a-v)O2 diagram (Figure 3A) showed a negative slope, which implied blood flow distribution changes with therapy, while a positive slope argued against a relevant redistribution. Figure 3A shows that patients belonging to the right upper quadrant were those with the greatest peakV̇O2 increase but not those with the greatest peakQc increase who were in the lower right panel. Moreover, grouping patients according to their peakV̇O2 increase (Figure 3B), the post-procedure–pre-procedure changes in peakQc vs. ΔC(a-v)O2 slope shifted upwards and to the right, but the inclination of the slope was maintained, suggesting the presence of the blood flow redistribution regardless of the efficacy of treatment in terms of peakV̇O2 increase. Of note, the correlations observed for each of the HF subgroups were stronger than the correlation obtained considering the entire population. It must be underlined that ΔC(a-v)O2 is influenced by several factors on top of blood flow distribution including perfusion and diffusion of O2, as well as O2 demand by the mitochondria.38 However, it is difficult to imagine that with Qc increase, perfusion and diffusion of O2 worsen or O2 demand by the mitochondria reduces. However, it may be argued that patients who increased Qc most increased Qc beyond the level of maximal O2 extraction capacity. This implies a trans-muscle blood transit time too short to complete O2 extraction. We cannot exclude such possibility, albeit it seems to us unlikely in HF. Moreover, the same behaviour was observed in all subjects, regardless of the therapeutic intervention, including physical training, which acts mainly on peripheral muscles.
We analysed data after three very different interventions: exercise training, which might be expected to have its predominant effect on Qc increase and oxygen extraction by the muscles, CRT on Qc, and pMVR on Qc and capillary pulmonary pressure. Nonetheless, the close negative correlation between post-treatment increase in peakQc and ΔC(a-v)O2 persisted also considering the three different interventions separately further confirming the crucial role of blood flow distribution changes for peak V̇O2 improvement after any HF treatment (see Supplementary material online, Figure S2A–C). It must be underlined that we had no measure of compartmental blood flow during exercise and its possible changes between pre- and post-intervention. Indeed, we simply interpret our data as due to blood flow redistribution, which seems to us the most likely explanation of our findings. When reliable techniques to assess organ blood flow during exercise will be available, the present interpretation of our findings will need to be confirmed.
The present study has some relevant clinical implications, which should be emphasized. Indeed, we showed that clinical interventions such as CRT, pMVR and cardio-respiratory exercise training, V̇O2, Qc, and ΔC(a-v)O2 changes during exercise are interrelated by a complex relationship in which blood flow redistribution is an underappreciated phenomenon. The present results suggest a reassessment of a basic concept in clinical exercise physiology and how the V̇O2, Qc, and ΔC(a-v)O2 relationships are influenced by HF treatment interventions. Even a classical concept in physiology, the Fick principle, can be deceptively important when applied to an intervention for a complex condition such as HF. Indeed, exercise blood flow redistribution may complicate the relationship between V̇O2, Qc, and ΔC(a-v)O2 so that even a relevant increase in Qc does not necessarily translate into a V̇O2 increase. Accordingly, the present results raise a relevant clinical question regarding how to evaluate the success of an HF intervention aimed at increasing primarily Qc, as for instance CRT or pMVR: should we target peakQc or peakV̇O2? It seems to us that the simultaneous measurement of peakQc and peakV̇O2 is needed to draw the complex mosaic that describes the effect on exercise performance of any HF treatment.
The present study has several limitations, which should be mentioned. First, peak exercise data were obtained during the last 30 s of exercise when patients informed us that they were very close to peak so they may not reflect peak effort but close to it as confirmed by the average respiratory equivalent ratio (RER) observed. However, the pre- and post-intervention study protocols were the same. Second, the temporal behaviour of changes in the Fick principle components post-intervention is unknown. Indeed, we did a single evaluation at 6 months but what may have occurred before and afterwards is unknown. It is interesting to speculate that patients who reduced ΔC(a-v)O2 were those who may benefit more or may further benefit from physical training. Third, it is possible from a theoretical point of view that changes in haemoglobin concentration may have per se affected the changes in ΔC(a-v)O2 we observed. However, present data exclude relevant haemoglobin concentration changes (Table 2). Moreover, it must be underlined that IGR technique is independent from haemoglobin concentration since SF6 does not cross the alveolar capillary membrane and N2O is soluble in blood but does not link with haemoglobin. Finally, it must be recognized that our study did not add information about patients who respond or not to a therapeutic intervention but simply report general analysis of exercise physiology in HF.
In conclusion, we observed that V̇O2, Qc, and ΔC(a-v)O2 changes during exercise are interrelated by a complex relationship in which blood flow redistribution is an underappreciated phenomenon. Therefore, the interpretation of HF treatment results should not be limited to peakV̇O2, but each element of the Fick principle, V̇O2, Qc, and ΔC(a-v)O2, should be considered in the context of a fourth underappreciated variable: blood flow redistribution during exercise.
Supplementary material
Supplementary material is available at European Journal of Preventive Cardiology.
Author contribution
P.A. and G.C. contributed to the conception and design of the work. C.V., A.A., S.F., E.S., S.D.M., A.S., S.N., and G.M. contributed to the acquisition, analysis, or interpretation of data for the work. P.A., G.C., and E.S. drafted the manuscript. A.S.-T, and J.M. critically revised the manuscript. All authors gave final approval and agreed to be accountable for all aspects of work ensuring integrity.
Funding
This research was supported by the Italian Ministry of Health (ricerca corrente CUP= B43C24000090001).
Data availability
Raw data will be made available upon request at www.zenodo.org.
References
Author notes
Conflict of interest: none declared.

Comments