


Abstract
As lifetime accumulation of cardiovascular risk factors is gaining importance, early identification and management of risk factors are being emphasized. The global prevalence of metabolic syndrome (MetS), a constellation of these risk factors, is increasing, particularly among young adults. In this study, we aim to investigate the association between cumulative exposure to metabolic risk and cardiovascular disease (CVD) in young adults.
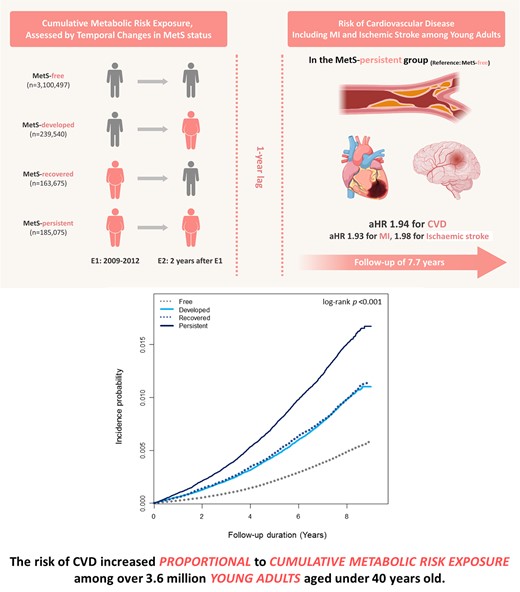
In this nationwide population-based cohort, we analysed 3 688 787 young adults (<40 years) with 2 biennial National Health Screening examinations from 2009 to 2012. Participants were categorized into MetS-free, MetS-developed, MetS-recovered, or MetS-persistent group, based on MetS presence at each examination. The endpoint was new CVD development, including myocardial infarction (MI) and ischaemic stroke. During follow-up (median, 7.7 years), CVD occurred in 19 219 individuals (0.5%). The incidence rates of CVD were 0.58, 1.17, 1.20, and 1.83 (1000 person-years) in the MetS-free, MetS-developed, MetS-recovered, and MetS-persistent groups, respectively. The CVD risk was proportionally associated with cumulative metabolic risk exposure, with a maximum two-fold increase in the MetS-persistent group [adjusted hazard ratio (aHR) 1.94, 95% confidence interval (CI) 1.84–2.04], followed by the MetS-recovered and the MetS-developed groups with similar risks. Among the MetS components, persistent exposure to elevated blood pressure (BP) had the greatest association with CVD risk (aHR 1.69, 95% CI 1.63–1.76). This tendency was consistent in the separate analyses of the risk of MI and ischaemic stroke.
The risk of CVD increased in an exposure-dependent manner among young adults. Efforts to optimize the cardiometabolic profile, particularly BP, even after the establishment of MetS, might help promote long-term cardiovascular prognosis.
Lay Summary
In this large-scale nationwide cohort comprising 3 688 787 asymptomatic young adults under 40 years, we showed that the long-term risk of cardiovascular disease (CVD) increased in proportion with cumulative exposure to metabolic risk, as assessed by temporal changes in metabolic syndrome (MetS) status, with blood pressure (BP) demonstrating the greatest impact.
The risk of CVD exhibited a gradual increase in accordance with cumulative metabolic risk exposure, with a two-fold increment in the MetS-persistent group.
Among the MetS components, persistent exposure to elevated BP had the most profound impact to increase the risk of CVD, and the optimization of BP levels might be helpful to promote long-term cardiovascular health in young adults.
See the editorial comment for this article ‘Metabolic syndrome and premature atherosclerotic cardiovascular disease: insights for the individual and the population’, by F.Y. Cesena, https://doi.org/10.1093/eurjpc/zwae139.
Introduction
In recent decades, cardiovascular mortality has declined in the overall population due to the discovery of risk factors and successful preventive strategies.1,2 However, a detailed age-specific analysis reveals a concerning trend among young adults, of which the incidence of cardiovascular disease (CVD) has been increasing and the related prognosis has been deteriorating.3,4 Growing evidence supports that the accumulation of unhealthy risk factors such as obesity, physical inactivity, and poor diet starts early in life and significantly contributes to individuals’ disability in the long term, emphasizing the importance of early identification and proactive intervention of risk factors to prevent CVD.5,6
Metabolic syndrome (MetS), a multiplex cardiovascular risk factor including central obesity and disturbed glucose, lipid, and blood pressure (BP) levels,7 is associated with unfavourable physical activity and dietary patterns and has recently alarmingly increased in young adults.8,9 Previous studies have consistently shown an independent association of the presence of MetS with the risk of CVD and death from CVD, suggesting MetS as a predictor for CVD.10–12 Based on the importance of cumulative exposure to risk factors, it has been reported that dynamic changes in MetS status altered the risk of CVD and death.13,14 However, most have been validated in the middle-aged or older population but not in young adults. While we recently demonstrated that changes in the presence and burden of MetS had a stepwise association with the risk of coronary artery calcification progression in statin-naïve young adults, this was an assessment of subclinical vascular changes.15 Indeed, the risk of clinical events according to changes in MetS status during long-term follow-up in this age group remains unclear.
Therefore, we aimed to investigate the association between cumulative metabolic risk exposure, assessed by temporal changes in MetS status, and the risk of CVD in young adults under 40 years of age, using a large population-based cohort dataset.
Methods
Data source
This retrospective cohort study utilized nationwide population-based data from the National Health Insurance Service (NHIS) of South Korea, as published previously.16 The NHIS operates a compulsory health insurance programme that covers ∼97% of the entire population. It contains anonymized health-related information, including healthcare utilization (histories of admission or outpatient clinic with diagnosis codes and claims for imaging studies, laboratory tests, and procedures) medication records, and results from standardized biennial National Health Screening examinations. The remaining 3% of the population is covered by the Medical Aid programme, as a form of public assistance that uses Korean government subsidies to provide low-income groups with healthcare services. Thus, all Korean-insured people are covered by the NHIS.
The National Health Screening examination comprises demographics, anthropometric measurements, self-reported questionnaires on health-related behaviours and medical histories, and laboratory tests. The laboratory tests regularly undergo quality control by the Korean Association of Laboratory Quality Control in accordance with an act on health examinations. The medical care performed in Korea and the claims from the NHIS are strictly assessed and monitored by the Health Insurance Review and Assessment Service under the supervision of the Ministry of Health and Welfare. This ensures the accuracy and veracity of the database used in this study. The study protocol conformed to the ethical guidelines of the Declaration of Helsinki and was approved by the Institutional Review Board of our institution (E-2305-093-1432). Owing to the retrospective collection and analysis of anonymous raw data from the NHIS claims database, the requirement for written informed consent was waived by the board.
Study population
From the NHIS database, a total of 6 891 400 individuals aged 20–39 years who underwent the assigned National Health Screening examination between 1 January 2009 and 31 December 2012 were initially screened for inclusion. This accounted for approximately half of all Korean young adults aged 20–39 years at the time of recruitment (n = 14 795 891). Among them, 4 007 427 individuals who had a follow-up examination after 2 years from the baseline examination were included to assess changes in MetS status. For the analysis, we excluded those with a history of myocardial infarction (MI) (n = 3488) or ischaemic stroke (n = 1561) and those with missing values for at least one variable (n = 311 452). To clarify a causal relationship between MetS and CVD, we additionally excluded 2139 individuals who developed new-onset MI or ischaemic stroke, died, or were lost to follow-up within the first year after the enrolment. As a result, 3 688 787 young adults were included in the final analyses (Figure 1).
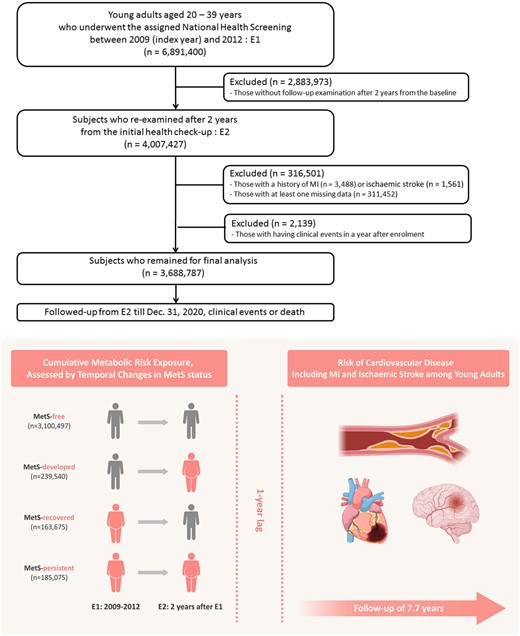
A schematic flow for study population enrolment, subgroup categorization, and follow-up. Approximately 3.7 million young adults aged under 40 years who underwent consecutive biennial National Health Screening Examinations were enrolled in this cohort. The study participants were categorized into four groups according to temporal changes in metabolic syndrome status at two different time points (E1 and E2) as follows: MetS–free, MetS–developed, MetS–recovered, or MetS–persistent group. The primary outcome was the new development of CVD, including myocardial infarction and ischaemic stroke. E, examination; MetS, metabolic syndrome.
Definition of variables
All information on sociodemographic profiles, comorbidities, medications, anthropometric measurements, and laboratory results was obtained at each National Health Screening.16 Age and sex were defined based on the resident registration number generated from birth notification. Income level was dichotomized based on the bottom 25%. Data on smoking, alcohol consumption, and physical activity were collected through standardized self-reported questionnaires. Current smoking was defined as smoking at least one cigarette per day in the recent 12 months, while ex-smoking was defined as previously smoking but no more smoking for at least 12 months. Alcohol consumption was divided into three groups according to the average daily amount consumed: none, mild-to-moderate (<30 g of alcohol/day), or heavy (≥30 g of alcohol/day). Physical activity was assessed by regular exercise as ≥3 days of 20 min intense workouts/week or ≥5 days of 30 min moderate workouts/week. Comorbidities were defined by laboratory results, the International Classification of Diseases, 10th revision, Clinical Modification (ICD-10-CM) codes, and prescription history. Hypertension was determined as systolic/diastolic BP ≥140/90 mmHg or ≥1 claim per year for the ICD-10-CM codes I10–I13 or I15 with a prescription of anti-hypertensive medications. Diabetes mellitus was defined as fasting glucose levels ≥126 mg/dL or ≥1 claim per year for the ICD-10-CM codes E11–14 with a prescription of oral antidiabetic drugs or insulin. Dyslipidaemia was defined as total cholesterol (TC) ≥240 mg/dL or ≥1 claim per year for the ICD-10-CM codes E78 in conjunction with lipid-lowering drugs.
Anthropometric measurements, including height, weight, waist circumferences, and BP, were obtained by a trained nurse. Body mass index (BMI) was calculated as weight divided by height in metres squared (kg/m2), and waist circumference (WC) was measured at the midpoint between the lower costal margin and the iliac crest. Blood pressure was obtained using an automated BP monitor with at least 5 min rest in a sitting position.
Laboratory evaluations were performed in an overnight fasting condition in certified hospitals passing the periodic quality screening by the NHIS. Fasting glucose, TC, HDL cholesterol (HDL-c), LDL cholesterol, triglycerides, and estimated glomerular filtration rate were assessed on the day of the National Health Screening.
Evaluation of metabolic syndrome and changes in metabolic syndrome
Metabolic syndrome was ascertained using the unified criteria based on the agreement of the International Diabetes Federation (IDF), the American Heart Association/National Heart, Lung, and Blood Institute,17 along with modified WC criteria from the Korean Society for the Study of Obesity,18 and the Asian-specific cut-off values for abdominal obesity.17 Metabolic syndrome was diagnosed when an individual had three or more of the following components: (i) increased WC (≥90 cm for men or ≥85 cm for women), (ii) elevated triglycerides [≥150 mg/dL (1.7 mmol/L) or the use of drugs for elevated triglycerides], (iii) decreased HDL-c [<40 mg/dL (1.0 mmol/L) for men or <50 mg/dL (1.3 mmol/L) for women], (iv) elevated BP (≥130/85 mmHg or on anti-hypertensive medications), and (v) impaired fasting glucose [≥100 mg/dL (5.6 mmol/L) or on antidiabetic medications].
We assessed MetS status at two different time points: the initial examination (E1) and the follow-up examination after 2 years (E2). Based on changes in MetS status, individuals were categorized into four groups according to changes in MetS status as follows: (i) MetS-free (no MetS at E1 and E2; n = 3 100 497), (ii) MetS-developed (no MetS at E1 but MetS at E2; n = 239 540), (iii) MetS-recovered (MetS at E1 but no MetS at E2; n = 163 675), and (iv) MetS-persistent (MetS at E1 and E2; n = 185 075; Figure 1).
Study endpoint and follow-up
The study endpoint was a composite of newly developed CVD, including MI and ischaemic stroke, during follow-up. The study participants were followed from 1 year after the Second National Health Screening (E2: index date) to the date of the clinical events, the date of death, or 31 December 2020, whichever came first. All clinical events were identified using the diagnosis codes and claims in the NHIS database. Myocardial infarction was defined as an in-hospital diagnosis using the ICD-10-CM codes I21–22. Ischaemic stroke was defined as a diagnosis during admission using the ICD-10-CM codes I63–64 with at least one claim for brain imaging studies including magnetic resonance imaging/angiography or computerized tomography. Individuals who lost to follow-up were censored.
Statistical analysis
In the characteristics of the study population at E2, a one-way analysis of variance was used for continuous variables [mean ± standard deviation or median (inter-quartile range)], and a χ2 test was applied for categorical variables (frequencies and percentages) to compare the differences between study groups. The incidence rates of study endpoints were calculated by the case numbers detected during follow-up per 1000 person-years and were stratified and compared according to the cumulative metabolic risk exposure. The chronological trend of the incidence probability of clinical events was presented according to changes in MetS status determined by Kaplan–Meier analysis using the log-rank test. The association between cumulative metabolic risk exposure and the risk of CVD in young adults was estimated using multivariable Cox proportional hazards regression models and was reported as hazard ratios (HRs) with 95% confidence intervals (CIs). In addition, we analysed the association between changes in each metabolic component and the risk of CVD to elucidate which component of MetS contributes to the risk of developing CVD in young adults. Model 1 was unadjusted; Model 2 was adjusted for age, male sex, lower income, smoking, alcohol consumption, and regular exercise; and Model 3 was further adjusted for BMI in addition to Model 2. The relative risk (RR) was calculated as the ratio of risk of CVD for the recovered group, relative to the persistent group. To verify the reliability of our results, we performed a subgroup analysis of the association between the cumulative metabolic risk exposure and the risk of CVD stratified by age and sex. All analyses were performed using SAS version 9.4 (SAS Institute Inc., Cary, NC, USA) and R Software version 3.6.4 (The R Foundation for Statistical Computing, Vienna, Austria, http://www.R-project.org). A value of two-sided P < 0.05 was considered statistically significant.
Results
Baseline characteristics
In the present cohort involving 3 688 787 young adults (mean age, 32.1 years; male 62.8%), the clinical and laboratory characteristics at E2 were stratified into four groups based on changes in MetS status at two different time points (E1 and E2; Table 1). The group with higher cumulative metabolic risk exposure tended to be older, predominantly male, more obese, to consume more alcohol and cigarette, and have more cardiovascular risk factors. The MetS-developed and the MetS-recovered groups had similar characteristics in terms of age, sex, obesity, smoking, and alcohol consumption patterns, indicating similar cumulative metabolic risk exposure. The mean/median values of fasting glucose, triglycerides, and HDL-c at E2 were 110.0, 221, and 44.5 mg/dL, respectively, in the MetS-persistent group, showing the worst MetS profile. Notably, triglycerides level in the MetS-persistent group was approximately three times higher than that in the MetS-free group (85 vs. 221 mg/dL). More than half of those in the MetS-free group were completely metabolically healthy, without any metabolic component present at both E1 and E2. The proportion of individuals having more metabolic components tended to increase at the time of E2 than at E1 in the MetS-persistent group. Clinical and laboratory characteristics other than MetS at E1 are presented in the Supplementary material online, Table S1.
The characteristics of study population according to changes in metabolic syndrome status at the index date
| Total | Changes in MetS | P | ||||
|---|---|---|---|---|---|---|
| (N = 3 688 787) | Free | Developed | Recovered | Persistent | ||
| (N = 3 100 497) | (N = 239 540) | (N = 163 675) | (N = 185 075) | |||
| Clinical parameters | ||||||
| Age, years | 32.1 ± 4.3 | 31.8 ± 4.3 | 33.3 ± 3.9 | 33.7 ± 3.8 | 34.2 ± 3.6 | <0.001 |
| Age subgroups, % | <0.001 | |||||
| <30 years | 1 096 809 (29.7) | 1 008 840 (32.5) | 42 770 (17.9) | 24 373 (14.9) | 20 826 (11.2) | |
| ≥30 years | 2 591 978 (70.3) | 2 091 657 (67.5) | 196 770 (82.1) | 139 302 (85.1) | 164 249 (88.8) | |
| Sex, % | <0.001 | |||||
| Male | 2 317 539 (62.8) | 1 793 699 (57.9) | 211 372 (88.2) | 143 440 (87.6) | 169 028 (91.3) | |
| Female | 1 371 248 (37.2) | 1 306 798 (42.1) | 28 168 (11.8) | 20 235 (12.4) | 16 047 (8.7) | |
| BMI, kg/m2 | 23.3 ± 3.7 | 22.5 ± 3.1 | 27.0 ± 3.4 | 26.2 ± 3.4 | 29.0 ± 3.7 | <0.001 |
| WC, cm | 78.5 ± 10.2 | 76.3 ± 9.0 | 89.3 ± 8.3 | 86.1 ± 8.3 | 93.6 ± 8.5 | <0.001 |
| Obesity, % | 899 114 (29.2) | 583 387 (20.4) | 134 450 (73.0) | 83 568 (63.1) | 97 709 (88.3) | <0.001 |
| Income, lowest 25%, % | 377 536 (10.2) | 327 303 (10.6) | 20 798 (8.7) | 14 522 (8.9) | 14 913 (8.1) | <0.001 |
| Smoking, % | <0.001 | |||||
| Non | 1 995 439 (54.1) | 1 809 506 (58.3) | 78 797 (32.9) | 54 961 (33.6) | 52 175 (28.2) | |
| Ex | 453 902 (12.3) | 355 419 (11.5) | 39 763 (16.6) | 27 439 (16.7) | 31 281 (16.9) | |
| Current | 1 239 446 (33.6) | 935 572 (30.2) | 120 980 (50.5) | 81 275 (49.7) | 101 619 (54.9) | |
| Alcohol consumption, % | <0.001 | |||||
| Non | 1 305 432 (35.4) | 1 150 781 (37.1) | 62 653 (26.2) | 45 032 (27.5) | 46 966 (25.4) | |
| Mild-to-moderate | 2 076 939 (56.3) | 1 728 585 (55.8) | 142 298 (59.4) | 97 316 (59.5) | 108 740 (58.7) | |
| Heavy | 306 416 (8.3) | 221 131 (7.1) | 34 589 (14.4) | 21 327 (13.0) | 29 369 (15.9) | |
| Regular exercise, % | 547 720 (14.9) | 456 058 (14.7) | 33 267 (13.9) | 30 600 (18.7) | 27 795 (15.0) | <0.001 |
| Comorbidities, % | ||||||
| Hypertension | 270 312 (7.3) | 121 727 (3.9) | 56 186 (23.5) | 21 571 (13.2) | 70 828 (38.3) | <0.001 |
| Diabetes mellitus | 71 288 (1.9) | 22 618 (0.7) | 14 309 (6.0) | 5176 (3.2) | 29 185 (15.8) | <0.001 |
| Dyslipidaemia | 289 321 (7.8) | 165 651 (5.3) | 48 369 (20.2) | 21 525 (13.2) | 53 776 (29.1) | <0.001 |
| Chronic kidney disease | 58 841 (1.6) | 48 026 (1.6) | 4270 (1.8) | 2765 (1.7) | 3780 (2.0) | <0.001 |
| Vital signs | ||||||
| Systolic BP, mmHg | 117.9 ± 13.2 | 115.8 ± 12.1 | 130.1 ± 11.7 | 123.5 ± 12.2 | 132.5 ± 13.3 | <0.001 |
| Diastolic BP, mmHg | 74.1 ± 9.4 | 72.7 ± 8.7 | 81.7 ± 9.1 | 78.0 ± 9.0 | 83.9 ± 10.2 | <0.001 |
| Laboratory parameters | ||||||
| Fasting glucose | 91.4 ± 16.0 | 89.3 ± 11.6 | 102.0 ± 21.2 | 94.6 ± 19.8 | 110.0 ± 36.7 | <0.001 |
| Total cholesterol | 187.3 ± 33.7 | 184.1 ± 32.0 | 204.0 ± 37.0 | 199.6 ± 35.3 | 208.1 ± 38.5 | <0.001 |
| HDL-c | 56.9 ± 18.1 | 58.8 ± 17.8 | 46.6 ± 15.9 | 49.9 ± 16.8 | 44.5 ± 14.8 | <0.001 |
| LDL-c | 107.0 ± 31.3 | 105.2 ± 29.8 | 115.4 ± 36.6 | 118.0 ± 33.6 | 116.5 ± 38.9 | <0.001 |
| Triglycerides | 95 (64–148) | 85 (60–124) | 195 (158–259) | 138 (103–201) | 221 (168–300) | <0.001 |
| eGFR | 98.7 ± 52.8 | 99.1 ± 52.7 | 96.5 ± 54.6 | 96.7 ± 53.7 | 95.8 ± 51.0 | <0.001 |
| Number of metabolic components at the First National Health Screening Examination (E1) | ||||||
| 0 | 1 718 045 (46.6) | 1 684 592 (54.3) | 33 453 (14.0) | — | — | <0.001 |
| 1 | 1 076 909 (29.2) | 992 977 (32.0) | 83 932 (35.0) | — | — | |
| 2 | 545 083 (14.8) | 422 928 (13.6) | 122 155 (51.0) | — | — | |
| 3 | 247 011 (6.7) | — | — | 133 585 (81.6) | 113 426 (61.3) | |
| 4 | 85 688 (2.3) | — | — | 27 462 (16.8) | 58 226 (31.5) | |
| 5 | 16 051 (0.4) | — | — | 2628 (1.6) | 13 423 (7.3) | |
| Number of metabolic components at the Second National Health Screening Examination (E2) | ||||||
| 0 | 1 646 645 (44.6) | 1 627 584 (52.5) | — | 19 061 (11.7) | — | <0.001 |
| 1 | 1 038 229 (28.2) | 984 905 (31.8) | — | 53 324 (32.6) | — | |
| 2 | 579 298 (15.7) | 488 008 (15.7) | — | 91 290 (55.8) | — | |
| 3 | 288 738 (7.8) | — | 186 321 (77.8) | — | 102 417 (55.3) | |
| 4 | 111 702 (3.0) | — | 47 526 (19.8) | — | 64 176 (34.7) | |
| 5 | 24 175 (0.7) | — | 5693 (2.4) | — | 18 482 (10.0) | |
Values are mean ± standard deviation, median (inter-quartile ranges), or n (%). Measurement units of laboratory findings are mg/dL and mL/min/1.73 m2 (for eGFR).
BMI, body mass index; BP, blood pressure; eGFR, estimated glomerular filtration rate; HDL-c, HDL cholesterol; LDL-c, lowLDL cholesterol; MetS, metabolic syndrome; N, numbers; WC, waist circumference.
Incidence and risk of cardiovascular disease according to baseline metabolic syndrome and its components
During a median follow-up of 7.7 years (inter-quartile range 6.6–8.3 years), newly developed CVDs were observed in 19 219 (0.5%). Cardiovascular diseases were more prevalent in individuals with MetS at E1, compared with those without MetS (1.1 vs. 0.4%, P < 0.001). Incidence rates per 1000 person-years were 1.46 and 0.61 in the MetS group and non-MetS group, retrospectively. When a young adult was diagnosed with MetS at E1, the risk of subsequent CVD increased by ∼50%. Similar patterns were seen in terms of MI and ischaemic stroke. Both incidence rates per 1000 person-years of MI and ischaemic stroke were ∼2.5 times higher in the MetS group than in the non-MetS group (0.92 vs. 0.39 for MI; 0.57 vs. 0.23 for ischaemic stroke). Separate analysis results for the risk of MI and ischaemic stroke were consistent with the main results (see Supplementary material online, Table S2).
All metabolic components demonstrated a significant risk increase for CVD. After adjusting for potential confounders and other metabolic components (Model 4), each metabolic component still had an independent association with CVD development, of which elevated BP showed the strongest association with the risk of CVD, with an HR of 1.41. The analysis results regarding the risk of MI and ischaemic stroke were in line with the main result. Likewise, the sub-results regarding MI and ischaemic stroke demonstrated that all individual metabolic components were significant in increasing the risk of MI and ischaemic stroke, respectively. Elevated BP was the most potent risk factor for MI and ischaemic stroke (see Supplementary material online, Table S3).
Incidence and risk of cardiovascular disease according to cumulative metabolic risk exposure
When comparing groups based on changes in MetS status (Table 2), the incidence rates per 1000 person-years were 0.58, 1.17, 1.20, and 1.83 in the MetS-free, MetS-developed, MetS-recovered, and MetS-persistent groups, respectively, with a positive exposure-dependent response to cumulative metabolic risk. Kaplan–Meier curves demonstrated that the incidence probability of CVD was highest in the MetS-persistent group, similar in the MetS-developed and the MetS-recovered groups, and lowest in the MetS-free group (log-rank P < 0.001; Figure 2A). The risk of CVD gradually increased with the degree of exposure to cumulative metabolic risk (Table 2). Among the four groups, the MetS-persistent group had the highest risk of CVD, which was approximately twice as high as the MetS-free group even after adjusting for confounding factors (Model 3). The MetS-developed and the MetS-recovered groups possessed similar risks of CVD [adjusted HR (HR) 1.45 for the MetS-developed group; aHR 1.48 for the MetS-recovered group], significantly higher than the MetS-free group. Indeed, recovery from MetS significantly reduced the risk of CVD compared with the persistence of MetS, with an RR of 0.66.
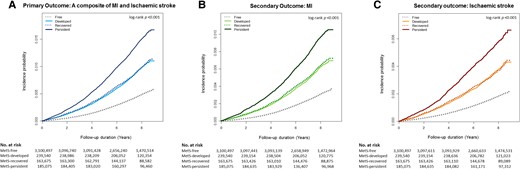
Kaplan–Meier curves for the incidence probability of clinical events according to cumulative metabolic risk exposure. The incidence probability of (A) a composite of clinical events tended to increase with cumulative metabolic risk exposure: highest in the MetS–persistent group, similar in the MetS–developed and the MetS–recovery groups, and lowest in the MetS–free group. This tendency was consistent in the analysis of the incidence probability of (B) myocardial infarction and (C) ischaemic stroke, separately. MetS, metabolic syndrome; No. numbers.
The incidence rate and risk of cardiovascular events according to changes in metabolic syndrome status
| Changes in MetS | n | Events | IRa per 1000 PY | HR (95% CI) | ||
|---|---|---|---|---|---|---|
| Model 1 | Model 2 | Model 3 | ||||
| Primary outcome: a composite of MI and ischaemic stroke | ||||||
| Free | 3 100 497 | 13 167 | 0.58 | 1 (reference) | 1 (reference) | 1 (reference) |
| Developed | 239 540 | 2069 | 1.17 | 1.71 (1.63–1.80) | 1.66 (1.59–1.74) | 1.45 (1.38–1.52) |
| Recovered | 163 675 | 1476 | 1.20 | 1.71 (1.62–1.80) | 1.65 (1.57–1.75) | 1.48 (1.40–1.57) |
| Persistent | 185 075 | 2507 | 1.83 | 2.51 (2.40–2.62) | 2.40 (2.30–2.51) | 1.94 (1.84–2.04) |
| Ptrend | <0.001 | <0.001 | <0.001 | |||
| RR (95% CI) | P | |||||
| Persistent vs. recovered | 0.66 (0.62–0.71) | <0.001 | ||||
| Secondary outcome: MI | ||||||
| Free | 3 100 497 | 8356 | 0.37 | 1 (reference) | 1 (reference) | 1 (reference) |
| Developed | 239 540 | 1295 | 0.73 | 1.68 (1.58–1.78) | 1.62 (1.53–1.72) | 1.42 (1.33–1.51) |
| Recovered | 163 675 | 947 | 0.77 | 1.72 (1.60–1.84) | 1.66 (1.55–1.78) | 1.49 (1.39–1.60) |
| Persistent | 185 075 | 1587 | 1.16 | 2.49 (2.36–2.63) | 2.38 (2.25–2.51) | 1.93 (1.81–2.06) |
| Ptrend | <0.001 | <0.001 | <0.001 | |||
| RR (95% CI) | P | |||||
| Persistent vs. recovered | 0.67 (0.62–0.73) | <0.001 | ||||
| Secondary outcome: ischaemic stroke | ||||||
| Free | 3 100 497 | 5036 | 0.22 | 1 (reference) | 1 (reference) | 1 (reference) |
| Developed | 239 540 | 809 | 0.46 | 1.77 (1.64–1.91) | 1.73 (1.60–1.86) | 1.49 (1.38–1.61) |
| Recovered | 163 675 | 564 | 0.46 | 1.71 (1.57–1.87) | 1.67 (1.53–1.83) | 1.49 (1.36–1.63) |
| Persistent | 185 075 | 981 | 0.71 | 2.56 (2.39–2.75) | 2.48 (2.31–2.66) | 1.98 (1.82–2.14) |
| Ptrend | <0.001 | <0.001 | <0.001 | |||
| RR (95% CI) | P | |||||
| Persistent vs. recovered | 0.65 (0.59–0.72) | <0.001 | ||||
aIncidence rates are calculated as 1000 person-years. Model 1 was adjusted for age and male sex. Model 2 was adjusted for age, male sex, lower income, smoking, alcohol consumption, and regular exercise. Model 3 was adjusted for age, male sex, lower income, smoking, alcohol consumption, regular exercise, and BMI. The RR was calculated as the ratio of risk of CVD for the recovered group, relative to the persistent group.
CI, confidence interval; HR hazard ratio; IR, incidence rate; MI, myocardial infarction; PY, person-years; RR, relative risk; other abbreviations as in Table 1.
This trend was consistent when analysing the incidence and risk of MI and ischaemic stroke separately (Table 2). Kaplan–Meier curves showed that the MetS-persistent group had the highest incidence probability of MI (Figure 2B) and ischaemic stroke (Figure 2C). Like the main results, persistent exposure to MetS was the most hazardous in developing MI and ischaemic stroke, presenting about two-fold higher risk than no exposure to MetS. The young adults with developed MetS and those with recovered MetS exhibited an ∼50% increase in the risk of both MI and ischaemic stroke, compared with those free from MetS.
Association of temporal changes in each metabolic syndrome component with the risk of cardiovascular disease
In general, the incidence rate of CVD showed a gradual increase according to the cumulative exposure amount of each metabolic component (Table 3). Among the MetS components, elevated BP and hypertriglyceridaemia tended to be more sustained, and the BP-persistent group had the highest incidence rate of CVD at 1.34 per 1000 person-years. When adjusting for potential confounders including other metabolic components (Model 4), increasing exposure to elevated BP, impaired glucose, low HDL-c, and high triglycerides were independently associated with the increased risk of CVD. Particularly, the most remarkable increase in the risk of CVD was found in young adults with persistent exposure to elevated BP. When BP recovered at E2, the risk of CVD appeared to be significantly lower than when BP was consistently high at E2, presenting an RR of 0.58. Following BP, the recovery of impaired glucose levels appeared to significantly decrease the risk of CVD by 40%. Exceptionally, cumulative exposure to abdominal obesity did not provide a quantitative explanation for the risk of CVD in young adults.
The incidence rate and risk of cardiovascular events according to changes in each metabolic component
| Changes in metabolic component | n | Events | IRa | HR (95% CI) | |||
|---|---|---|---|---|---|---|---|
| Model 1 | Model 2 | Model 3 | Model 4 | ||||
| Primary outcome: a composite of MI and ischaemic stroke | |||||||
| WC | |||||||
| Free | 2 995 362 | 13 403 | 0.61 | 1 (reference) | 1 (reference) | 1 (reference) | 1 (reference) |
| Developed | 234 407 | 1599 | 0.93 | 1.40 (1.33–1.48) | 1.39 (1.32–1.46) | 1.10 (1.04–1.17) | 1.06 (1.00–1.13) |
| Recovered | 139 129 | 1092 | 1.06 | 1.51 (1.42–1.61) | 1.48 (1.39–1.58) | 1.25 (1.17–1.33) | 1.32 (1.14–1.29) |
| Persistent | 319 889 | 3125 | 1.33 | 1.86 (1.79–1.93) | 1.81 (1.74–1.88) | 1.25 (1.18–1.32) | 1.18 (1.12–1.25) |
| Ptrend | <0.001 | <0.001 | <0.001 | <0.001 | |||
| RR (95% CI) | P | ||||||
| Persistent vs. recovered | 0.80 (0.75–0.86) | <0.001 | |||||
| BP | |||||||
| Free | 2 291 882 | 8802 | 0.52 | 1 (reference) | 1 (reference) | 1 (reference) | 1 (reference) |
| Developed | 455 708 | 2850 | 0.84 | 1.41 (1.35–1.45) | 1.39 (1.33–1.45) | 1.27 (1.22–1.33) | 1.25 (1.19–1.30) |
| Recovered | 429 628 | 2468 | 0.77 | 1.30 (1.25–1.36) | 1.29 (1.23–1.35) | 1.20 (1.15–1.26) | 1.19 (1.14–1.25) |
| Persistent | 511 569 | 5099 | 1.34 | 2.08 (2.00–2.16) | 2.04 (1.97–2.12) | 1.76 (1.69–1.83) | 1.69 (1.63–1.76) |
| Ptrend | <0.001 | <0.001 | <0.001 | <0.001 | |||
| RR (95% CI) | P | ||||||
| Persistent vs. recovered | 0.58 (0.55–0.60) | <0.001 | |||||
| Glucose | |||||||
| Free | 2 668 130 | 12 077 | 0.61 | 1 (reference) | 1 (reference) | 1 (reference) | 1 (reference) |
| Developed | 416 281 | 2674 | 0.87 | 1.24 (1.19–1.30) | 1.22 (1.17–1.27) | 1.14 (1.09–1.19) | 1.09 (1.04–1.14) |
| Recovered | 361 617 | 2115 | 0.78 | 1.12 (1.07–1.17) | 1.10 (1.05–1.15) | 1.06 (1.01–1.11) | 1.04 (0.99–1.09) |
| Persistent | 242 759 | 2353 | 1.31 | 1.67 (1.60–1.75) | 1.63 (1.55–1.70) | 1.44 (1.38–1.51) | 1.33 (1.27–1.39) |
| Ptrend | <0.001 | <0.001 | <0.001 | <0.001 | |||
| RR (95% CI) | P | ||||||
| Persistent vs. recovered | 0.60 (0.57–0.64) | <0.001 | |||||
| HDL-c | |||||||
| Free | 2 890 888 | 13 607 | 0.64 | 1 (reference) | 1 (reference) | 1 (reference) | 1 (reference) |
| Developed | 290 425 | 1970 | 0.92 | 1.39 (1.32–1.45) | 1.38 (1.31–1.44) | 1.23 (1.18–1.29) | 1.17 (1.11–1.23) |
| Recovered | 271 434 | 1701 | 0.84 | 1.30 (1.23–1.37) | 1.29 (1.22–1.35) | 1.19 (1.13–1.26) | 1.16 (1.10–1.22) |
| Persistent | 236 040 | 1941 | 1.11 | 1.63 (1.56–1.71) | 1.62 (1.54–1.70) | 1.39 (1.32–1.46) | 1.36 (1.31–1.42) |
| Ptrend | <0.001 | <0.001 | <0.001 | <0.001 | |||
| RR (95% CI) | P | ||||||
| Persistent vs. recovered | 0.76 (0.71–0.81) | <0.001 | |||||
| Triglycerides | |||||||
| Free | 2 463 336 | 9670 | 0.53 | 1 (reference) | 1 (reference) | 1 (reference) | 1 (reference) |
| Developed | 406 401 | 2588 | 0.86 | 1.38 (1.32–1.44) | 1.33 (1.28–1.40) | 1.20 (1.14–1.25) | 1.13 (1.08–1.19) |
| Recovered | 301 807 | 1913 | 0.85 | 1.32 (1.25–1.39) | 1.28 (1.22–1.35) | 1.19 (1.13 –1.25) | 1.16 (1.10–1.22) |
| Persistent | 517 243 | 5048 | 1.30 | 1.87 (1.80–1.94) | 1.78 (1.71–1.85) | 1.50 (1.44–1.56) | 1.36 (1.31–1.42) |
| Ptrend | <0.001 | <0.001 | <0.001 | <0.001 | |||
| RR (95% CI) | P | ||||||
| Persistent vs. recovered | 0.65 (0.62–0.68) | <0.001 | |||||
| Secondary outcome: MI | |||||||
| WC | |||||||
| Free | 2 995 362 | 8514 | 0.38 | 1 (reference) | 1 (reference) | 1 (reference) | 1 (reference) |
| Developed | 234 407 | 996 | 0.58 | 1.37 (1.28–1.46) | 1.35 (1.26–1.44) | 1.08 (1.00–1.16) | 1.04 (0.96–1.11) |
| Recovered | 139 129 | 706 | 0.69 | 1.54 (1.42–1.66) | 1.51 (1.40–1.63) | 1.27 (1.17–1.37) | 1.24 (1.11–1.34) |
| Persistent | 319 889 | 1969 | 0.84 | 1.83 (1.74–1.92) | 1.77 (1.67–1.87) | 1.23 (1.15–1.32) | 1.17 (1.09–1.25) |
| Ptrend | <0.001 | <0.001 | <0.001 | <0.001 | |||
| RR (95% CI) | P | ||||||
| Persistent vs. recovered | 0.82 (0.76–0.90) | <0.001 | |||||
| BP | |||||||
| Free | 2 291 882 | 5706 | 0.34 | 1 (reference) | 1 (reference) | 1 (reference) | 1 (reference) |
| Developed | 455 708 | 1816 | 0.54 | 1.35 (1.28–1.42) | 1.33 (1.26–1.40) | 1.22 (1.15–1.29) | 1.19 (1.13–1.26) |
| Recovered | 429 628 | 1588 | 0.50 | 1.26 (1.19–1.33) | 1.24 (1.17–1.32) | 1.16 (1.10–1.23) | 1.15 (1.09–1.22) |
| Persistent | 511 569 | 3075 | 0.81 | 1.88 (1.80–1.97) | 1.85 (1.77–1.94) | 1.59 (1.51–1.67) | 1.52 (1.45–1.60) |
| Ptrend | <0.001 | <0.001 | <0.001 | <0.001 | |||
| RR (95% CI) | P | ||||||
| Persistent vs. recovered | 0.63 (0.59–0.67) | <0.001 | |||||
| Glucose | |||||||
| Free | 2 668 130 | 7708 | 0.39 | 1 (reference) | 1 (reference) | 1 (reference) | 1 (reference) |
| Developed | 416 281 | 1703 | 0.56 | 1.24 (1.17–1.30) | 1.21 (1.15–1.28) | 1.13 (1.07–1.19) | 1.09 (1.03–1.15) |
| Recovered | 361 617 | 1352 | 0.50 | 1.12 (1.05–1.18) | 1.10 (1.03–1.16) | 1.06 (1.00–1.12) | 1.04 (0.98–1.10) |
| Persistent | 242 759 | 1422 | 0.79 | 1.59 (1.50–1.68) | 1.54 (1.46–1.64) | 1.37 (1.29–1.45) | 1.27 (1.20–1.35) |
| Ptrend | <0.001 | <0.001 | <0.001 | <0.001 | |||
| RR (95% CI) | P | ||||||
| Persistent vs. recovered | 0.64 (0.59–0.69) | <0.001 | |||||
| HDL-c | |||||||
| Free | 2 890 888 | 8575 | 0.40 | 1 (reference) | 1 (reference) | 1 (reference) | 1 (reference) |
| Developed | 290 425 | 1232 | 0.57 | 1.39 (1.31–1.47) | 1.37 (1.29–1.45) | 1.23 (1.16–1.31) | 1.16 (1.09–1.23) |
| Recovered | 271 434 | 1112 | 0.55 | 1.36 (1.28–1.45) | 1.34 (1.26–1.43) | 1.25 (1.17–1.33) | 1.22 (1.14–1.30) |
| Persistent | 236 040 | 1266 | 0.72 | 1.72 (1.62–1.82) | 1.69 (1.59–1.79) | 1.46 (1.37–1.55) | 1.35 (1.27–1.44) |
| Ptrend | <0.001 | <0.001 | <0.001 | <0.001 | |||
| RR (95% CI) | P | ||||||
| Persistent vs. recovered | 0.76 (0.70–0.83) | <0.001 | |||||
| Triglycerides | |||||||
| Free | 2 463 336 | 6019 | 0.33 | 1 (reference) | 1 (reference) | 1 (reference) | 1 (reference) |
| Developed | 406 401 | 1649 | 0.55 | 1.40 (1.32–1.48) | 1.35 (1.27–1.43) | 1.22 (1.15–1.29) | 1.16 (1.09–1.23) |
| Recovered | 301 807 | 1232 | 0.55 | 1.36 (1.28–1.45) | 1.32 (1.24–1.40) | 1.23 (1.15–1.30) | 1.20 (1.13–1.28) |
| Persistent | 517 243 | 3285 | 0.85 | 1.95 (1.86–2.04) | 1.84 (1.76–1.93) | 1.57 (1.49–1.65) | 1.44 (1.37–1.51) |
| Ptrend | <0.001 | <0.001 | <0.001 | <0.001 | |||
| RR (95% CI) | P | ||||||
| Persistent vs. recovered | 0.64 (0.60–0.69) | <0.001 | |||||
| Secondary outcome: ischaemic stroke | |||||||
| WC | |||||||
| Free | 2 995 362 | 5115 | 0.23 | 1 (reference) | 1 (reference) | 1 (reference) | 1 (reference) |
| Developed | 234 407 | 636 | 0.37 | 1.48 (1.36–1.61) | 1.46 (1.35–1.59) | 1.17 (1.06–1.28) | 1.12 (1.02–1.23) |
| Recovered | 139 129 | 406 | 0.39 | 1.47 (1.33–1.63) | 1.45 (1.31–1.60) | 1.22 (1.09–1.35) | 1.18 (1.06–1.31) |
| Persistent | 319 889 | 1233 | 0.52 | 1.94 (1.82–2.07) | 1.90 (1.78–2.02) | 1.31 (1.20–1.43) | 1.23 (1.13–1.34) |
| Ptrend | <0.001 | <0.001 | <0.001 | <0.001 | |||
| RR (95% CI) | P | ||||||
| Persistent vs. recovered | 0.76 (0.68–0.85) | <0.001 | |||||
| BP | |||||||
| Free | 2 291 882 | 3234 | 0.19 | 1 (reference) | 1 (reference) | 1 (reference) | 1 (reference) |
| Developed | 455 708 | 1090 | 0.32 | 1.53 (1.43–1.64) | 1.51 (1.40–1.62) | 1.39 (1.29–1.49) | 1.36(1.27–1.46) |
| Recovered | 429 628 | 928 | 0.29 | 1.40 (1.30–1.51) | 1.38 (1.28–1.48) | 1.29 (1.20–1.39) | 1.28 (1.19–1.38) |
| Persistent | 511 569 | 2138 | 0.56 | 2.48 (2.34–2.63) | 2.43 (2.29–2.58) | 2.11 (1.98–2.24) | 1.43 (1.33–1.54) |
| Ptrend | <0.001 | <0.001 | <0.001 | <0.001 | |||
| RR (95% CI) | P | ||||||
| Persistent vs. recovered | 0.52 (0.49–0.56) | <0.001 | |||||
| Glucose | |||||||
| Free | 2 668 130 | 4591 | 0.23 | 1 (reference) | 1 (reference) | 1 (reference) | 1 (reference) |
| Developed | 416 281 | 1017 | 0.33 | 1.25 (1.17–1.34) | 1.22 (1.14–1.31) | 1.14 (1.06–1.22) | 1.09 (1.01–1.16) |
| Recovered | 361 617 | 798 | 0.29 | 1.11 (1.03–1.20) | 1.10 (1.02–1.18) | 1.06 (0.98–1.14) | 1.03 (0.96–1.11) |
| Persistent | 242 759 | 984 | 0.55 | 1.82 (1.70–1.96) | 1.78 (1.65–1.91) | 1.57 (1.46–1.68) | 1.43 (1.33–1.54) |
| Ptrend | <0.001 | <0.001 | <0.001 | <0.001 | |||
| RR (95% CI) | P | ||||||
| Persistent vs. recovered | 0.54 (0.50–0.60) | <0.001 | |||||
| HDL-c | |||||||
| Free | 2 890 888 | 5279 | 0.25 | 1 (reference) | 1 (reference) | 1 (reference) | 1 (reference) |
| Developed | 290 425 | 774 | 0.36 | 1.38 (1.28–1.49) | 1.39 (1.28–1.49) | 1.23 (1.14–1.33) | 1.18 (1.09–1.28) |
| Recovered | 271 434 | 620 | 0.31 | 1.19 (1.10–1.30) | 1.19 (1.10–1.29) | 1.10 (1.01–1.20) | 1.08 (0.99–1.17) |
| Persistent | 236 040 | 717 | 0.41 | 1.51 (1.39–1.63) | 1.51 (1.40–1.64) | 1.29 (1.19–1.40) | 1.21 (1.12–1.32) |
| Ptrend | <0.001 | <0.001 | <0.001 | 0.001 | |||
| RR (95% CI) | P | ||||||
| Persistent vs. recovered | 0.75 (0.68–0.84) | <0.001 | |||||
| Triglycerides | |||||||
| Free | 2 463 336 | 3809 | 0.21 | 1 (reference) | 1 (reference) | 1 (reference) | 1 (reference) |
| Developed | 406 401 | 987 | 0.33 | 1.35 (1.26–1.45) | 1.32 (1.23–1.42) | 1.17 (1.09–1.26) | 1.10 (1.02–1.18) |
| Recovered | 301 807 | 727 | 0.32 | 1.28 (1.18–1.39) | 1.25 (1.15–1.36) | 1.15 (1.06–1.25) | 1.12 (1.03–1.21) |
| Persistent | 517 243 | 1867 | 0.48 | 1.76 (1.66–1.87) | 1.69 (1.59–1.80) | 1.40 (1.32–1.49) | 1.25 (1.17–1.34) |
| Ptrend | <0.001 | <0.001 | <0.001 | <0.001 | |||
| RR (95% CI) | P | ||||||
| Persistent vs. recovered | 0.67 (0.61–0.73) | <0.001 | |||||
aIncidence rates are calculated as 1000 person-years. Model 1 was adjusted for age and male sex. Model 2 was adjusted for lower income, smoking, alcohol consumption, and regular exercise in addition to Model 1. Model 3 was adjusted for BMI in addition to Model 2. Model 4 was adjusted for other metabolic components in addition to Model 3. The RR was calculated as the ratio of risk of CVD for the recovered group, relative to the persistent group. Abbreviations as in Tables 1 and 2.
This finding was also consistent with the analysis of the risk of MI, showing the stepwise increase with the cumulative exposure to each metabolic component and the strongest impact of persistent exposure to elevated BP. Regarding the risk of ischaemic stroke, persistent exposure to impaired glucose and elevated BP were the strongest independent risk factors.
Subgroup analysis
Stratified analyses by age and sex are presented in Figure 3. The MetS-persistent group remained predictive of the highest risk of CVD in all subgroups, without any significant interaction (P for interaction = 0.337 and 0.065 for age and sex, respectively). Especially, in men as well as in individuals aged ≥30 years, the risk of CVD increased step by step, reaching a maximum of two-fold increase under persistent exposure to metabolic risk. In women, the reduced risk of CVD after recovery from MetS was remarkable. Likewise, the gradual stroke risk increase in accordance with cumulative exposure to metabolic risk was solid across age and sex. The impact of persistent MetS on the risk of ischaemic stroke was more pronounced in the younger age (<30 years) and in women. Whereas in the analysis of the risk of MI, significant interactions were found for age and sex (P for interaction = 0.009 and 0.001 for age and sex, respectively). Gradual increase in the MI risk was observed only in men and in individuals aged ≥30 (see Supplementary material online, Table S4).
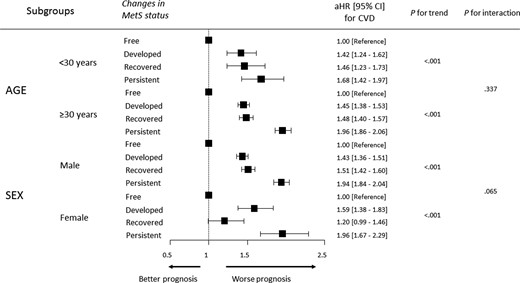
A forest plot for the subgroup analyses regarding age and sex. In all subgroups regarding age and sex, the MetS–persistent group consistently showed the highest risk of cardiovascular disease, without any significant interaction (P for interaction = 0.337 and 0.065 for age and sex, respectively). aHR, adjusted hazard ratio; CI, confidence interval; MetS, metabolic syndrome.
Discussion
In this nationwide population-based cohort study including ∼3.7 million young adults under 40 years, our principal findings were as follows: (i) the risk of CVD increased proportional to cumulative metabolic risk exposure, with a maximum two-fold increment in the MetS-persistent group; (ii) when MetS improved (the MetS-recovered group), the risk of CVD significantly decreased but remained higher than that in the MetS-free group; and (iii) among individual components of MetS, persistent exposure to elevated BP had the most profound impact to increase the risk of CVD, but the optimization of BP during follow-up demonstrated a significant reduction in the CVD risk. Taken together, these findings underscore the importance of cumulative metabolic risk exposure as a cardiovascular risk factor and the necessity of addressing metabolic components, particularly persistently elevated BP, in order to mitigate the risk of CVD in young adults.
Although young adults are generally considered to be healthy, the impact of cardiovascular risk factors on subsequent CVD becomes evident over a lifetime of cumulative exposure.19 Therefore, better management of risk factors in young adults is important to prevent CVD in the long term and promote cardiovascular health beyond midlife.19,20 Metabolic syndrome, the clustering of cardiovascular risk factors, varies in prevalence, components, and its link to CVD across different age groups, as experts have noted.21–23 Over the past decade, the global prevalence of MetS has markedly risen, particularly among young adults.22,24 In a cross-sectional sample data of the US population using the National Health and Nutrition Examination Survey from 2011 to 2016, MetS prevalence significantly increased among adults aged 20–39 years, rising from 16.2 to 21.3%, with the lowest in Asians.22 The present study also reported 9.5% at baseline (E1) and 11.5% after 2 years from the baseline (E2), indicating the rapid-growing prevalence of MetS and the recent-increasing potential of CVD in young adults. Due to genetic and cultural background, MetS prevalence reported in this study was relatively low but still important, compared with that in most Western Caucasian populations.8,22,24 Nevertheless, MetS and subsequent CVD have been of little clinical interest in young adults, because these are traditionally regarded as diseases of middle age.25 Since the onset age of MetS is reducing, as introduced in the previous and the present studies, recent reports indicating that early detection and management of metabolic derangements could improve the long-term prognosis have been released.15,16,26 It is time to reappraise the importance of cardiovascular risk assessment, including MetS, and proactive management in young adults.
In the present study, MetS was found to be independently associated with an increased risk of CVD, MI, and ischaemic stroke in young adults (see Supplementary material online, Table S3), consistent with previous findings in middle-aged and older adults.25,27,28 Furthermore, we demonstrated that the cumulative metabolic risk, assessed by the persistence of MetS at two distinct time points, had a gradual cardiovascular risk increase corresponding to the degree of exposure. There have been few prior research to evaluate the impact of changes in MetS status on the risk of CVD, particularly on a population scale. Only one nationwide population-based study investigated changes in MetS status and its association with major cardiovascular events.14 However, the previous study had a relatively short follow-up duration (3.5 years) and did not provide detailed information regarding the role of cumulative metabolic risk exposure on developing CVD among young adults since the mean age of the study was nearly 50 years and the age-specific analysis was not performed. In our study with a follow-up of 7.7 years, the risk of CVD (aHR 1.94), MI (aHR 1.93), and ischaemic stroke (aHR 1.98) approximately doubled in young adults with persistent exposure to MetS, compared with those without exposure to MetS. Individuals who had MetS at E1 but recovered from it at E2, as well as those who newly developed MetS at E2, followed behind. These results were well validated across age and sex.
Of note, the persistence of MetS deteriorated CVD risk in young adults than the presence of MetS at baseline once, and the recovery from MetS at follow-up reduced CVD risk by ∼50% compared with the persistence of MetS. The relatively amplified CVD risk in the MetS-persistent group might implicate more detrimental effects of ‘cumulative exposure’ to metabolic risk on the cardiovascular health of young adults, beyond ‘early onset’ alone. This was because the MetS-persistent group had the harmful potential to have steadily accumulated metabolic risk starting from childhood or adolescence, rather than starting from the so-called ‘middle fat’. It implies that young adults should consider active intervention and incessant efforts to diminish or retard metabolic risk amount even after the development of MetS, supporting the current guidelines emphasizing timely screening, early identification, and proactive management of risk factors, including BP, glucose, and lipids, starting from young adulthood.29–32 Particularly, considering the MetS-persistent group tended to be more obese and consume more alcohol and cigarette and both men and women with worse metabolic profiles demonstrated a higher risk of CVD in this cohort, lifestyle modification for modifiable risk factors is highly recommended in young adults regardless of sex.
Regarding the individual components of MetS, previous studies have commonly reported that low HDL-c was the most prevalent component in young adults with MetS.9,33 Contrary to prior reports, we revealed that elevated BP and hypertriglyceridaemia were more steadily prevalent among the MetS criteria in this population. In this study, the frequency of individuals persistently exposed to elevated BP and high triglycerides was 13.9 and 14.0%, respectively. This may be originated from the Korean cultural background, where alcohol plays an important part in daily social life and binge drinking is common in young adults,34 considering that BP and triglycerides levels are highly influenced by alcohol consumption.35,36 The increased risk of CVD, MI, and ischaemic stroke was predominantly driven by cumulative exposure to elevated BP, and the optimization of BP at follow-up significantly reduced the risk of clinical events. This finding aligns with previous studies highlighting hypertension as one of the most critical risk factors for early-onset MI and stroke.37–39 A recent meta-analysis addressed a gradual association between BP categories and CVD among young adults below the age of 45, indicating that even individuals with normal and high normal BP, defined as systolic/diastolic BP of 120–139/80–89 mmHg, were at risk of developing CVD, with a cardiometabolic risk accumulation.40 Moreover, a longer exposure duration to high BP leads to a higher lifetime risk of hypertension-mediated organ damage, including CVD. In a prospective study by Wang et al.,39 hypertension was associated with a higher risk of CVD, and the associations were stronger with a younger age of onset, emphasizing more stringent anti-hypertensive management as early as possible to reduce the duration of exposure to high BP and burden of following CVD. However, there is currently a lack of high-quality evidence that lowering BP in young adults improves cardiovascular outcomes later in life.41 Some clinicians may question the need to strictly control BP in young adults due to low absolute cardiovascular risk. In this study, by directly illustrating the halved CVD risk in the BP-recovered group relative to the BP-persistent group, we emphasize the importance of and offer practical guidance for managing high BP among young adults. Our results could support the pooled analysis from the EPOCH-JAPAN study, where the logarithmically linear relationship between death from CVD and BP showed a higher slope in the younger age group.42 This implies a relatively stronger risk reduction of BP optimization among young adults.
Despite the low but rising prevalence of MetS, including high BP, among young adults, most of them are unaware of their risk factors and the heightened metabolic risk exposure.43 The lack of disease awareness would translate into a substantial burden for both individuals and society as a whole. Given that cardiovascular risk factors as components of MetS are asymptomatic and have cumulative effects on lifetime risk, periodic screening using easily measured clinical parameters and education for a healthy diet, smoking cessation, and physical activity in young adults are required to achieve ideal cardiovascular health in the long term.
There are several limitations in this study. First, there are limitations related to the observational retrospective design using the claims database. However, definitions by the diagnostic codes from the NHIS database were previously validated and coterminally used in numerous prior studies.14,16 Additionally, there were no specific exclusion criteria other than those related to the study outcome; therefore, the database represented the entire population of young Koreans under the age of 40 years, making it relatively free from selection bias. To clarify a causal relationship, we collected the study outcome data 1 year after enrolment. Second, there are still various definitions of MetS, ranging from the gluco-centric World Health Organization to an obesity-centric IDF definition and a compilation of statistically related cardiovascular risk factors by the National Cholesterol Education Program Adult Treatment Panel III definition.44 Although the MetS definition utilized in this study is currently mostly accepted,44 further studies are warranted to validate our findings when applying alternative definitions in this cohort. Third, the study participants were exclusively from Korea, who underwent the serial National Health Screening examinations, although this was the single largest cohort including young adults under 40 years. International multi-ethnic studies are needed to achieve external generalizability because MetS and subsequent CVD considerably differ across regions and ethnicity.45 Lastly, we could not assess inter-rim change or fluctuations in MetS status between E1 and E2 or after E2, as well as information on other risk factors such as dietary patterns or changes in medications and smoking habits, under the current study design. However, in our previous study involving 3 280 826 young adults aged 20–39 years, the risk of MI was still high in smoking quitters compared with non-smokers.46 Even with the adjustment solely for smoking status at baseline, the impact of smoking on the future risk of CVD may be relatively modest.
Conclusions
Cumulative exposure to metabolic risk, assessed by changes in MetS status at two distinct time points, was significantly associated with the increased risk of CVD, MI, and ischaemic stroke among young adults under the age of 40. The risk of clinical events had a stepwise increase according to the cumulative metabolic risk exposure, exhibiting the highest risk in the MetS-persistent group. Among the MetS criteria, persistent exposure to elevated BP conferred the highest risk of CVD, MI, and ischaemic stroke, and recovery from elevated BP was independently associated with the reduction of clinical events. Efforts to optimize cardiometabolic profiles even after the establishment of MetS might help prevent CVD from young adulthood.
Supplementary material
Supplementary material is available at European Journal of Preventive Cardiology.
Acknowledgements
The authors would like to thank Kyu-na Lee for his helpful assistance in statistical analysis. The whole or part of the work of the article was not presented previously.
Author contribution
H.L., T.-M.R., H.E.P., and S.-Y.C.: conception and design; H.L., K.H., and S.-Y.C.: data acquisition; H.L., K.H., and S.-Y.C.: data analysis and interpretation; H.L., K.H., and S.-Y.C.: statistical analysis; H.L. and S.-Y.C.: drafting and finalizing the paper; T.-M.R. and H.E.P.: critical revision of the paper for important intellectual content.
Funding
None declared.
Data availability
The data underlying this article will be shared on reasonable request to the corresponding author.
References
Author notes
Kyungdo Han and Su-Yeon Choi contributed equally to this work as corresponding authors.
Conflict of interest: none declared.

Comments