


Abstract
Apolipoprotein A1 (ApoA1) is the principal protein component of high-density lipoprotein (HDL). Although low HDL cholesterol (HDL-C) levels are known to be associated with greater cardiovascular risk, recent studies have also shown heightened mortality risk at very high HDL-C levels.
To investigate the sex-specific association between elevated ApoA1 levels and adverse outcomes, and their genetic basis.
A prospective cohort study of United Kingdom Biobank participants without coronary artery disease at enrollment was performed. The primary exposure was serum ApoA1 levels. The primary and secondary outcome measures were cardiovascular and all-cause death, respectively.
In 402 783 participants followed for a median of 12.1 years, there was a U-shaped relationship between ApoA1 levels and both cardiovascular as well as all-cause mortality, after adjustment for traditional cardiovascular risk factors. Individuals in the highest decile of ApoA1 levels (1.91–2.50 g/L) demonstrated higher cardiovascular (HR 1.21, 95% CI 1.07–1.37, P < 0.0022) and all-cause mortality (HR 1.14, 95% CI 1.07–1.21, P < 0.0001) compared with those within the lowest risk eighth decile (1.67–1.75 g/L). The U-shaped relationship was present in both sexes, though more pronounced in men. Sensitivity analyses showed that cardiovascular mortality rates were higher in those with greater alcohol intake (P < 0.004). Adjustment for polygenic variation associated with higher ApoA1 levels did not attenuate the effect of very high ApoA1 levels on mortality. In the sub-group with very elevated HDL-C levels (> 80 mg/dL in men, > 100 mg/dL in women), there was no association between ApoA1 levels and mortality.
Both very low and very elevated ApoA1 levels are associated with higher cardiovascular and all-cause mortality.
Introduction
Elevated high-density lipoprotein cholesterol (HDL-C) levels have historically been regarded as protective against cardiovascular disease (CVD).1 However, recent studies indicate a U-shaped relationship between HDL-C levels and mortality where not only low HDL-C levels, but also markedly high levels of HDL-C (defined as HDL-C > 80 mg/dL in men, HDL-C > 100 mg/dL in women) are paradoxically associated with increased risk, particularly in the male population.2–6 Apolipoprotein A1 (ApoA1) is the principal protein component of HDL and serves an important role in lipid metabolism.7 Studies to date, in a total of more than 500 000 largely European participants, have reported a linear, inverse relationship between ApoA1 levels and cardiovascular mortality.8–16 In the context of the differing distribution of outcomes with respect to ApoA1 and HDL-C (linear vs. U-shaped), the aims of this study were to investigate (a) the sex-specific relationships between very high ApoA1 levels and incident CVD risk and mortality, (b) whether ApoA1 level measurements can help categorize individuals with very high HDL-C levels into clinically relevant sub-groups, and (c) whether genetic variations accounted for these observations. Our hypothesis was that very high ApoA1 levels will also be associated with higher mortality, similar to HDL-C. For this purpose, we examined outcomes based on ApoA1 levels in the United Kingdom Biobank (UKB), a large cohort of 402 783 participants followed over 12 years, while adjusting for cardiovascular risk factors and polygenic variation of ApoA1 levels.
Methods
Study cohort
We analysed data from 402 783 participants without known coronary artery disease (CAD) enrolled in the UKB.17 Participants aged between 37 and 73 years were enrolled from the general population of the United Kingdom between 2006 and 2010. Data were collected using a standardized questionnaire on sociodemographic characteristics, health status and physician-diagnosed medical conditions, family history, and lifestyle factors. The UKB data were subsequently linked to Hospital Episode Statistics (HES) data covering all hospital admissions until 2021, dating back to 1997 for England, 1998 for Wales, and 1981 for Scotland. HES uses International Classification of Diseases (ICD) 10th revision to record diagnosis information and OPCS-4 (Office of Population, Censuses and Surveys: Classification of Interventions and Procedures, version 4) to code operative procedures. Death registries included all deaths until 2021, with both primary and secondary causes of death coded in ICD-10.17
We identified individuals without a history of CAD at enrollment, where CAD was defined by in-patient HES based on ICD-10 codes I20–I25, and OPCS-4 codes K40–K46, K49, K50, or K75. Patients with CAD prior to the enrollment date, as well as those with a self-reported heart attack or stroke history, were excluded. Follow-up duration was defined as the time from enrollment until either incident cardiovascular death, incident all-cause death, loss to follow-up, or end of follow-up. Date and cause of death were obtained from the death registry. We defined incident cardiovascular death using ICD-10 codes of deaths from diseases of the heart (I00–I09, I11, I13, and I20–I51), essential hypertension and hypertensive renal disease (I10, I12, and I15), and cerebrovascular diseases (I60–I69).18 Demographic and relevant risk factor variables were obtained at enrollment, including age, sex, race, body mass index (BMI), hypertension, diabetes, triglycerides, low-density lipoprotein cholesterol (LDL-C), estimated glomerular filtration rate (eGFR), smoking, and alcohol use. eGFR was calculated using the Chronic Kidney Disease Epidemiology Collaboration equation.19 Alcohol use was quantified through a self-reported survey as a numerically assigned, graded variable as follows: 0 = never; 1 = special occasions only; 2 = one to three times a month; 3 = once or twice a week; 4 = three or four times a week; 5 = daily or almost daily. A detailed description of the collection, preparation, and analysis of all serum biochemical assays, including for ApoA1 and HDL-C, is provided in Supplementary material online, Table S1.
Statistical analysis
ANOVA for continuous variables and χ2 test for categorical variables were used to compare clinical characteristics between 10 decile categories of ApoA1 levels in the overall cohort, and separately for men and women. The rationale for categorization into deciles was to generate a high level of data granularity that incorporated potential non-linear associations. Continuous variables were reported as mean ± standard deviation (SD), and categorical variables were reported as frequency (proportion). The ApoA1 decile with the lowest proportion of all-cause and cardiovascular deaths was considered as the reference, and all other decile groups were compared to the reference to calculate hazard ratio (HR) estimates using Cox proportional hazards models for all-cause death and Fine and Gray’s sub-distribution hazard models for cardiovascular death, treating the non-cardiovascular deaths as competing risks.20 The models were adjusted for age, sex, race, BMI, hypertension, diabetes, smoking, alcohol use, triglycerides, LDL-C, and eGFR.
A sensitivity analysis among stratified groups was conducted to explore the interaction between ApoA1 levels and sex, age, race, BMI, diabetes, hypertension, LDL-C and triglyceride levels, alcohol use, smoking, and eGFR, using the aforementioned fully adjusted statistical model.
The association between ApoA1 and all-cause and cardiovascular death was examined using HR curves that allowed non-linear associations. Median levels of ApoA1 were used as the reference, with adjustment for the aforementioned covariates. The 95% confidence intervals were computed along a continuous spectrum of ApoA1 levels. The same analysis was performed in the sub-cohort of participants with high HDL-C levels (males with HDL-C > 80 mg/dL, females with HDL-C > 100 mg/dL). A risk reclassification analysis was performed to elucidate whether ApoA1 level measurement could help categorize individuals with very high HDL-C levels into clinically relevant sub-groups. The analysis was performed using R package smoothHR.21
To account for the genetic variation among participants, an ApoA1 polygenic score (PGS) was added to the adjusted statistical model as an additional covariate. The PGS was calculated based on a recent large genome-wide association study (GWAS) of ApoA1 within the UKB.22,23 The PGS was created as a multi-ancestry score, based on the 454 independent genetic variants associated with ApoA1 at a genome-wide level (P < 5 × 10⁻⁹) among a total of 330 515 UKB participants of White British, White non-British, African, South Asian, and East Asian ancestry.24 The beta coefficients for the association between the single-nucleotide polymorphisms (SNPs) and ApoA1 levels were used as weights, and the PGS was calculated as the weighted sum of the effect alleles, then standardized to z-scores with a mean of zero and SD of 1.
Statistical significance was defined as P < 0.05. SAS Version 9.4 (Cary, NC) and R Version 4.0.2 (https://www.R-project.org/) were used for analyses.
Results
In 402 783 participants without diagnosed CAD enrolled in the UKB, with an average age of 56 years, 45% male, and 83% White, the mean ApoA1 level was 1.54 g/L [(range: 0.42 g/L–2.50 g/L]. The demographic and risk factor profile of the population divided into deciles of ApoA1 levels is shown in Table 1A. Participants in the highest (10th) ApoA1 decile (1.91–2.5 g/L) were more likely to be older, female, and White, with lower rates of diabetes mellitus and hypertension, lower BMI and eGFR, and higher prevalence of smoking and frequent alcohol use. They also had higher total cholesterol and HDL-C levels, lower triglycerides, and higher testosterone levels (men only) and PGS z-scores when compared to participants with lower ApoA1 levels. These differences were similar in men and women (Table 1B and 1C). HDL-C and ApoA1 levels were highly correlated, with an R2 value of 0.84 (see Supplementary material online, Figure S1). The average ApoA1 level in the 181 256 men was lower (1.43 g/L) compared with the 221 527 women (1.64 g/L) (Table 1B and 1C, Supplementary material online, Figure S2).
Baseline characteristics: UKB by ApoA1 deciles, overall cohort
| ApoA1 level (g/L) | 0.42–1.22 | 1.23–1.32 | 1.33–1.39 | 1.40–1.45 | 1.46–1.52 | 1.53–1.59 | 1.60–1.66 | 1.67–1.75 | 1.76–1.91 | 1.91–2.50 | P-value |
|---|---|---|---|---|---|---|---|---|---|---|---|
| n (%) | 40 522 | 40 541 | 39 935 | 40 298 | 40 599 | 39 929 | 40 604 | 39 954 | 40 286 | 40 115 | |
| Age, years | 54.6 ± 8.5 | 55.1 ± 8.4 | 55.6 ± 8.3 | 55.9 ± 8.2 | 56.1 ± 8.1 | 56.4 ± 8.0 | 56.7 ± 7.9 | 56.9 ± 7.8 | 57.3 ± 7.6 | 57.7 ± 7.4 | <0.001 |
| Male (%) | 31 126 (76.81) | 27 635 (68.17) | 24 334 (60.93) | 21 874 (54.28) | 19 221 (47.34) | 16 362 (40.98) | 13 903 (34.24) | 11 371 (28.46) | 9097 (22.58) | 6333 (15.79) | <0.001 |
| White (%) | 32 267 (79.63) | 33 062 (81.55) | 32 961 (82.54) | 33 449 (83) | 33 817 (83.3) | 33 528 (83.97) | 34 090 (83.96) | 33 607 (84.11) | 34 031 (84.47) | 33 868 (84.43) | <0.001 |
| Hypertension (%) | 12 028 (29.88) | 11 522 (28.55) | 11 027 (27.72) | 10 626 (26.45) | 10 349 (25.58) | 9919 (24.93) | 9795 (24.2) | 9108 (22.87) | 8952 (22.28) | 9029 (22.56) | <0.001 |
| Diabetes (%) | 4001 (9.95) | 2764 (6.86) | 2221 (5.59) | 1912 (4.76) | 1718 (4.25) | 1443 (3.63) | 1302 (3.22) | 1036 (2.6) | 884 (2.2) | 839 (2.10) | <0.001 |
| eGFR, mL/min/1.73 m2 | 91.9 ± 14.4 | 91.6 ± 13.7 | 91.5 ± 13.4 | 91.4 ± 13.2 | 91.5 ± 12.9 | 91.2 ± 13.0 | 91.3 ± 12.7 | 91.2 ± 12.6 | 91.0 ± 12.4 | 91.0 ± 12.4 | <0.001 |
| Frequent alcohol use (%)a | 10 994 (27.24) | 13 409 (33.17) | 14 670 (36.82) | 15 858 (39.42) | 17 131 (42.29) | 17 473 (43.85) | 19 031 (46.94) | 19 905 (49.9) | 21 778 (54.15) | 25 165 (62.84) | <0.001 |
| Alcohol use, graded 0–5b | 2.5 ± 1.5 | 2.7 ± 1.5 | 2.9 ± 1.5 | 2.9 ± 1.5 | 3.0 ± 1.5 | 3.1 ± 1.5 | 3.2 ± 1.5 | 3.3 ± 1.5 | 3.4 ± 1.5 | 3.7 ± 1.4 | <0.001 |
| Current/former smoker (%) | 19 365 (48.12) | 18 509 (45.92) | 17 753 (44.69) | 17 783 (44.33) | 17 434 (43.14) | 17 007 (42.8) | 17 328 (42.87) | 17 052 (42.89) | 17 235 (42.95) | 18 176 (45.48) | <0.001 |
| BMI, kg/m2 | 29.4 ± 5.0 | 28.8 ± 4.8 | 28.4 ± 4.8 | 28.0 ± 4.7 | 27.6 ± 4.7 | 27.2 ± 4.6 | 26.8 ± 4.5 | 26.3 ± 4.4 | 25.8 ± 4.2 | 25.1 ± 3.9 | <0.001 |
| Total cholesterol, mg/dL | 198.5 ± 43.9 | 209.8 ± 42.6 | 213.9 ± 42.2 | 217.6 ± 41.7 | 220.8 ± 41.4 | 223.9 ± 41.0 | 226.9 ± 40.2 | 231.1 ± 39.7 | 236.0 ± 39.3 | 245.4 ± 39.4 | <0.001 |
| LDL-C, mg/dL | 131.2 ± 33.6 | 137.4 ± 33.3 | 138.9 ± 33.3 | 140.1 ± 33.1 | 140.7 ± 33.1 | 141.1 ± 33.0 | 141.0 ± 32.6 | 141.5 ± 32.3 | 141.3 ± 32.2 | 140.7 ± 32.0 | <0.001 |
| HDL-C, mg/dL | 36.6 ± 4.9 | 42.6 ± 4.3 | 46.4 ± 4.5 | 49.7 ± 4.8 | 53.0 ± 5.1 | 56.4 ± 5.4 | 60.3 ± 5.8 | 64.8 ± 6.3 | 70.6 ± 7.2 | 81.8 ± 10.5 | <0.001 |
| Triglycerides, mg/dL | 206.2 ± 122.6 | 186.3 ± 104.1 | 172.7 ± 94.9 | 162.4 ± 89.8 | 154.5 ± 84.3 | 146.4 ± 79.1 | 139.1 ± 74.7 | 131.9 ± 70.1 | 124.4 ± 64.7 | 116.8 ± 61.0 | <0.001 |
| PGS (z score) | −0.42 ± 0.98 | −0.25 ± 0.97 | −0.15 ± 0.97 | −0.10 ± 0.96 | −0.03 ± 0.97 | 0.03 ± 0.97 | 0.09 ± 0.97 | 0.16 ± 0.97 | 0.26 ± 0.97 | 0.41 ± 0.98 | <0.001 |
| All-cause death (%) | 3542 (8.74) | 2895 (7.14) | 2547 (6.38) | 2390 (5.93) | 2270 (5.59) | 2293 (5.74) | 2214 (5.45) | 2111 (5.28) | 2195 (5.45) | 2286 (5.7) | <0.001 |
| Cardiovascular death (%) | 1263 (3.12) | 921 (2.27) | 781 (1.96) | 729 (1.81) | 641 (1.58) | 675 (1.69) | 582 (1.43) | 527 (1.32) | 579 (1.44) | 549 (1.37) | <0.001 |
Mean ± SD shown unless stated. GFR, glomerular filtration rate; BMI, body mass index; LDL-C, low-density lipoprotein cholesterol; HDL-C, high-density lipoprotein cholesterol; PGS, polygenic score. ANOVA for continuous variables and χ2 test for categorical variables were used to compare clinical characteristics across ApoA1 groups.
Frequent alcohol use defined as alcohol consumption ≥3 times per week.
Alcohol use quantified as graded variable as follows: 0 = Never; 1 = Special occasions only; 2 = One to three times a month; 3 = Once or twice a week; 4 = Three or four times a week; 5 = Daily or almost daily.
Baseline characteristics: UKB by ApoA1 deciles. Male only cohort
| ApoA1 level (g/L) | 0.42–1.17 | 1.18–1.24 | 1.25–1.30 | 1.31–1.36 | 1.37–1.41 | 1.42–1.47 | 1.48–1.53 | 1.54–1.61 | 1.62–1.73 | 1.74–2.50 | P-value |
|---|---|---|---|---|---|---|---|---|---|---|---|
| n (%) | 18 198 | 18 106 | 18 214 | 18 137 | 17 987 | 18 253 | 18 087 | 18 028 | 18 135 | 18 111 | |
| Age, years | 54.8 ± 8.5 | 55.2 ± 8.4 | 55.6 ± 8.3 | 55.9 ± 8.3 | 56.1 ± 8.2 | 56.4 ± 8.1 | 56.6 ± 8.1 | 57.0 ± 8.0 | 57.3 ± 7.9 | 57.9 ± 7.7 | <0.001 |
| White (%) | 14 346 (78.83) | 14 669 (81.02) | 15 003 (82.37) | 15 050 (82.98) | 15 091 (83.9) | 15 343 (84.06) | 15 315 (84.67) | 15 427 (85.57) | 15 464 (85.27) | 15 458 (85.35) | <0.001 |
| Hypertension (%) | 5608 (31.03) | 5375 (29.82) | 5281 (29.11) | 5171 (28.62) | 5047 (28.13) | 4931 (27.1) | 4907 (27.2) | 4853 (27) | 4806 (26.57) | 5158 (28.56) | <0.001 |
| Diabetes (%) | 2062 (11.42) | 1512 (8.41) | 1245 (6.87) | 1153 (6.39) | 914 (5.1) | 863 (4.74) | 815 (4.52) | 715 (3.98) | 675 (3.73) | 613 (3.4) | <0.001 |
| eGFR, mL/min/1.73 m2 | 91.6 ± 14.6 | 91.5 ± 13.7 | 91.3 ± 13.2 | 91.1 ± 13.2 | 91.1 ± 12.8 | 91.0 ± 12.7 | 91.3 ± 12.5 | 91.1 ± 12.4 | 91.5 ± 12.1 | 91.7 ± 12.1 | <0.001 |
| Frequent alcohol use (%)a | 5088 (28.09) | 6405 (35.47) | 7394 (40.72) | 8120 (44.88) | 8806 (49.04) | 9734 (53.41) | 10 509 (58.19) | 11 328 (62.95) | 12 537 (69.25) | 14 114 (78.09) | <0.001 |
| Alcohol use, graded 0–5 b | 2.6 ± 1.5 | 2.9 ± 1.5 | 3.0 ± 1.5 | 3.2 ± 1.4 | 3.3 ± 1.4 | 3.4 ± 1.4 | 3.6 ± 1.3 | 3.7 ± 1.3 | 3.9 ± 1.2 | 4.2 ± 1.1 | <0.001 |
| Current/former smoker (%) | 9083 (50.29) | 8788 (48.82) | 8755 (48.32) | 8597 (47.66) | 8636 (48.25) | 8850 (48.69) | 8735 (48.49) | 8893 (49.57) | 9310 (51.57) | 9854 (54.6) | <0.001 |
| BMI, kg/m2 | 29.4 ± 4.6 | 28.9 ± 4.4 | 28.5 ± 4.2 | 28.2 ± 4.1 | 27.9 ± 4.1 | 27.6 ± 3.9 | 27.3 ± 3.9 | 27.0 ± 3.8 | 26.6 ± 3.7 | 25.9 ± 3.6 | <0.001 |
| Total cholesterol, mg/dL | 194.3 ± 44.0 | 204.9 ± 42.0 | 210.1 ± 41.9 | 212.2 ± 41.5 | 215.0 ± 41.2 | 217.7 ± 40.5 | 220.2 ± 40.3 | 222.8 ± 39.9 | 226.1 ± 39.1 | 233.2 ± 38.7 | <0.001 |
| LDL-C, mg/dL | 128.2 ± 33.1 | 134.8 ± 32.6 | 137.4 ± 32.6 | 138.2 ± 32.6 | 139.0 ± 32.5 | 139.7 ± 32.0 | 140.0 ± 32.2 | 139.9 ± 31.9 | 139.2 ± 31.5 | 137.4 ± 31.5 | <0.001 |
| HDL-C, mg/dL | 34.2 ± 4.4 | 39.2 ± 3.9 | 42.0 ± 4.0 | 44.6 ± 4.1 | 47.0 ± 4.3 | 49.6 ± 4.5 | 52.5 ± 4.8 | 56.0 ± 5.2 | 60.9 ± 5.9 | 71.8 ± 10.1 | <0.001 |
| Triglycerides, mg/dL | 224.9 ± 132.5 | 205.4 ± 112.5 | 196.9 ± 107.4 | 184.1 ± 99.1 | 177.0 ± 96.1 | 169.1 ± 92.2 | 162.1 ± 87.5 | 153.9 ± 84.2 | 145.3 ± 81.6 | 132.6 ± 78.7 | <0.001 |
| Testosterone, nmol/L | 11.2 ± 3.7 | 11.4 ± 3.6 | 11.6 ± 3.6 | 11.8 ± 3.6 | 12.0 ± 3.6 | 12.2 ± 3.6 | 12.3 ± 3.7 | 12.5 ± 3.7 | 12.7 ± 3.8 | 12.9 ± 3.9 | <0.001 |
| PGS (z score) | −0.47 ± 0.99 | −0.30 ± 0.96 | −0.18 ± 0.96 | −0.09 ± 0.96 | −0.03 ± 0.94 | 0.04 ± 0.95 | 0.11 ± 0.96 | 0.21 ± 0.96 | 0.30 ± 0.98 | 0.48 ± 0.98 | <0.001 |
| All-cause death (%) | 1813 (9.96) | 1520 (8.4) | 1371 (7.53) | 1315 (7.25) | 1279 (7.11) | 1261 (6.91) | 1245 (6.88) | 1264 (7.01) | 1327 (7.32) | 1658 (9.15) | <0.001 |
| Cardiovascular death (%) | 677 (3.72) | 539 (2.98) | 470 (2.58) | 418 (2.3) | 446 (2.48) | 432 (2.37) | 374 (2.07) | 417 (2.31) | 384 (2.12) | 526 (2.9) | <0.001 |
Mean ± SD shown unless stated. GFR, glomerular filtration rate; BMI, body mass index; LDL-C, low-density lipoprotein cholesterol; HDL-C, high-density lipoprotein cholesterol; PGS, polygenic score. ANOVA for continuous variables and χ2 test for categorical variables were used to compare clinical characteristics across ApoA1 groups.
Frequent alcohol use defined as alcohol consumption ≥3 times per week.
Alcohol use quantified as graded variable as follows: 0 = Never; 1 = Special occasions only; 2 = One to three times a month; 3 = Once or twice a week; 4 = Three or four times a week; 5 = Daily or almost daily.
Baseline characteristics: UKB by ApoA1 deciles. Female only cohort
| ApoA1 level (g/L) | 0.56–1.32 | 1.33–1.41 | 1.42–1.49 | 1.50–1.55 | 1.56–1.61 | 1.62–1.68 | 1.69–1.75 | 1.76–1.85 | 1.86–2.00 | 2.01–2.50 | P-value |
|---|---|---|---|---|---|---|---|---|---|---|---|
| n (%) | 22 302 | 22 220 | 21 968 | 22 309 | 21 979 | 22 177 | 22 145 | 22 165 | 22 145 | 22 117 | |
| Age, years | 53.8 ± 8.4 | 55.0 ± 8.3 | 55.5 ± 8.2 | 55.9 ± 8.1 | 56.3 ± 8.0 | 56.5 ± 7.9 | 56.7 ± 7.8 | 57.1 ± 7.7 | 57.4 ± 7.5 | 57.7 ± 7.3 | <0.001 |
| White (%) | 17 803 (79.83) | 18 057 (81.26) | 18 026 (82.06) | 18 432 (82.62) | 18 200 (82.81) | 18 507 (83.45) | 18 570 (83.86) | 18 648 (84.13) | 18 641 (84.18) | 18 630 (84.23) | <0.001 |
| Hypertension (%) | 6070 (27.39) | 5804 (26.23) | 5469 (24.99) | 5246 (23.6) | 5076 (23.19) | 4979 (22.52) | 4691 (21.25) | 4677 (21.15) | 4611 (20.87) | 4595 (20.82) | <0.001 |
| Diabetes (%) | 1667 (7.53) | 1146 (5.19) | 956 (4.37) | 759 (3.41) | 699 (3.19) | 608 (2.75) | 502 (2.27) | 422 (1.91) | 409 (1.85) | 385 (1.74) | <0.001 |
| eGFR, mL/min/1.73 m2 | 92.5 ± 14.7 | 92.0 ± 13.9 | 91.7 ± 13.6 | 91.5 ± 13.2 | 91.3 ± 13.2 | 91.1 ± 13.0 | 91.1 ± 12.8 | 90.9 ± 12.7 | 90.9 ± 12.4 | 90.8 ± 12.4 | <0.001 |
| Frequent alcohol use (%)a | 3724 (16.76) | 4815 (21.72) | 5774 (26.35) | 6681 (30.01) | 7318 (33.37) | 8417 (38) | 9218 (41.7) | 10 173 (45.97) | 11 642 (52.66) | 13 617 (61.67) | <0.001 |
| Alcohol use, graded 0–5 b | 2.1 ± 1.4 | 2.3 ± 1.5 | 2.5 ± 1.5 | 2.6 ± 1.5 | 2.7 ± 1.5 | 2.9 ± 1.5 | 3.0 ± 1.5 | 3.2 ± 1.5 | 3.4 ± 1.5 | 3.6 ± 1.4 | <0.001 |
| Current/former smoker (%) | 9231 (41.67) | 8723 (39.47) | 8580 (39.25) | 8419 (37.93) | 8408 (38.41) | 8577 (38.86) | 8677 (39.4) | 8768 (39.71) | 9106 (41.31) | 9652 (43.79) | <0.001 |
| BMI, kg/m2 | 29.5 ± 5.9 | 28.8 ± 5.6 | 28.1 ± 5.4 | 27.6 ± 5.2 | 27.1 ± 5.0 | 26.7 ± 4.8 | 26.3 ± 4.6 | 25.9 ± 4.5 | 25.5 ± 4.3 | 24.8 ± 3.9 | <0.001 |
| Total cholesterol, mg/dL | 205.4 ± 44.9 | 215.6 ± 43.3 | 219.9 ± 32.8 | 223.2 ± 41.6 | 226.4 ± 41.5 | 229.1 ± 40.4 | 232.9 ± 39.9 | 236.1 ± 39.5 | 240.8 ± 39.2 | 249.4 ± 39.2 | <0.001 |
| LDL-C, mg/dL | 135.8 ± 35.1 | 139.9 ± 34.4 | 141.0 ± 34.3 | 141.5 ± 33.5 | 142.0 ± 33.7 | 141.9 ± 32.9 | 142.5 ± 32.6 | 142.2 ± 32.4 | 142.1 ± 32.2 | 141.5 ± 31.9 | <0.001 |
| HDL-C, mg/dL | 41.7 ± 5.5 | 48.2 ± 4.8 | 52.1 ± 5.1 | 55.5 ± 5.3 | 58.8 ± 5.5 | 62.0 ± 5.9 | 65.7 ± 6.3 | 69.8 ± 6.8 | 75.3 ± 7.7 | 85.3 ± 10.3 | <0.001 |
| Triglycerides, mg/dL | 166.7 ± 99.2 | 157.3 ± 87.7 | 150.0 ± 82.0 | 142.9 ± 76.1 | 137.0 ± 72.1 | 132.8 ± 69.5 | 127.9 ± 64.9 | 122.7 ± 61.0 | 118.1 ± 57.7 | 113.6 ± 56.6 | <0.001 |
| PGS (z score) | −0.43 ± 0.99 | −0.28 ± 0.97 | −0.18 ± 0.97 | −0.11 ± 0.96 | −0.04 ± 0.96 | 0.02 ± 0.95 | 0.08 ± 0.95 | 0.17 ± 0.96 | 0.28 ± 0.96 | 0.43 ± 0.98 | <0.001 |
| All-cause death (%) | 1405 (6.3) | 1124 (5.06) | 1015 (4.62) | 1038 (4.65) | 1019 (4.64) | 1069 (4.82) | 942 (4.25) | 1002 (4.52) | 1030 (4.65) | 1046 (4.73) | <0.001 |
| Cardiovascular death (%) | 391 (1.75) | 276 (1.24) | 261 (1.19) | 252 (1.13) | 255 (1.16) | 245 (1.1) | 202 (0.91) | 224 (1.01) | 238 (1.07) | 220 (0.99) | <0.001 |
Mean ± SD shown unless stated. GFR, glomerular filtration rate; BMI, body mass index; LDL-C, low-density lipoprotein cholesterol; HDL-C, high-density lipoprotein cholesterol; PGS, polygenic score. ANOVA for continuous variables and χ2 test for categorical variables were used to compare clinical characteristics across ApoA1 groups.
Frequent alcohol use defined as alcohol consumption ≥3 times per week.
Alcohol use quantified as graded variable as follows: 0 = Never; 1 = Special occasions only; 2 = One to three times a month; 3 = Once or twice a week; 4 = Three or four times a week; 5 = Daily or almost daily.
Outcomes
Over a median follow-up period of 12.1 years, there were a total of 24 743 (6.1%) all-cause deaths, of which 7247 (1.8%) were cardiovascular deaths; men had 14 053 (7.8%) all-cause and 4683 (2.6%) cardiovascular deaths, whereas women had 10 690 (4.8%) all-cause and 2564 (1.2%) cardiovascular deaths.
Unadjusted analyses by ApoA1 deciles demonstrated that participants with ApoA1 levels in the lowest decile between 0.42 and 1.22 g/L had the highest all-cause and cardiovascular mortality, while those with ApoA1 values between 1.67 and 1.75 g/L (8th decile, reference) had the lowest mortality (Table 1A).
After adjusting for risk factors including age, sex, race, BMI, triglycerides, LDL-C, eGFR levels, and history of hypertension, diabetes, smoking, and alcohol use, there was a clear U-shaped relationship between ApoA1 levels, as a continuous variable, and adverse events, with higher event rates at both low and high levels of ApoA1 (Figure 1). When analysed in deciles, those within the two lowest ApoA1 deciles (0.42–1.32 g/L) had a significantly higher risk of all-cause and cardiovascular death compared with the reference decile. Importantly, participants in the highest ApoA1 decile (1.91–2.50 g/L) were also at a 14% (CI 7–21%) higher risk of all-cause death and 21% (CI 7–37%) higher risk of cardiovascular mortality compared with those at lowest risk in the eighth ApoA1 decile (Table 2A). Similarly, compared with the reference decile, individuals within the highest 5% of ApoA1 levels were at a 20% (CI 12–29%) and a 29% (CI 11–50%) higher risk of all-cause and cardiovascular death, respectively; and those within the highest 1% of ApoA1 levels were at a 46% (CI 29–66%) and 71% (CI 33–119%) higher risk of all-cause and cardiovascular death (see Supplementary material online, Table S2).

Non-linear associations between ApoA1 levels and adverse outcomes. Adjusted for age, sex (except for sex-specific analysis), race, body mass index, hypertension, diabetes, current/former smoking, frequency of alcohol use (defined as graded variable on scale of 0–5), triglycerides, LDL-C, and eGFR. Curves represent the natural log of HRs for ApoA1 levels along a continuous spectrum, with the median value of ApoA1 level being the reference. Shaded areas represent the 95% confidence interval.
Association between ApoA1 levels and adverse outcomes. Overall cohort
| Outcome | Model | 0.42–1.22 g/L (95% CI) | 1.23–1.32 g/L (95% CI) | 1.33–1.39 g/L (95% CI) | 1.40–1.45 g/L (95% CI) | 1.46–1.52 g/L (95% CI) | 1.53–1.59 g/L (95% CI) | 1.60–1.66 g/L (95% CI) | 1.67–1.75 g/L (reference) | 1.76–1.91 g/L (95% CI) | 1.91–2.50 g/L (95% CI) |
|---|---|---|---|---|---|---|---|---|---|---|---|
| All-cause mortality | Unadjusted | 1.65 (1.56–1.75); P < 0.0001 | 1.32 (1.25–1.40); P < 0.0001 | 1.17 (1.10–1.24); P < 0.0001 | 1.08 (1.02–1.15); P = 0.0074 | 1.03 (0.97–1.10); P = 0.2887 | 1.07 (1.01–1.13); P = 0.0341 | 1.02 (0.96–1.08); P = 0.6025 | 1.00 | 1.03 (0.97–1.10); P = 0.3085 | 1.09 (1.03–1.15); P = 0.0053 |
| Adjusteda | 1.31 (1.24–1.39); P < 0.0001 | 1.13 (1.06–1.20); P < 0.0001 | 1.03 (0.97–1.09); P = 0.3563 | 1.00 (0.94–1.06); P = 0.9007 | 0.97 (0.91–1.03); P = 0.2642 | 1.02 (0.96–1.08); P = 0.4989 | 0.99 (0.93–1.05); P = 0.7545 | 1.00 | 1.06 (1.00–1.13); P = 0.0533 | 1.14 (1.07–1.21); P < 0.0001 | |
| PGS Adjustedb | 1.29 (1.22–1.37); P < 0.0001 | 1.12 (1.05–1.18); P = 0.0004 | 1.02 (0.96–1.08); P = 0.5495 | 0.99 (0.93–1.05); P = 0.7316 | 0.96 (0.91–1.03); P = 0.2377 | 1.02 (0.96–1.08); P = 0.6102 | 0.99 (0.93–1.05); P = 0.6958 | 1.00 | 1.07 (1.01–1.14); P = 0.032 | 1.15 (1.08–1.22); P < 0.0001 | |
| CV mortality | Unadjusted | 2.08 (1.87–2.31); P < 0.0001 | 1.52 (1.36–1.69); P < 0.0001 | 1.32 (1.18–1.47); P < 0.0001 | 1.24 (1.10–1.39) P = 0.0002 | 1.11 (0.99–1.25) P = 0.0788 | 1.22 (1.08–1.36); P = 0.0008 | 1.05 (0.94–1.18); P = 0.3975 | 1.00 | 1.11 (0.99–1.25); P = 0.0811 | 1.09 (0.96–1.23); P = 0.1757 |
| Adjusteda | 1.35 (1.20–1.51); P < 0.0001 | 1.12 (1.00–1.26); P = 0.0456 | 1.03 (0.91–1.15); P = 0.6622 | 1.03 (0.92–1.16); P = 0.5946 | 0.95 (0.85–1.07); P = 0.4179 | 1.10 (0.98–1.23); P = 0.1143 | 0.99 (0.88–1.12); P = 0.8676 | 1.00 | 1.18 (1.04–1.33); P = 0.0076 | 1.21 (1.07–1.37); P = 0.0022 | |
| PGS Adjustedb | 1.30 (1.16–1.46); P < 0.0001 | 1.09 (0.97–1.23); P = 0.1396 | 1.00 (0.89–1.13); P = 0.9617 | 1.01 (0.90–1.14); P = 0.82 | 0.94 (0.83–1.06); P = 0.2962 | 1.08 (0.96–1.22); P = 0.1868 | 0.99 (0.88–1.11); P = 0.8407 | 1.00 | 1.19 (1.05–1.34); P = 0.0056 | 1.23 (1.09–1.39); P = 0.0011 |
Cox proportional hazards models were used for all-cause death; Fine and Gray’s sub-distribution hazard models were used for cardiovascular death, treating the non-cardiovascular deaths as competing risks.
Adjusted for age, sex, race, body mass index, hypertension, diabetes, current/former smoking, frequency of alcohol use (defined as graded variable on scale of 0–5), triglycerides, LDL-C, eGFR.
Adjusted for age, sex, race, body mass index, hypertension, diabetes, current/former smoking, frequency of alcohol use (defined as graded variable on scale of 0–5), triglycerides, LDL-C, eGFR, PGS and top 10 principal components.
Statistical significance defined at P < 0.05 (bold font).
The PGS accounted for 5.5% of the variance in ApoA1 levels across the study cohort and a one SD increase in the PGS was associated with a 0.064 g/L increase in ApoA1 levels (see Supplementary material online, Figure S3). Inclusion of the ApoA1 PGS in the adjusted model did not attenuate the observed risk profile (Table 2A).
Sex-specific outcomes
Compared with the lowest risk (7th) decile, in unadjusted analyses, both men and women in the lower deciles of ApoA1 levels had higher all-cause and cardiovascular mortality. Only men but not women in the highest decile of ApoA1 values had a higher risk of all-cause and cardiovascular mortality in unadjusted analyses (Table 2B and 2C).
Association between ApoA1 levels and adverse outcomes. Male only cohort.
| Outcome | Model | 0.42–1.17 g/L (95% CI) | 1.18–1.24 g/L (95% CI) | 1.25–1.30 g/L (95% CI) | 1.31–1.36 g/L (95% CI) | 1.37–1.41 g/L (95% CI) | 1.42–1.47 g/L (95% CI) | 1.48–1.53 g/L (reference) | 1.54–1.61 g/L (95% CI) | 1.62–1.73 g/L (95% CI) | 1.74–2.50 g/L (95% CI) |
|---|---|---|---|---|---|---|---|---|---|---|---|
| All-cause mortality | Unadjusted | 1.68 (1.56–1.80); P < 0.0001 | 1.36 (1.26–1.47); P < 0.0001 | 1.18 (1.09–1.27); P < 0.0001 | 1.10 (1.02–1.19); P = 0.0135 | 1.07 (0.99–1.15); P = 0.1004 | 1.02 (0.94–1.10); P = 0.6797 | 1.00 | 0.99 (0.92–1.07); P = 0.815 | 1.01 (0.94–1.10); P = 0.7406 | 1.23 (1.14–1.32); P < 0.0001 |
| Adjusteda | 1.40 (1.30–1.52); P < 0.0001 | 1.22 (1.13–1.32); P < 0.0001 | 1.09 (1.01–1.18); P = 0.0357 | 1.04 (0.96–1.13); P = 0.2916 | 1.03 (0.95–1.12); P = 0.34204 | 0.99 (0.92–1.08); P = 0.8908 | 1.00 | 1.01 (0.93–1.09); P = 0.9058 | 1.04 (0.96–1.12); P = 0.355 | 1.27 (1.18–1.37); P < 0.0001 | |
| PGS Adjustedb | 1.38 (1.28–1.49); P < 0.0001 | 1.21 (1.12–1.30); P < 0.0001 | 1.08 (1.00–1.17); P = 0.0623 | 1.03 (0.95–1.12); P = 0.4331 | 1.03 (0.95–1.11); P = 0.5184 | 1.00 (0.92–1.08); P = 0.8944 | 1.00 | 1.01 (0.93–1.09); P = 0.8068 | 1.04 (0.96–1.13); P = 0.2977 | 1.29 (1.19–1.39); P < 0.0001 | |
| CV mortality | Unadjusted | 2.04 (1.80–2.31); P < 0.0001 | 1.59 (1.39–1.81); P < 0.0001 | 1.34 (1.17–1.53); P < 0.0001 | 1.16 (1.01–1.33) P = 0.037 | 1.24 (1.08–1.42) P = 0.0023 | 1.16 (1.01–1.33); P = 0.0363 | 1.00 | 1.09 (0.95–1.25); P = 0.2343 | 0.97 (0.84–1.12); P = 0.7025 | 1.28 (1.12–1.46) P = 0.0002 |
| Adjusteda | 1.52 (1.33–1.74); P < 0.0001 | 1.29 (1.12–1.48); P < 0.0001 | 1.17 (1.02–1.35); P = 0.0279 | 1.05 (0.91–1.21); P = 0.5369 | 1.15 (1.00–1.33); P = 0.048 | 1.11 (0.96–1.28); P = 0.1504 | 1.00 | 1.13 (0.98–1.31); P = 0.0831 | 1.05 (0.90–1.21); P = 0.5559 | 1.44 (1.26–1.65); P < 0.0001 | |
| PGS Adjustedb | 1.50 (1.30–1.72); P < 0.0001 | 1.27 (1.11–1.46); P = 0.0007 | 1.16 (1.01–1.34); P = 0.0421 | 1.04 (0.90–1.20) P = 0.6298 | 1.15 (1.00–1.33) P = 0.0501 | 1.12 (0.97–1.29); P = 0.1283 | 1.00 | 1.15 (1.00–1.33); P = 0.059 | 1.07 (0.92–1.24); P = 0.3895 | 1.48 (1.29–1.70) P < 0.0001 |
Cox proportional hazards models were used for all-cause death; Fine and Gray’s sub-distribution hazard models were used for cardiovascular death, treating the non-cardiovascular deaths as competing risks.
Adjusted for age, race, body mass index, hypertension, diabetes, current/former smoking, frequency of alcohol use (defined as graded variable on scale of 0–5), triglycerides, LDL-C, eGFR.
Adjusted for age, race, body mass index, hypertension, diabetes, current/former smoking, frequency of alcohol use (defined as graded variable on scale of 0–5), triglycerides, LDL-C, eGFR, PGS and top 10 principal components.
Statistical significance defined at P < 0.05 (bold font).
Association between ApoA1 levels and adverse outcomes. Female only cohort
| Outcome | Model | 0.56–1.32 g/L (95% CI) | 1.33–1.41 g/L (95% CI) | 1.42–1.49 g/L (95% CI) | 1.50–1.55 g/L (95% CI) | 1.56–1.61 g/L (95% CI) | 1.62–1.68 g/L (95% CI) | 1.69–1.75 g/L (reference) | 1.76–1.85 g/L (95% CI) | 1.86–2.00 g/L (95% CI) | 2.01–2.5 g/L (95% CI) |
|---|---|---|---|---|---|---|---|---|---|---|---|
| All-cause mortality | Unadjusted | 1.85 (1.70–2.01); P < 0.0001 | 1.34 (1.23–1.46); P < 0.0001 | 1.18 (1.08–1.29); P = 0.0003 | 1.15 (1.05–1.26); P = 0.0017 | 1.12 (1.03–1.23); P = 0.0097 | 1.15 (1.05–1.25); P = 0.0019 | 1.00 | 1.04 (0.95–1.14); P = 0.4056 | 1.06 (0.97–1.15); P = 0.2270 | 1.05 (0.97–1.15); P = 0.2468 |
| Adjusteda | 1.45 (1.33–1.59); P < 0.0001 | 1.13 (1.03–1.24); P = 0.0007 | 1.04 (0.95–1.14); P = 0.353 | 1.06 (0.97–1.16); P = 0.2043 | 1.06 (0.97–1.16); P = 0.1915 | 1.11 (1.01–1.21); P = 0.0258 | 1.00 | 1.07 (0.98–1.17); P = 0.1589 | 1.11 (1.02–1.22); P = 0.0215 | 1.14 (1.04–1.24); P = 0.005 | |
| PGS Adjustedb | 1.47 (1.34–1.60); P < 0.0001 | 1.14 (1.04–1.25); P = 0.0042 | 1.06 (0.96–1.16); P = 0.2523 | 1.07 (0.98–1.17); P = 0.1362 | 1.07 (0.97–1.17); P = 0.1646 | 1.12 (1.02–1.22); P = 0.0154 | 1.00 | 1.08 (0.99–1.19); P = 0.0875 | 1.12 (1.02–1.23); P = 0.0148 | 1.15 (1.05–1.26); P = 0.0023 | |
| CV mortality | Unadjusted | 2.46 (2.08–2.92); P < 0.0001 | 1.55 (1.29–1.86); P < 0.0001 | 1.43 (1.19–1.72); P = 0.0001 | 1.31 (1.09–1.58) P = 0.0039 | 1.32 (1.10–1.58) P = 0.0034 | 1.23 (1.02–1.48); P = 0.0324 | 1.00 | 1.08 (0.89–1.30); P = 0.4380 | 1.13 (0.94–1.36); P = 0.2029 | 1.02 (0.85–1.24); P = 0.8212 |
| Adjusteda | 1.56 (1.31–1.87); P < 0.0001 | 1.12 (0.93–1.35); P = 0.2344 | 1.13 (0.93–1.36); P = 0.217 | 1.10 (0.91–1.33); P = 0.3152 | 1.17 (0.97–1.42); P = 0.0955 | 1.12 (0.92–1.35); P = 0.2502 | 1.00 | 1.15 (0.95–1.39); P = 0.1637 | 1.25 (1.04–1.52); P = 0.0198 | 1.23 (1.02–1.50); P = 0.0341 | |
| PGS Adjustedb | 1.53 (1.27–1.83); P < 0.0001 | 1.11 (0.92–1.34); P = 0.2955 | 1.13 (0.93–1.36); P = 0.2229 | 1.11 (0.91–1.34); P = 0.306 | 1.17 (0.97–1.41); P = 0.1068 | 1.13 (0.94–1.37); P = 0.2001 | 1.00 | 1.17 (0.96–1.42); P = 0.1147 | 1.29 (1.07–1.56); P = 0.0093 | 1.25 (1.03–1.53); P = 0.0244 |
Cox proportional hazards models were used for all-cause death; Fine and Gray’s sub-distribution hazard models were used for cardiovascular death, treating the non-cardiovascular deaths as competing risks.
Adjusted for age, race, body mass index, hypertension, diabetes, current/former smoking, frequency of alcohol use (defined as graded variable on scale of 0–5), triglycerides, LDL-C, eGFR.
Adjusted for age, race, body mass index, hypertension, diabetes, current/former smoking, frequency of alcohol use (defined as graded variable on scale of 0–5), triglycerides, LDL-C, eGFR, PGS, and top 10 principal components.
Statistical significance defined at P < 0.05 (bold font).
After adjustment for the aforementioned covariates, there was a clear U-shaped relationship between ApoA1 levels and adverse events in both sexes (Figure 1). Men in the highest decile (1.74–2.50 g/L) had a 27% (CI 18–37%) higher risk of all-cause and 44% (CI 26–65%) higher risk of cardiovascular death compared with the lowest risk decile (Table 2B). Similarly, men within the highest 5% of ApoA1 levels were at a 37% (CI 25–49%) and 48% (CI 26–73%) higher risk of all-cause and cardiovascular death, respectively, in relation to the reference group (see Supplementary material online, Table S2).
In women, those in the highest decile (2.01–2.50 g/L) had a 14% (CI 4–24%) and 23% (CI 2–50%) higher risk of all-cause and cardiovascular mortality, after adjustment (Table 2C). Similarly, women within the highest 5% of the ApoA1 level group were at a 22% (CI 10–36%) and 41% (CI 12–77%) higher risk of all-cause and cardiovascular death, respectively, compared to the reference group (see Supplementary material online, Table S2).
Inclusion of the ApoA1 PGS in the adjusted model did not attenuate the observed risk profile in either sex (Table 2B and 2C).
Sensitivity analyses
In sensitivity analyses examining the adjusted event rates in demographic sub-groups, there were significant interactions by sex, presence of hypertension, smoking, and alcohol consumption for all-cause death in the top decile of ApoA1 levels (Figure 2). Thus, men within the highest decile of ApoA1 levels had almost twice (27%) the rate of all-cause mortality compared with a 14% rate in women (P = 0.0002) (Table 2B and C). Moreover, those with a history of hypertension, smoking, and frequent alcohol consumption tended to have higher all-cause mortality compared with those without (Figure 2).
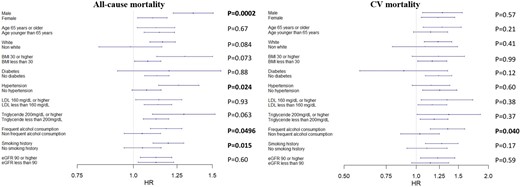
Association between the highest ApoA1 decile and adverse outcomes in sub-groups. Adjusted for age, sex, race, body mass index, hypertension, diabetes, current/former smoking, frequent alcohol use (defined as ≥3 times/week), triglycerides, LDL-C, and eGFR, excluding the variable of stratification for each model. P-values represent the interaction term between variable of stratification and 10th decile of ApoA1 levels (1.91–2.50 g/L), with the 8th decile of ApoA1 levels (1.67–1.75 g/L) being the reference.
With respect to cardiovascular mortality, a significant interaction was observed with frequent alcohol consumption only (P = 0.04), such that those within the highest decile of ApoA1 levels with frequent alcohol consumption were at greater cardiovascular mortality risk (HR 1.36, CI 1.15–1.60, P = 0.0004) compared with those without frequent alcohol consumption (HR 1.04, CI 0.86–1.25, P = 0.7) after adjustment for confounders (Figure 2).
Relationship with HDL-C levels
Because of previous data demonstrating higher mortality rates in those with very high HDL-C levels, we examined whether ApoA1 levels may help to categorize those with very high HDL-C levels (> 80 mg/dL in men and > 100 mg/dL in women) into clinically meaningful sub-groups.2–5 There was no association between varying ApoA1 levels and mortality in those with very high HDL-C levels, even after adjustment for age, sex, race, BMI, triglycerides, LDL-C, eGFR levels, and history of hypertension, diabetes, smoking, and alcohol use (see Supplementary material online, Figure S4). Moreover, a risk reclassification analysis demonstrated there was no statistically significant evidence of the incremental prognostic impact of ApoA1 levels on mortality outcomes in participants with very high HDL-C levels (see Supplementary material online, Table S3).
Discussion
In the general population free of CVD, individuals with both low as well as very high levels of circulating ApoA1 had higher all-cause and cardiovascular mortality after adjustment for risk factors and genetic variation. To our knowledge, this is the first study to identify such a U-shaped distribution, in particular the elevated risk in those with very high ApoA1 levels. The prevailing literature has only reported an inverse correlation with risk in those with low ApoA1 levels.8–16 These findings mirror recent evidence characterizing the U-shaped relationship between HDL-C levels and higher mortality rates in those with very high HDL-C levels.2–6 Our findings are consistent with the fact that ApoA1 is the principal protein component of HDL-C and its levels closely correlate with HDL-C concentrations. Additionally, we found that measurement of ApoA1 levels does not help stratify the risk profile of patients with extremely high HDL-C levels with respect to mortality outcomes.
Notably, participants with very high ApoA1 levels tended to have lower rates of some traditional cardiovascular risk factors. Participants in the highest decile of ApoA1 levels (1.91–2.5 g/L) were more likely to be female and White, with lower rates of diabetes mellitus and hypertension, as well as lower BMI and triglyceride levels and higher HDL-C levels. However, they were also older, with a higher prevalence of smoking and alcohol use, in addition to higher total cholesterol levels. Interestingly, while participants with very high ApoA1 levels demonstrated no difference in absolute mortality rates compared with those with the lowest risk, when adjusted for these variables, their all-cause and cardiovascular mortality risk were higher. Indeed, the seemingly ‘low-risk’ profile of participants with very elevated ApoA1 levels prior to adjustment may partly explain why decades of previous studies did not identify the U-shaped association between ApoA1 levels and mortality.8–16 While tobacco exposure is known to associate with lower HDL-C and ApoA1 levels,25,26 the relatively higher rates of smoking in the very high ApoA1 deciles, particularly in males, may in part be explained by the high degree of concordance between tobacco use and alcohol consumption.27
ApoA1 plays a central role in lipid metabolism as the primary acceptor of unesterified cholesterol from peripheral tissues.7 This action is part of the broader process of reverse cholesterol transport, which for decades has been regarded as a vital atheroprotective function of HDL-C. The clinical relevance of this atheroprotection was illustrated in the Framingham Heart Study, where low levels of HDL-C were a powerful predictor of adverse cardiovascular events.28 The mechanisms of how very high HDL-C, and as shown here, very high levels of ApoA1, are paradoxically associated with an increased mortality risk remain incompletely understood. One mechanism may be that, at elevated concentrations, molecular modifications to the ApoA1 protein in response to environmental stressors alter its function, thereby affecting HDL-C function (efflux capacity).1,29 Indeed, oxidative stress and inflammation can modify the ApoA1 protein, transforming its atheroprotective properties into proatherogenic properties. Damage to the ApoA1 molecule can create neo-epitopes that may be recognized by the immune system and generate ApoA1-specific antibodies known to induce atherosclerosis.30 The question of whether these conformational and functional changes occur at higher ApoA1 concentrations has not been examined. Consideration may also be given to the role of cholesterol ester transfer protein (CETP) in mediating the complex interplay between HDL-C, ApoA1, and atherogenesis, as there is recent evidence to suggest CETP mutations affect HDL-C, but not ApoA1 levels, in patients with acute myocardial infarction.31–33 Last, in light of recent in vitro data invoking reduced free cholesterol transfer to HDL-C after lipolysis of triglyceride-rich lipoproteins as a potential mechanism behind the U-shaped HDL-C risk profile,34 the role of ApoA1 in triglyceride metabolism warrants further attention. ApoA1 solubilizes the constituent particles of triglyceride-rich lipoproteins after lysis by lipoprotein lipase,35 and one may speculate that extremely high or low ApoA1 concentrations may dysregulate this physiologic process, thereby impairing HDL-mediated lipid metabolism.
The higher mortality rate with very elevated ApoA1 levels was more pronounced in men, although it was observed in both sexes. Recent sex-stratified analyses of HDL-C and mortality outcomes similarly show a higher risk of all-cause and cardiovascular death in men compared with women at very high HDL-C levels.6 Sex hormones are known to regulate lipid metabolism and impact cardiovascular health which may partly account for this differential risk.36
Additionally, very high ApoA1 levels were associated with elevated risk only in those with frequent alcohol use. In a similar manner to HDL-C and ApoA1, there is a well-known U-shaped relationship between alcohol consumption and mortality outcomes.37,38 Alcohol consumption increases synthesis and turnover of ApoA1 within hepatocytes thereby raising HDL-C levels,39–41 and there is in vitro evidence that alcohol can up-regulate ApoA1 gene expression.42 While it is possible that alcohol consumption is a driver of high ApoA1 levels, it is important to note that the elevated risk at very high ApoA1 levels persists even after adjustment for the graded frequency of alcohol consumption.
The strengths of this study include a large cohort of nearly half a million participants without known CAD at enrollment, longitudinal follow-up of 12 years, and reliable adjudication of the cause of death. We investigated a broad range of ApoA1 levels, judiciously adjusted for confounding risk factors, and explored the role of polygenic variation using a PGS calculated based on the recent large GWAS of ApoA1. Using a linear regression model, one SD increase in the PGS was associated with a 0.064 g/L increase in ApoA1 levels, which only accounted for 5.5% of the variance in ApoA1, and adding the PGS to the fully adjusted model did not attenuate the association between high ApoA1 levels and mortality. Although there is evidence of a significant link between ApoA1 polymorphisms and risk of CVD,43,44 the effect of very high ApoA1 levels on mortality risk appears to be largely driven by non-genomic factors.
Limitations of the study include the predominately White cohort that limits the generalizability of the findings to other races. While our multivariable model adjusted for traditional cardiovascular risk factors, there are non-traditional risk enhancers including socioeconomic status and chronic inflammatory conditions that were not accounted for in the analysis. Additionally, the collection of questionnaire-based data, including graded alcohol intake, may be impacted by response bias. Our study could not evaluate ApoA1 function, as such data are not available in the UKB. This will require further investigation, particularly in light of evidence that ApoA1 may switch from atheroprotective to proatherogenic in response to certain stressors.29,30 It will also be important to examine specific etiologies of cardiovascular death (e.g. atherosclerotic CVD, heart failure, arrhythmia, and stroke) in relation to ApoA1 levels. Finally, robust, prospective data will be critical to further characterize the impact of elevated ApoA1 levels on outcomes, and, whether high serum ApoA1 may be considered a potential target of therapy in the future.
Conclusion
In a large cohort of participants enrolled in the UKB, both very low and very high levels of serum ApoA1 were associated with elevated cardiovascular and all-cause mortality risk after adjustment for risk factors and genetic variation. The risk of all-cause mortality was greater in men compared with women, in hypertensives, smokers, and those with greater alcohol intake compared with those without these risk factors. The higher cardiovascular mortality in the high ApoA1 sub-group was more pronounced in those with heavier alcohol consumption. Further study of potential mechanisms, including those relating to ApoA1 function, is warranted.
Author contributions
C.C.F., V.S., and A.A.Q. contributed to the conception and design of the work. C.L. conducted the statistical analysis. C.C.F., V.S., and A.A.Q. contributed to the acquisition and interpretation of data. C.C.F. drafted the manuscript. C.C.F., Y.V.S., S.R.D., P.W.F.W., L.S.S., and A.A.Q. critically revised the manuscript. A.A.Q. was responsible for project funding. All authors gave final approval and agree to be accountable for all aspects of work ensuring integrity and accuracy.
Supplementary material
Supplementary material is available at European Journal of Preventive Cardiology online.
Funding
A.A.Q. has been supported by National Institutes of Health grants 4R61HL138657–04, U54AG062334-01, 1P30DK111024-03S1, 15SFCRN23910003, 5P01HL086773-09, 1R01HL141205-01, 5P01HL101398-05, 1P20HL113451-04, 3RF1AG051633-01S2 and American Heart Association grant 15SFCRN23910003.
Data availability
The following research was conducted using data from the UK Biobank Resource under application number 34031. The UK Biobank will make the data available to all bona fide researchers for all types of health-related research that is in the public interest, without preferential or exclusive access for any persons. All researchers will be subject to the same application process and approval criteria as specified by UK Biobank. For more details on the access procedure, see the UK Biobank website: www.ukbiobank.ac.uk.
References
Ko DT, Alter DA, Guo H, Koh M, Lau G, Austin PC, Booth GL, Hogg W, Jackevicius CA, Lee DS, Wijeysundera HC, Wilkins JT.
Welsh C, Celis-Morales CA, Brown R, Mackay DF, Lewsey J, Mark PB, Gray SR, Ferguson LD, Anderson JJ, Lyall DM, Cleland JG, Jhund PS, Gill JMR, Pell JP, Sattar N, Welsh P.
van der Steeg WA, Holme I, Boekholdt SM, Larsen ML, Lindahl C, Stroes ES, Tikkanen MJ, Wareham NJ, Faergeman O, Olsson AG, Pedersen TR, Khaw KT, Kastelein JJP.
Luc G, Bard JM, Ferrières J, Evans A, Amouyel P, Arveiler D, Fruchart JC, Ducimetière P.
Sharrett AR, Ballantyne CM, Coady SA, Heiss G, Sorlie PD, Catellier D, Patsch W.
van Capelleveen JC, Bochem AE, Boekholdt SM, Mora S, Hoogeveen RC, Ballantyne CM, Ridker PM, Sun W, Barter PJ, Tall AR, Zwinderman AH, Kastelein JJP, Wareham NJ, Khaw KT, Hovingh GK.
Sudlow C, Gallacher J, Allen N, Beral V, Burton P, Danesh J, Downey P, Elliott P, Green J, Landray M, Liu B, Matthews P, Ong G, Pell J, Silman A, Young A, Sprosen T, Peakman T, Collins R.
Sinnott-Armstrong N, Tanigawa Y, Amar D, Mars N, Benner C, Aguirre M, Venkataraman GR, Wainberg M, Ollila HM, Kiiskinen T, Havulinna AS, Pirruccello JP, Qian J, Shcherbina A, FinnGen, Rodriguez F, Assimes TL, Agarwala V, Tibshirani R, Hastie T, Ripatti S, Pritchard JK, Daly MJ, Rivas MA.
Bycroft C, Freeman C, Petkova D, Band G, Elliott LT, Sharp K, Motyer A, Vukcevic D, Delaneau O, O'Connell J, Cortes A, Welsh S, McVean G, Leslie S, Donnelly P, Marchini J.
Daeppen JB, Smith TL, Danko GP, Gordon L, Landi NA, Nurnberger JI, Jr., Bucholz KK, Raimo E, Schuckit MA.
Colombo GI, Bianconi V, Bonomi A, Simonelli S, Amato M, Frigerio B, Ravani A, Vitali C, Sansaro D, Coggi D, Mannarino MR, Savonen KP, Kurl S, Gigante B, Smit AJ, Giral P, Tremoli E, Calabresi L, Veglia F, Pirro M, Baldassarre D, On Behalf Of The Improve Study Group.
Feng M, Darabi M, Tubeuf E, Canicio A, Lhomme M, Frisdal E, Lanfranchi-Lebreton S, Matheron L, Rached F, Ponnaiah M, Serrano CV Jr, Santos RD, Brites F, Bolbach G, Gautier E, Huby T, Carrie A, Bruckert E, Guerin M, Couvert P, Giral P, Lesnik P, Le Goff W, Guillas I, Kontush A.
Xu LB, Zhou YF, Yao JL, Sun SJ, Rui Q, Yang XJ, Li XB.
Author notes
Both the authors contributed equally and are to be considered co-authors.
Conflict of interest: None declared.

Comments