


Abstract
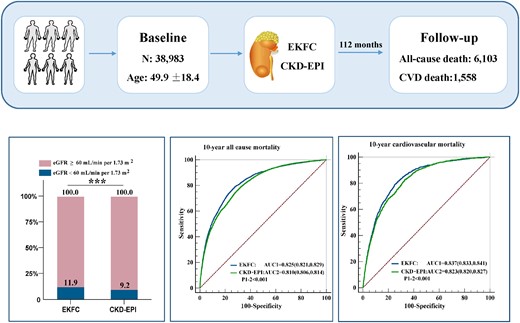
A recent study demonstrated that the new modified estimated glomerular filtration rate (eGFR) equation proposed by the European Kidney Function Consortium (EKFC) was more accurate and precise than the Chronic Kidney Disease Epidemiology Collaboration (CKD-EPI) equation. This study aimed to compare the prognostic values of these two creatinine-based equations with regard to all-cause and cardiovascular mortality in general non-Black population.
A population-based cohort study was conducted using data from the National Health and Nutrition Examination Survey database from 1999 to 2018, and 38 983 non-Black individuals aged 20 years or older without a history of dialysis were enrolled. Among 38 983 participants, 6103 deaths occurred after a median follow-up duration of 112 months, of which 1558 deaths were due to cardiovascular causes. There were U-shaped relations between the eGFR values and the risk of all-cause and cardiovascular mortality. The areas under the curves for the EKFC were significantly higher than those for the CKD-EPI equation for all-cause and cardiovascular mortality. The integrated discrimination improvement for the EKFC equation compared with the CKD-EPI equation was 2.40% and 1.26% for 10-year all-cause and cardiovascular mortality; the net reclassification improvement for the EKFC equation compared with the CKD-EPI equation was 8.67% and 11.13% for 10-year all-cause mortality and cardiovascular mortality.
Creatinine-based EKFC equation outperformed the CKD-EPI equation for the prediction of long-term all-cause and cardiovascular mortality in the general non-Black population.
Lay Summary
This study compared the prognostic values of two creatinine-based equations [European Kidney Function Consortium (EKFC) and Chronic Kidney Disease Epidemiology Collaboration CKD-EPI)] with regard to all-cause and cardiovascular mortality in general non-Black population.
This study confirmed U-shaped relations between estimated glomerular filtration rate values calculated with the EKFC and the CKD-EPI equation and the risk of all-cause and cardiovascular mortality.
The EKFC equation outperformed the CKD-EPI equation for the prediction of long-term all-cause and cardiovascular mortality in general non-Black population.
See the editorial comment for this article ‘Glomerular filtration rate estimation and all—cause and cardiovascular mortality risk prediction: a progressive refinement in accuracy’, by N. Cosentino et al., https://doi.org/10.1093/eurjpc/zwad206.
Introduction
Chronic kidney disease (CKD), defined as decreased kidney function [estimated glomerular filtration rate (eGFR) < 60 mL/min per 1.73 m2] or kidney damage for at least 3 months, is becoming a worldwide health concern with high morbidity and mortality.1 In 2017, the reported global prevalence of CKD was 9.1%, with CKD stages 1–3 accounting for ∼8.9%.2 Deaths attributable to impaired kidney function represented 4.6% of total deaths in 2017.2 Patients with decreased kidney function are at increased risk for all-cause and cardiovascular mortality.3
The GFR is generally accepted as the best indicator of kidney function, and its measurement by urinary or plasma clearance of exogenous markers is considered the gold standard. However, given the high-cost and complicated procedure, this measurement is not suitable for widespread application in clinical practice. Thus, serum creatinine (Scr)-based equations for calculating the eGFR are commonly used as surrogate measures for the GFR. The Chronic Kidney Disease Epidemiology Collaboration (CKD-EPI) creatinine equation was recommended by The Kidney Disease: Improving Global Outcomes (KDIGO) guidelines for the assessment of kidney function and has been extensively validated and used in practice.4 However, the CKD-EPI equation may overestimate the GFR in young adults and has a larger bias than the Modification of Diet in Renal Disease (MDRD) equation at lower eGFR values.5–7
Recently, a new modified creatinine-based equation appropriate for the full age spectrum was developed by the European Kidney Function Consortium (EKFC). The EKFC equation was developed and validated in White populations and was more accurate and precise than the traditionally recommended CKD-EPI equation for the calculation of the eGFR from Scr levels.8 However, whether the EKFC equation is superior to the CKD-EPI equation for risk prediction is still unknown. Therefore, our study aimed to compare the prognostic values of these two creatinine-based equations with regard to all-cause and cardiovascular mortality in general non-Black population.
Methods
Study design
This study analysed publicly available data from the National Health and Nutrition Examination Survey (NHANES) in 1999–2018 (http://wwwn.cdc.gov/nchs/nhanes). National Health and Nutrition Examination Survey is a program of studies designed to assess the health and nutritional status of the US population. NHANES collects data from a nationally representative sample of ∼10 000 people in each 2-year cycle, and all the participants are invited to undertake household interviews, physical examinations, and biological specimen collections in the mobile centre. Data for Scr were available for 63 970 participants. After excluding patients younger than 20 years old (n = 14 955), on dialysis (n = 138), of Black ethnicity (n = 9823) or with missing data on follow-up (n = 71), data from 38 983 participants were analysed (Figure 1).
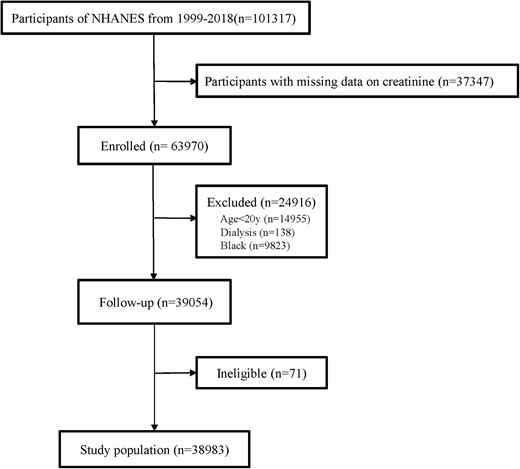
Study flow chart. NHANES, National Health and Nutrition Examination Survey.
Assessment of serum creatinine and the estimated glomerular filtration rate
In NHANES 1999–2002, Scr was measured using a Hitachi Model 917 multichannel analyser (Roche Diagnostics, Indianapolis, IN, USA), and that in NHANES 2003–2007 was measured with a Beckman Synchron LX20 chemistry analyser. Starting from 2008 to 2016, Scr was analysed using the Beckman Coulter UniCel® DxC800 Synchron Clinical System. During 2017–18, Scr was measured with Roche Cat. No. 03263991190, CREP2 reagent kit. Serum creatinine values from NHANES 1999–2000 and 2005–06 were standardized according to the NHANES document, whereas no correction was needed for Scr values from NHANES 2001–2004 and 2007–18 (see Supplementary material online, Table S1). The eGFR was calculated by the CKD-EPI creatinine equation and the EKFC equation (see Supplementary material online, Tables S2 and Table S3).
Assessment of covariates
Age, sex, education level (less than 9th grade, 9th–11th grade, high school, college, and graduate), ethnicity (Mexican American, other Hispanic, non-Hispanic White, and other race), smoker (smoked at least 100 cigarettes in life or not), alcohol user (at least 12 alcoholic drinks per year or not), diabetes mellitus (yes or no), hypertension (yes or no), coronary heart disease (yes or no), congestive heart failure (yes or no), stroke (yes or no), cancer (yes or no), emphysema/chronic bronchitis (yes or no), and cardiovascular prescription medications (angiotensin-converting enzyme inhibitors/angiotension II receptor blockers/beta-blockers/calcium channel blockers/diuretics/statins/aspirin) were self-reported. Body mass index (BMI) was calculated as weight (kg)/height squared (m2). Systolic blood pressure (SBP) and diastolic blood pressure (DBP) were measured using mercury sphygmomanometers by trained examiners.
Endpoints and follow-up
The primary endpoint was all-cause mortality, and the secondary endpoint was cardiovascular mortality during the follow up until 31 December 2019. Survival time was calculated using person months from the date of interview to the date of death or the end of the follow-up period.
Statistical analysis
Participants were divided into two groups according to survival status. Continuous variables are presented as the mean (standard deviation) and were compared using Student’s t-test. Categorical variables are presented as the frequency (percentage) and were compared using the chi-square test. The eGFR values calculated by the EKFC equation and the CKD-EPI equation were compared using a paired t-test. Kaplan–Meier survival curves were used to compare all-cause and cardiovascular mortality between groups. Univariate and multivariate Cox regression analyses were performed to examine the associations between the eGFR and all-cause and cardiovascular mortality. Variables with a P value < 0.05 in univariate analysis were further incorporated into multivariable adjusted models (Model 1: adjusted for age and sex; Model 2: adjusted for age, sex, ethnicity, education level, diabetes mellitus, smoker, alcohol user, SBP, DBP, BMI, coronary heart disease, congestive heart failure, stroke, cancer, emphysema/chronic bronchitis, ACEI/ARB, beta-blockers, CCBs, diuretics, statins, and aspirin). Restricted cubic spline (RCS) models were fitted to further examine the possibly non-linear relationship between eGFR and the risk of all-cause and cardiovascular mortality. Receiver operator characteristic (ROC) curves and the area under the curve (AUC) were used to assess the predictive value of the different eGFR equations. Overall improvements in 5-year and 10-year all-cause and cardiovascular mortality were evaluated using net reclassification improvement (NRI) and integrated discrimination improvement (IDI) values. All statistical analyses were consistent with analytic guidelines of NHANES (https://wwwn.cdc.gov/nchs/nhanes/analyticguidelines.aspx) and conducted in R software (version 4.2.1; The R Foundation for Statistical Computing). A two-sided P value < 0.05 was considered statistically significant.
Results
Baseline characteristics
A total of 38 983 participants with a mean age of 49.9 years were included. During a median follow-up time of 112 months (interquartile range, 61–170 months), 6103 (15.7%) participants died, of which 1558 (4.0%) deaths were due to cardiovascular causes. The baseline characteristics of the study population are presented in Table 1. The mean values and standard deviation of the eGFR values calculated by the two equations were 87.5 ± 21.5 mL/min per 1.73 m2 for the EKFC equation and 93.0 ± 23.3 mL/min per 1.73 m2 for the CKD-EPI equation, and there was a significant difference between the two eGFR values (Figure 2A). The prevalence of CKD significantly differed according to the use of the two equations: 11.9% based on the EKFC equation and 9.2% based on the CKD-EPI equation (Figure 2B).

Comparison of estimated glomerular filtration rate calculated with the European Kidney Function Consortium and Chronic Kidney Disease Epidemiology Collaboration equations (*** represents P < 0.001). (A), Raincloud plots of eGFR values calculated with the two equations. (B), Barplots of prevalence of CKD by using the two equations. CKD-EPI, Chronic Kidney Disease Epidemiology Collaboration; eGFR, estimated glomerular filtration rate; EKFC, European Kidney Function Consortium.
Characteristics of the study population
| Variable | All | Death | Survival | P value |
|---|---|---|---|---|
| (n = 38 983) | (n = 6103) | (n = 32 880) | ||
| Age, years | 49.9 (18.4) | 70.4 (13.1) | 46.1 (16.7) | <0.001 |
| Male, % | 20 141 (51.7) | 2706 (44.3) | 17 435 (53.0) | <0.001 |
| Education level, % | <0.001 | |||
| <9th grade | 5401 (13.9) | 1320 (21.6) | 4081 (12.4) | |
| 9–11th grade | 5278 (13.5) | 991 (16.2) | 4287 (13.0) | |
| High school | 8785 (22.5) | 1541 (25.2) | 7244 (22.0) | |
| College | 10 614 (27.2) | 1372 (22.5) | 9242 (28.1) | |
| Graduate | 8905 (22.8) | 879 (14.4) | 8026 (24.4) | |
| Race/ethnicity, % | <0.001 | |||
| Mexican American | 8678 (22.3) | 977 (16.0) | 7701 (23.4) | |
| Other Hispanic | 4033 (10.3) | 314 (5.1) | 3719 (11.3) | |
| Non-Hispanic White | 21 815 (56.0) | 4562 (74.8) | 17 253 (52.5) | |
| Other race | 4457 (11.4) | 250 (4.1) | 4207 (12.8) | |
| Smoker, % | 16 015 (46.5) | 3504 (58.4) | 12 511 (44.0) | <0.001 |
| Alcohol user, % | 25 580 (73.0) | 3654 (64.8) | 21 926 (74.6) | <0.001 |
| Diabetes mellitus, % | 4352 (11.2) | 1282 (21.0) | 3070 (9.3) | <0.001 |
| Hypertension, % | 12 524 (32.2) | 3386 (55.6) | 9138 (27.9) | <0.001 |
| Systolic BP, mmHg | 124.6 (19.6) | 138.5 (24.2) | 122.1 (17.6) | <0.001 |
| Diastolic BP, mmHg | 70.1 (13.1) | 67.0 (16.6) | 70.6 (12.3) | <0.001 |
| Body mass index, kg/m2 | 28.6 (6.4) | 28.2 (6.1) | 28.7 (6.5) | <0.001 |
| HDL, mg/dL | 52.3 (15.8) | 52.0 (16.7) | 52.3 (15.7) | 0.079 |
| LDL, mg/dL | 116.0 (35.8) | 114.1 (38.3) | 116.4 (35.3) | 0.002 |
| Creatinine, umol/L | 76.6 (25.0) | 91.1 (37.5) | 73.9 (20.8) | <0.001 |
| EKFC eGFR, mL/min per 1.73 m2 | 87.5 (21.5) | 65.7 (20.9) | 91.5 (19.1) | <0.001 |
| CKD-EPI eGFR, mL/min per 1.73 m2 | 93.0 (23.3) | 71.1 (22.2) | 97.0 (21.2) | <0.001 |
| Comorbid illness, % | ||||
| Coronary heart disease | 1773 (4.5) | 837 (13.7) | 936 (2.8) | <0.001 |
| Congestive heart failure | 1203 (3.1) | 679 (11.1) | 524 (1.6) | <0.001 |
| Stroke | 1361 (3.5) | 682 (11.2) | 679 (2.1) | <0.001 |
| Cancer | 3839 (9.8) | 1353 (22.2) | 2486 (7.6) | <0.001 |
| Emphysema/chronic bronchitis | 2844 (7.3) | 867 (14.2) | 1977 (6.0) | <0.001 |
| Prescription Medications,% | ||||
| ACEI/ARB | 2394 (6.1) | 653 (10.7) | 1741 (5.3) | <0.001 |
| Beta-blockers | 4673 (12.0) | 1707 (28.0) | 2966 (9.0) | <0.001 |
| CCBs | 2924 (7.5) | 1178 (19.3) | 1746 (5.3) | <0.001 |
| Diuretics | 4184 (10.7) | 1555 (25.5) | 2629 (8.0) | <0.001 |
| Statins | 6519 (16.7) | 1846 (30.2) | 4673 (14.2) | <0.001 |
| Aspirin | 487 (1.2) | 190 (3.1) | 297 (0.9) | <0.001 |
Data are presented as mean (SD) or n (%).
ACEI, angiotensin-converting enzyme inhibitors; ARB, angiotension II receptor blockers; CCB, calcium channel blockers; CKD-EPI, Chronic Kidney Disease Epidemiology Collaboration; eGFR, estimated glomerular filtration rate; EKFC, European Kidney Function Consortium; HDL, high-density lipoprotein; LDL, low-density lipoprotein.
Association between estimated glomerular filtration rate and mortality
The Kaplan–Meier survival curves revealed that there were stepwise increases in all-cause mortality and cardiovascular mortality with a decreasing eGFR estimated by the two equations, and the difference between groups was statistically significant (log-rank P < 0.001; Figure 3).
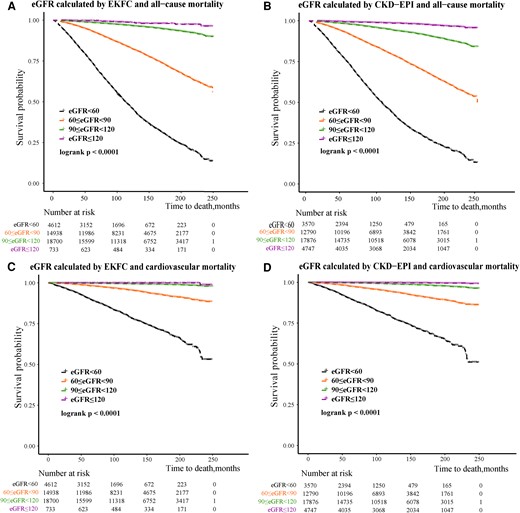
Kaplan–Meier survival analysis of all-cause and cardiovascular mortality. (A, C) According to the estimated glomerular filtration rate categories calculated with the European Kidney Function Consortium equation. (B, D) According to the estimated glomerular filtration rate categories calculated with the Chronic Kidney Disease Epidemiology Collaboration equation. CKD-EPI, Chronic Kidney Disease Epidemiology Collaboration; eGFR, estimated glomerular filtration rate; EKFC, European Kidney Function Consortium.
Univariate and multivariate Cox regression analyses were performed to examine the associations between the eGFR and all-cause and cardiovascular mortality (Tables 2 and 3). When calculating the eGFR with the EKFC equation, after full adjustment for age, sex, ethnicity, education level, diabetes mellitus, smoking, alcohol use, SBP, DBP, BMI, coronary heart disease, congestive heart failure, stroke, cancer, emphysema/chronic bronchitis, ACEI/ARB, beta-blockers, CCBs, diuretics, statins, and aspirin use, the risk of all-cause mortality was higher in the groups with eGFR < 60 mL/min per 1.73 m2 [hazard ratio (HR): 1.21, 95% confidence interval (CI): 1.13–1.30] and 90 ≤ eGFR < 120 mL/min per 1.73 m2 (HR: 1.28, 95% CI: 1.14–1.44) than that in those with 60 ≤ eGFR < 90 mL/min per 1.73 m2 as the reference group. The risk of cardiovascular mortality was higher in the group with eGFR < 60 mL/min per 1.73 m2 (HR: 1.26, 95% CI: 1.11–1.45) and 90 ≤ eGFR < 120 mL/min per 1.73 m2 (HR: 1.33, 95% CI: 1.03–1.73) than that in the reference group. When calculating the eGFR by the CKD-EPI equation, after extensive adjustment as above, compared with the group with 60 ≤ GFR < 90 mL/min per 1.73 m2, the risk of all-cause mortality was higher in the groups with eGFR < 60 mL/min per 1.73 m2 (HR: 1.27, 95% CI: 1.18–1.36), 90 ≤ eGFR < 120 mL/min per 1.73 m2 (HR: 1.16, 95% CI: 1.06–1.27), and eGFR ≥ 120 mL/min per 1.73 m2 (HR: 2.21, 95% CI: 1.68–2.92), and the risk of cardiovascular mortality was higher in the group with eGFR < 60 mL/min per 1.73 m2 (HR: 1.26, 95% CI: 1.10–1.44) and eGFR ≥ 120 mL/min per 1.73 m2 (HR: 3.17, 95% CI: 1.66–6.06).
Univariate COX regression analysis for the prediction of all-cause mortality and cardiovascular mortality
| All-cause mortality | Cardiovascular mortality | |||
|---|---|---|---|---|
| HR (95% CI) | P valve | HR (95% CI) | P valve | |
| Age | 1.10 (1.10–1.10) | <0.001 | 1.12 (1.11–1.13) | <0.001 |
| Male | 0.71 (0.67–0.74) | <0.001 | 0.64 (0.58–0.71) | <0.001 |
| Education level | <0.001 | <0.001 | ||
| <9th grade | 1 (ref.) | 1 (ref.) | ||
| 9–11th grade | 0.77 (0.71–0.83) | 0.78 (0.66–0.92) | ||
| High school | 0.73 (0.67–0.78) | 0.69 (0.60–0.80) | ||
| College | 0.56 (0.52–0.60) | 0.54 (0.47–0.63) | ||
| Graduate | 0.43 (0.39–0.46) | 0.43 (0.36–0.50) | ||
| Race/ethnicity | <0.001 | <0.001 | ||
| Mexican American | 1 (ref.) | 1 (ref.) | ||
| Other Hispanic | 0.91 (0.81–1.04) | 0.86 (0.65–1.12) | ||
| Non-Hispanic White | 2.08 (1.94–2.22) | 2.32 (2.02–2.68) | ||
| Other race | 0.85 (0.74–0.97) | 0.68 (0.50–0.92) | ||
| Smoker | 1.62 (1.54–1.71) | <0.001 | 1.39 (1.26–1.54) | <0.001 |
| Alcohol user | 0.71 (0.67–0.75) | <0.001 | 0.63 (0.57–0.70) | 0.001 |
| Diabetes mellitus | 2.85 (2.68–3.03) | <0.001 | 3.36 (2.99–3.78) | <0.001 |
| Hypertension | 3.24 (3.09–3.41) | <0.001 | 3.96 (3.57–4.38) | <0.001 |
| Systolic BP | 1.03 (1.03–1.03) | <0.001 | 1.03 (1.03–1.04) | <0.001 |
| Diastolic BP | 0.98 (0.98–0.98) | <0.001 | 0.98 (0.97–0.99) | <0.001 |
| Body mass index | 0.99 (0.98–0.99) | 0.008 | 1.01 (1.00–1.02) | 0.084 |
| HDL | 0.99 (0.99–1.00) | 0.151 | 0.99 (0.99–0.99) | <0.001 |
| LDL | 0.99 (0.99–0.99) | <0.001 | 0.99 (0.99–0.99) | 0.022 |
| Creatinine | 1.01 (1.01–1.01) | <0.001 | 1.01 (1.01–1.01) | <0.001 |
| EKFC eGFR | ||||
| eGFR ≥ 120 | 0.40 (0.21–0.65) | <0.001 | 0.18 (0.02–1.25) | 0.083 |
| 90 ≤ eGFR < 120 | 1 (ref.) | 1 (ref.) | ||
| 60 ≤ eGFR < 90 | 5.47 (5.04–5.93) | <0.001 | 7.32 (6.07–8.84) | <0.001 |
| eGFR < 60 | 21.65 (19.93–23.53) | <0.001 | 37.31 (30.91–45.03) | <0.001 |
| CKD-EPI eGFR | ||||
| eGFR ≥ 120 | 0.26 (0.21–0.32) | <0.001 | 0.20(0.12–0.35) | <0.001 |
| 90 ≤ eGFR < 120 | 1 (ref.) | 1 (ref.) | ||
| 60 ≤ eGFR < 90 | 3.97 (3.70–4.25) | <0.001 | 5.26 (4.52–6.12) | <0.001 |
| eGFR < 60 | 13.74 (12.76–14.79) | <0.001 | 21.52 (18.38–25.18) | <0.001 |
| Comorbid illness | ||||
| Coronary heart disease | 4.66 (4.33–5.01) | <0.001 | 6.94 (6.11–7.87) | <0.001 |
| Congestive heart failure | 6.56 (6.06–7.11) | <0.001 | 10.29 (8.99–11.78) | <0.001 |
| Stroke | 5.33 (4.92–5.77) | <0.001 | 6.34 (5.47–7.35) | <0.001 |
| Cancer | 3.38 (3.18–3.59) | <0.001 | 2.76 (2.44–3.14) | <0.001 |
| Emphysema/chronic bronchitis | 2.40 (2.23–2.58) | <0.001 | 2.47 (2.15–2.85) | <0.001 |
| Prescription Medications | ||||
| ACEI/ARB | 2.56 (2.36–2.77) | <0.001 | 2.59 (2.19–3.02) | <0.001 |
| Beta-blockers | 3.85 (3.64–4.08) | <0.001 | 5.41 (4.88–6.01) | <0.001 |
| CCBs | 3.85 (3.61–4.10) | <0.001 | 4.95 (4.41–5.57) | <0.001 |
| Diuretics | 3.73 (3.52–3.95) | <0.001 | 5.39 (4.85–5.99) | <0.001 |
| Statins | 2.96 (2.81–3.13) | <0.001 | 3.38 (3.04–3.76) | <0.001 |
| Aspirin | 3.18 (2.75–3.68) | <0.001 | 3.59 (2.74–4.70) | <0.001 |
ACEI, angiotensin-converting enzyme inhibitors; ARB, angiotension II receptor blockers; CCB, calcium channel blockers; CI, confidence interval; CKD-EPI, Chronic Kidney Disease Epidemiology Collaboration; eGFR, estimated glomerular filtration rate; EKFC, European Kidney Function Consortium; HDL, high-density lipoprotein; HR, hazard ratio; LDL, low-density lipoprotein.
Multivariate COX regression analysis for the prediction of all-cause mortality and cardiovascular mortality
| eGFR (EKFC equation) | eGFR (CKD-EPI equation) | ||
|---|---|---|---|
| HR (95% CI) | HR (95% CI) | ||
| All-cause mortality | |||
| Model 1 | ≥120 | 1.67 (0.94–2.98) | 2.24 (1.76–2.85)*** |
| ≥90, <120 | 1.28 (1.15–1.42) *** | 1.10 (1.02–1.19) * | |
| ≥60, <90 | 1 (ref.) | 1 (ref.) | |
| <60 | 1.47 (1.38–1.56)*** | 1.53 (1.44–1.62)*** | |
| Model 2 | ≥120 | 1.64 (0.84–3.19) | 2.21 (1.68–2.92)*** |
| ≥90, <120 | 1.28 (1.14–1.44) *** | 1.16 (1.06–1.27) ** | |
| ≥60, <90 | 1 (ref.) | 1 (ref.) | |
| <60 | 1.21 (1.13–1.30)*** | 1.27 (1.18–1.36)*** | |
| Cardiovascular mortality | |||
| Model 1 | ≥120 | 1.01 (0.14–7.30) | 2.38 (1.30–4.35) ** |
| ≥90, <120 | 1.26 (1.01–1.59) * | 1.02 (0.86–1.21) | |
| ≥60, <90 | 1 (ref.) | 1 (ref.) | |
| <60 | 1.73 (1.54–1.94) *** | 1.69 (1.51–1.89)*** | |
| Model 2 | ≥120 | 1.48 (0.20–10.83) | 3.17 (1.66–6.06)*** |
| ≥90, <120 | 1.33 (1.03–1.73) * | 1.14 (0.93–1.38) | |
| ≥60, <90 | 1 (ref.) | 1 (ref.) | |
| <60 | 1.26 (1.11–1.45)*** | 1.26 (1.10–1.44)*** |
Model 1: adjusted for age and sex.
Model 2: adjusted for age, sex, ethnicity, education level, diabetes mellitus, smoker, alcohol user, systolic BP, diastolic BP, BMI, coronary heart disease, congestive heart failure, stroke, cancer, emphysema/chronic bronchitis, ACEI/ARB, beta-blockers, CCBs, diuretics, statins, and aspirin.
CI, confidence interval; CKD-EPI, Chronic Kidney Disease Epidemiology Collaboration; eGFR, estimated glomerular filtration rate; EKFC, European Kidney Function Consortium; HDL, high-density lipoprotein; HR, hazard ratio; LDL, low-density lipoprotein. * represents P < 0.05, ** represents P < 0.01, *** represents P < 0.001.
Furthermore, results of RCS regression found non-linear, U-shaped associations between the eGFR calculated by the EKFC and the CKD-EPI equations with adjusted all-cause and cardiovascular mortality, suggesting that both glomerular hyperfiltration and hypofiltration may increase the risk of all-cause and cardiovascular mortality (all P for non-linearity < 0.001; Figure 4).
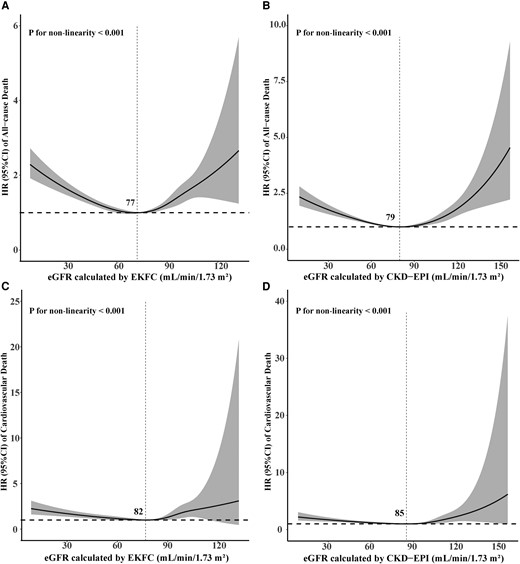
Fully adjusted restricted cubic spline curves of hazard ratio (with 95% confidence interval limits) of all-cause and cardiovascular mortality associated with the estimated glomerular filtration rate calculated by the European Kidney Function Consortium equation (A, C) and the Chronic Kidney Disease Epidemiology Collaboration equation (B, D). CI, confidence interval; CKD-EPI, Chronic Kidney Disease Epidemiology Collaboration; eGFR, estimated glomerular filtration rate; EKFC, European Kidney Function Consortium; HR, hazard ratio.
Prediction
The prognostic value of the eGFR calculated by the EKFC and the CKD-EPI equations was assessed by ROC curve analysis and the AUC. The AUCs for the eGFR calculated by the EKFC equation were significantly higher than those for the eGFR calculated by the CKD-EPI equation for 5-year all-cause mortality (0.816 vs. 0.802, P < 0.001), 5-year cardiovascular mortality (0.847 vs. 0.834, P < 0.001), 10-year all-cause mortality (0.825 vs. 0.810, P < 0.001), and 10-year cardiovascular mortality (0.837 vs. 0.823, P < 0.001), indicating that the eGFR calculated by the EKFC equation had better specificity and sensitivity with regard to mortality stratification (Figure 5). Besides, both formulas perform better for cardiovascular mortality than all-cause mortality.
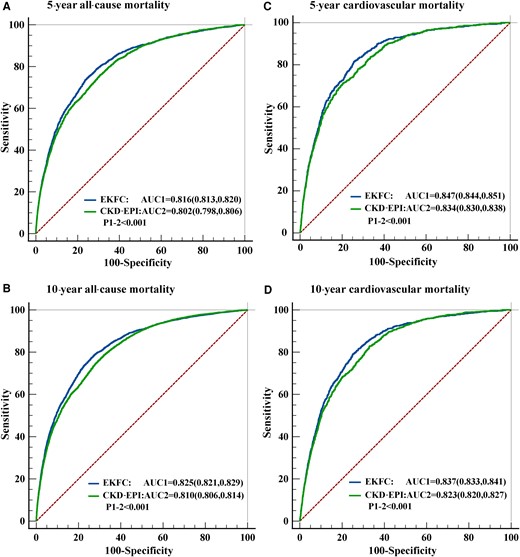
Receiver operator characteristic curve analysis for the prediction of 5-year all-cause mortality (A), 10-year all-cause mortality (B), 5-year cardiovascular mortality (C) and 10-year cardiovascular mortality (D). AUC, areas under the curve; CKD-EPI, Chronic Kidney Disease Epidemiology Collaboration; EKFC, European Kidney Function Consortium.
Reclassification
Comparing the eGFR calculated with the EKFC equation with that calculated with the CKD-EPI equation, the reclassification of participants showed IDI values of 1.28% (95% CI: 1.19–1.35, P < 0.001) and 2.40% (95% CI: 2.27–2.52, P < 0.001) according to the probability of all-cause mortality at 5 and 10 years and IDI values of 0.56% (95% CI: 0.46–0.64, P < 0.001) and 1.26% (95% CI: 1.11–1.37, P < 0.001) according to the probability of cardiovascular mortality at 5 and 10 years, respectively. Reclassification using NRI also highly significantly favoured the eGFR calculated by the EKFC equation for all-cause mortality (NRI of 7.60%, 95% CI: 6.42–9.51, P < 0.001 and 8.67%, 95% CI: 7.83–9.59, P < 0.001 for 5- and 10-year all-cause mortality, respectively) and cardiovascular mortality (NRI of 7.32%, 95% CI: 4.00–9.54, P < 0.001 and 11.13%, 95%CI: 8.91–12.82, P < 0.001 for 5- and 10-year cardiovascular mortality, respectively) (Table 4).
Integrated discrimination improvement and net reclassification improvement by comparing estimated glomerular filtration rate estimated by European Kidney Function Consortium to estimated glomerular filtration rate estimated by Chronic Kidney Disease Epidemiology Collaboration equation
| Integrated discrimination improvement | Net reclassification improvement | |||||
|---|---|---|---|---|---|---|
| IDI (%) | CI (95%) | P | NRI (%) | CI (95%) | P | |
| All-cause mortality | ||||||
| 5 years | 1.28 | 1.19–1.35 | <0.001 | 7.60 | 6.42–9.51 | <0.001 |
| 10 years | 2.40 | 2.27–2.52 | <0.001 | 8.67 | 7.83–9.59 | <0.001 |
| Cardiovascular mortality | ||||||
| 5 years | 0.56 | 0.46–0.64 | <0.001 | 7.32 | 4.00–9.54 | <0.001 |
| 10 years | 1.26 | 1.11–1.37 | <0.001 | 11.13 | 8.91–12.82 | <0.001 |
CI, confidence interval; IDI, integrated discrimination improvement; NRI, net reclassification improvement.
Discussion
This is the first prospective large cohort study to evaluate the association between the eGFR calculated by the EKFC equation with all-cause and cardiovascular mortality in general population. There were U-shaped relations between the eGFR values calculated by the EKFC and CKD-EPI equations and the risk of all-cause and cardiovascular mortality after full adjustment for other risk factors. The eGFR calculated with the EKFC equation provides better reclassification than that calculated with the CKD-EPI equation for the risk of all-cause and cardiovascular mortality in general non-Black population. Besides, both formulas perform better for cardiovascular mortality than all-cause mortality.
Interest in analysing the association between the eGFR and risk of mortality in the general population has grown over the past few decades. Our findings add information of interest to the current literature on this topic. The CKD-EPI equation and the MDRD study equation have been widely accepted and recommended for the assessment of renal function.9,10 Matsushita et al.11 analysed data from 1.1 million adults from 25 general population cohorts, 7 high-risk cohorts (of vascular disease), and 13 CKD cohorts and concluded that the CKD-EPI creatinine-based equation classified fewer individuals as having CKD and had better risk predictive value than the MDRD equation. Similar findings in other settings were also reported by the Australian Diabetes, Obesity and Lifestyle (AusDiab) Study, the Atherosclerosis Risk in Communities (ARIC) Study, and the Kidney Early Evaluation Program (KEEP).12–14 The CKD-EPI equation using cystatin C has been proposed as a potentially more accurate method of renal function assessment.15,16 However, there were controversial results regarding the risk assessment performance in previous studies. A study by Lees et al.17 revealed that serum cystatin C-based calculations of the eGFR provided more accurate predictions of all-cause mortality and fatal/nonfatal CVD. Conversely, a cohort study conducted by Shardlow et al.18 showed that the eGFR based on cystatin C did not improve risk discrimination for all-cause mortality in an older population in primary care compared with the eGFR calculated with the CKD-EPI creatinine-based equation.
Our study was the first to investigate the risk predictive value of the eGFR calculated with the EKFC equation in general population. In our study, the two eGFR values calculated with the different equations were both shown to be independent predictors of all-cause and cardiovascular mortality, and both equations perform better for cardiovascular mortality. This may be because patients with lower eGFR tend to have more cardiovascular comorbidities and may not receive optimal cardiovascular therapeutics due to limitation of kidney function.19 However, eGFR calculated with the EKFC equation provided better risk categorization than the CKD-EPI equation. The EKFC equation and the CKD-EPI equation assess renal function using identical variables; thus, the improvement in outcome prediction may not be as large as it would be when adding a new biomarker. However, given the more accurate GFR estimation and easy implementation without any additional laboratory cost, even a small improvement in risk stratification would support the application of the EKFC equation in clinical practice.
Consistent with another study carried out in an Italian population,20 our data indicated that the EKFC yielded lower eGFR values than the CKD-EPI equation. The use of the EKFC equation identified a significantly higher proportion of participants with an eGFR < 60 mL/min per 1.73 m2. Participants who were reclassified downward were at increased risk and may benefit from more active interventions.
We acknowledge some limitations in our study. First, the measurement of Scr was performed by different instruments in the NHANES survey periods of 1999–2018. Although Scr was corrected according to the NHANES document, some measurement variation still existed. Second, due to the lack of data on cystatin C, we did not compare the performance of the creatinine-based eGFR calculated with the EKFC equation with the cystatin C- or creatinine–cystatin C-based eGFR calculated with the CKD-EPI equation. Finally, as we compared the prognostic value of the EKFC and the CKD-EPI equation in non-Black population, the finding may not be generalizable to Black people.
Conclusions
In summary, our study demonstrated that there was a U-shaped relation between the eGFR calculated by the EKFC equation and the risk of all-cause and cardiovascular mortality. The EKFC equation was better than the CKD-EPI equation with regard to improving the risk stratification for all-cause and cardiovascular mortality.
Supplementary material
Supplementary material is available at European Journal of Preventive Cardiology online.
Author contributions
X.Y.L.: Conceptualization, Methodology, Software, and Data curation. R.R.G.: Conceptualization, Writing-Original draft preparation, Visualization, Investigation, and Supervision. S.G.L.: Software, Writing- Reviewing, Editing, and Validation.
Funding
This research did not receive any specific grant from funding agencies in the public, commercial, or not-for-profit sectors.
Data availability
The data are available through the National Health and Nutrition Examination Survey (NHANES) in 1999–2018 (http://wwwn.cdc.gov/nchs/nhanes).
References
Author notes
Conflict of interest: None declared.

Comments