


Regular physical exercise has been highly recommended for the prevention and rehabilitation, but there is still controversy over the optimal dose to produce maximal cardiovascular and renal benefits.1 Former athletes were reported to have longer lifespans2 but also more susceptible to coronary artery calcification3 and atrial fibrillation.4 In this study, we aimed to examine the relationship between exercise dose and the risk of coronary artery disease (CAD), chronic heart failure (CHF), myocardial infarction (MI), and chronic renal failure (CRF) in adults from National Health and Nutrition Examination Surveys (NHANES) 2011–2018 and attempted to identify the respective optimal doses for health prevention.
We analyzed data from NHANES 2011–2018, when the questionnaires on physical activity were basically the same. Physical activity data were collected using self-reported questionnaires. A typical recording of weekly exercise activity in daily life was used to define the exercise habit. Metabolic equivalent hours (h) (MET·h = MET score × exercise time) were calculated as a quantitative index of exercise. Participants without exercise (MET·h/week = 0) were allocated to the never exercise group (NE group). Given that the accurate cutoff value for the optimal exercise dose is unknown, the remaining participants were assigned to four exercise groups with exercise doses of 0 < MET·h/week≤10 (low exercise group, LE group), 10 < MET·h/week≤50 [moderate exercise group (ME) group], 50 < MET·h/week≤100 [vigorous exercise group (VE) group], and MET·h/week > 100 (ultra-vigorous exercise group (UVE) group].
After excluding individuals with missing data and whose ages <18 years and ≥80 years, a total of 21 098 samples were included in the analysis. As shown in Table 1, individuals with regular exercise habits were younger and had lower body mass index (BMI), systolic blood pressure (SBP), triglyceride, HbA1c, fasting glucose, and blood urea nitrogen (BUN) levels as well as higher education levels and annual income. Serum creatinine was only significantly lower in the ME and VE groups compared with the NE group. In the highest dose of exercise group, the participants with the youngest age exhibited higher SBP, serum creatinine and lactate dehydrogenase (LDH), and lower HDL levels, suggesting that the important markers did not decrease as the exercise dose increasing.
Demography and clinical characteristics of participants in different groups
| NE group | LE group | ME group | VE group | UVE group | P | |
|---|---|---|---|---|---|---|
| (N = 6771) | (N = 2799) | (N = 5677) | (N = 2302) | (N = 3549) | ||
| Age, y | 51.9 ± 15.9 | 50.0 ± 15.8 | 46.5 ± 16.3 | 43.4 ± 16.2 | 41.7 ± 15.2 | <0.001 |
| Male, n (%) | 2731 (40.3) | 1180 (42.2) | 2719 (47.9) | 1256 (54.6) | 2347 (66.1) | <0.001 |
| Exe time, h/week | ||||||
| BMI, kg/m2 | 30.1 ± 7.7 | 29.6 ± 7.4 | 28.9 ± 6.9 | 28.9 ± 7.1 | 29.3 ± 6.8 | <0.001 |
| SBP, mmHg | 124 [112, 136] | 122 [112, 134] | 120 [110, 132] | 118 [110, 130] | 120 [112, 132] | <0.001 |
| DBP, mmHg | 72 [64, 78] | 72 [64, 78] | 72 [64, 78] | 72 [64, 78] | 72 [64, 78] | 0.141 |
| Smoking | 1439 (21.3) | 672 (24.0) | 1276 (22.5) | 502 (21.8) | 738 (20.8) | 0.014 |
| Alcoholic, drinks/d | 2.6 ± 2.7 | 2.3 ± 1.9 | 2.5 ± 2.1 | 2.8 ± 2.4 | 3.4 ± 3.0 | <0.001 |
| Occupation, n (%) | <0.001 | |||||
| White-collar | 5987 (88.4) | 2310 (82.5) | 4675 (82.3) | 1965 (85.4) | 3193 (90.0) | |
| Blue-collar | 784 (11.6) | 489 (17.5) | 1002 (17.7) | 337 (14.6) | 356 (10.0) | |
| Annual income (×10000), n (%) | <0.001 | |||||
| Below $2.5 | 1611 (27.5) | 461 (18.4) | 814 (16.1) | 347 (16.6) | 641 (20.3) | |
| $2.5 to $7.5 | 2957 (50.5) | 1164 (46.6) | 2322 (46.0) | 1041 (49.9) | 1747 (55.4) | |
| Over $7.5 | 1282 (21.9) | 875 (35.0) | 1907 (37.8) | 699 (33.5) | 763 (24.2) | |
| Education level, n (%) | <0.001 | |||||
| Middle school | 1015 (15.0) | 207 (7.4) | 338 (6.0) | 131 (5.7) | 253 (7.1) | |
| High school | 2710 (40.0) | 874 (31.2) | 1545 (27.2) | 689 (29.9) | 1516 (42.7) | |
| ≥College | 3046 (44.9) | 1718 (61.4) | 3794 (66.8) | 1482 (64.4) | 1780 (50.2) | |
| Laboratory data from blood samples | ||||||
| BUN, mmol/L | 4.99 ± 2.36 | 4.86 ± 2.19 | 4.83 ± 1.83 | 4.81 ± 1.86 | 4.77 ± 1.62 | <0.001 |
| Cr, µmol/L | 79.14 ± 51.58 | 79.17 ± 54.13 | 77.43 ± 28.56 | 78.34 ± 31.95 | 79.06 ± 24.81 | 0.183 |
| Glu, mmol/L | 6.11 ± 2.76 | 5.73 ± 2.03 | 5.66 ± 2.17 | 5.50 ± 1.94 | 5.47 ± 1.76 | <0.001 |
| LDH, U/L | 135.85 ± 32.44 | 133.11 ± 31.15 | 133.10 ± 33.63 | 134.13 ± 32.66 | 137.33 ± 37.85 | <0.001 |
| UA, µmol/L | 320.10 ± 89.36 | 321.33 ± 86.15 | 320.13 ± 84.31 | 324.19 ± 83.97 | 328.94 ± 83.97 | <0.001 |
| HbA1c, % | 6.00 ± 1.32 | 5.80 ± 1.06 | 5.12 ± 1.07 | 5.65 ± 1.02 | 5.65 ± 0.95 | <0.001 |
| Tg, mmol/L | 1.44 ± 1.42 | 1.36 ± 1.03 | 1.32 ± 1.09 | 1.28 ± 1.42 | 1.29 ± 1.02 | <0.001 |
| LDL, mmol/L | 2.91 ± 0.95 | 2.89 ± 0.90 | 2.92 ± 0.90 | 1.28 ± 1.42 | 1.29 ± 1.02 | 0.590 |
| HDL, mmol/L | 1.35 ± 0.41 | 1.38 ± 0.41 | 1.40 ± 0.42 | 1.39 ± 0.42 | 1.34 ± 0.42 | <0.001 |
BMI, body mass index; BUN, blood urea nitrogen; Cr, creatinine; DBP, diastolic blood pressure; Glu, fasting glucose; HbA1c, glycohaemoglobin; LDH, lactate dehydrogenase; LE, low exercise; ME, moderate exercise; NE, never exercise; SBP, systolic blood pressure; Tg, triglyceride; UVE, ultra-vigorous exercise; VE, vigorous exercise; UA, uric acid.
The restrict cubic spline (RCS) analysis showed a curvilinear association between exercise dose and risk combining diseases of CAD, CHF, MI, and CRF (Figure 1A). After adjusting for covariables, we noted that only participants in the VE group had the best risk reduction effect of CAD [odds ratio (OR) 0.584, 95% CI: 0.403–0.823], CHF (OR 0.443, 95% CI: 0.286–0.658), MI (OR 0.602, 95% CI: 0.426–0.832), and CRF (OR 0.611, 95% CI: 0.434–0.840). Interestingly, the UVE group also obtained risk reduction in all the four diseases, whereas the efficacy was less compared with the VE group (Figure 1B).
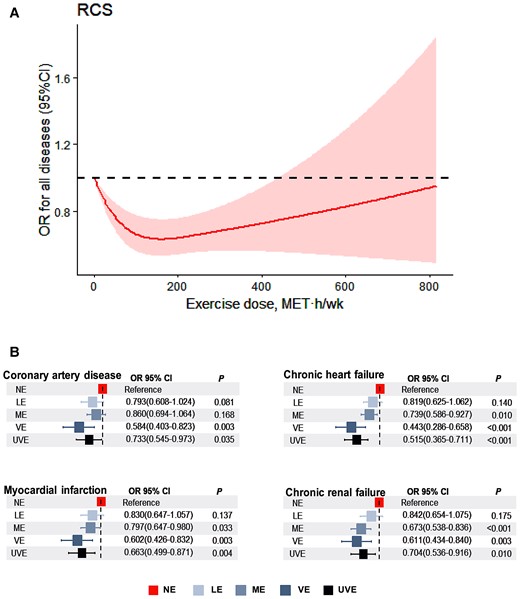
Relationship between exercise dose and risk of all diseases. (A) Restrict cubic spline analyses was performed to explore the shape of the dose-response relation between exercise volume and risk of all diseases. Results were adjusted for age, gender, smoking status, occupation, education level, and income level. Restrict cubic spline model were conducted with three knots at the 5th, 50th, and 95th percentiles of metabolic equivalent hours per week. (B) Binomial regression models were used to estimate odds ratios and 95% confidence intervals for coronary artery disease, chronic heart failure, myocardial infarction, and chronic renal failure morbidity according to metabolic equivalent hours per week with never exercise group as the reference group, and were adjusted for age, sex, smoking status, occupation, income, alcohol consumption, and education level.
More exercise does not mean better because the same increase amount of exercise yielded much smaller beneficial returns. A higher incidence of increased myocardial damage5 was found in consecutive marathon runners because of more endothelial damage due to increased shear stress.
There is also a lower limit to the risk-reducing exercise dose. A Sweden cohort study reported that 40 min of walking per day attenuates CAD risk.6 Kuo et al.7 demonstrated that exercise dose equal to or larger than 7.5 MET-h/week is protective for patients with CKD, which is consistent with our findings, they suggest the optimal exercise dose is 7.5–15 MET-h/week for CKD patients who have lower exercise tolerance than normal individuals. Our experimental studies also suggested that insufficient swimming training failed to induce myocardial protection.8 Huang et al.9 reported that exercise for at least 8 weeks could be beneficial to CRF patients undergoing haemodialysis.
In summary, we found exercise dose between 50 and 100 MET h/week, which equals to vigorous exercise for 6.25 to 12.5 h (or moderate exercise for 12.5 to 25 h) per week, should be optimal for reducing the risk of CAD, CHF, MI, and CRF. Continuing to increase the exercise dose is still protective but brings less benefits. Some potential residual confounding might exist given that the data were collected through questionnaires. Our finding provides new evidence for the development of future exercise guidelines and plans.
Authors’ contributions
K.C. and Y.L. contributed to the conception or design of the work. K.C., T.S., and Y.Z. contributed to the data acquisition and analysis. All authors contributed to data interpretation. K.C., S.M., and L.C. drafted the manuscript. W.L., J.B., and Y.L. critically revised the manuscript. All gave final approval and agree to be accountable for all aspects of work ensuring integrity and accuracy.
Acknowledgements
The authors thank the investigators and participants of the National Health and Nutrition Examination Survey, the parent study, who made this report possible
Data Availability
Data were extracted from the NHANES public database 2011-2018, which can be accessed through https://wwwn.cdc.gov/nchs/nhanes/default.aspx.
Funding
This work was supported by grants from the Joint Funds of the National Natural Science Foundation of China (U1908205) and the National Natural Science Foundation of China (82170278).
References
Author notes
Conflict of interest: None declared.

Comments