


Abstract
To assess the protective effect of statins in a large and unselected cohort of frail elderly subjects.
The 460 460 Lombardy residents (Italy), aged ≥65 years, who received ≥3 consecutive prescriptions of a statin during 2011–2012 were identified. A case–control study was performed, the cases being the cohort members who died during 2011–2018. Logistic regression was used to model the outcome risk associated with statin adherence. Adherence to drug therapy was measured by the proportion of the follow-up covered by prescriptions. The analysis was stratified according to four clinical categories (good, medium, poor, and very poor clinical status), based on different life expectancies, as assessed by a prognostic score which had been found to sensitively predict the risk of death. The 7-year death probability increased from 11% (good) to 52% (very poor clinical status). In each clinical status, there was a significant reduction of all-cause mortality as adherence to statin treatment increased. The reduction in the adjusted risk of mortality from the lowest to the highest adherence level was greatest among patients with a good clinical status (−56%) and progressively less among other cohort members, i.e. −48%, −44% and −47% in medium, poor, and very poor groups, respectively. Similar findings were obtained for the risk of cardiovascular mortality.
In a real-life setting, adherence to statin treatment reduced the death risk also in frail elderly patients. However, in these patients, the benefit of statin treatment may be lower than in those in good clinical conditions.
Introduction
Randomized trials on cardiovascular (CV) prevention have shown that statin-based treatment is associated with a substantial reduction in the risk of CV outcomes and mortality. They have also shown that this (i) can be seen with different statins,1,2 (ii) involves both genders as well as either middle age and older patients,3,4 (iii) extends to people with an elevated but also to those with a normal baseline serum low-density lipoprotein cholesterol,3 and (iv) includes individuals with no but also those with previous CV events, which makes statin administration suitable for either primary and secondary CV prevention.3 However, for a variety of reasons, randomized prevention trials usually exclude from participation patients with very poor clinical conditions, which means that whether and to what extent statin administration plays a CV preventive role also in frail patients, such as those with many concomitant comorbidities and a short life expectancy, is still unclear.5 In this context, information derives only from observational studies which have reported conflicting results.6–8 This has led to the conclusion that available evidence does not support lipid-lowering treatment in patients with advanced frailty.9–11
Aim of our study has been to address this issue by the analysis of a large population database in which frail patients were identified via a multisource comorbidity score (MCS) that accurately predicted their high risk of mortality over the following few years.12 Frail patients were compared with patients in better clinical conditions, the benefit of statin therapy being always quantified by the well-known reduction of all-cause (and CV) mortality that occurs with increasing adherence with statin therapy.13
Methods
Setting
The data used for the current study were retrieved from the Healthcare Utilization databases of Lombardy, a region of Italy that accounts for about 16% (almost 10 million) of its population. The Italian population is covered by the National Health Service (NHS) which provides medical visits, blood tests, instrumental examinations, ‘lifesaving’ medicaments, and hospitalization to all citizens free or almost free-of-charge. In Lombardy, healthcare data are included in an automated system of databases that provides information on individual demographics, drug prescriptions (according to the Anatomical Therapeutic Chemical—ATC—system), medical examinations, surgical interventions and hospitalizations (with diagnoses and procedures coded according to the International Classification of Diseases, Ninth Revision, Clinical Modification—ICD-9-CM—system). Because patients are always recorded via a single identification code, these databases provide the healthcare pathway supplied to NHS beneficiaries. To preserve privacy, each identification code was automatically deidentified, the inverse process being allowed only to the Regional Health Authority upon request from judicial authorities. Further details on healthcare utilization databases of the Lombardy region in the field of CV disease in general, and more specifically for hypercholesterolaemia, are available in previous studies.14–17
Diagnostic, therapeutic, and procedural codes used for the current study are given in the Supplementary material online, Table S1.
Cohort selection and follow-up
The target population included Lombardy residents aged ≥65 years who were beneficiaries of the NHS. Of these, those who received ≥3 consecutive prescriptions of a statin between 2011 and 2012 were identified and the date of the third prescription was defined as the index date. Patients were excluded if they were not beneficiaries of the NHS for at least 5 years before the index date and did not reach ≥6 months of follow-up. The patients recruited into the final cohort accumulated person-years of follow-up from the index date until the earliest date between death, emigration or 30 June 2018.
Selection of cases and controls
When the effect of time-dependent exposure needs to be investigated in the context of large databases, the nested case–control design is a valid alternative to the cohort design.18 The case–control study was thus nested into the cohort of statin users. As death from any cause was the primary outcome of interest, cases were cohort members who died during follow-up, and the death date was considered as the event date. For each case patient, up to four controls were randomly selected from the cohort members to be matched for sex, age at index date, and date of index prescription. Cohort members who died during follow-up had been eligible as potential controls until they became cases, i.e. a density incident sampling approach was adopted.19
Other than death from any cause (primary endpoint), CV mortality, i.e. death for ischaemic heart disease, cerebrovascular disease, or heart failure was also considered (secondary endpoint). With this aim, a secondary nested case–control study was carried out including CV deaths (cases) and corresponding controls as above described.
Assessing clinical frailty
For each patient, clinical frailty was assessed by the MCS, i.e. a prognostic index based on the association of 34 weighted CV and non-CV morbidities suffered in the 2 years before recruitment.12 A weight was assigned to each morbidity according to the strength of the corresponding disease/condition relationship in predicting 1-year mortality. Factors which mostly contribute to the total aggregate score are cancer (with and without metastasis), alcohol abuse, and tuberculosis, while arrhythmia, obesity, and hypothyroidism provide small contributions. These weights are then summed to produce a total aggregate score. The MCS has been tested in 2 million people aged 50 years or above from Lombardy and other Italian regions and shown to more accurately predict mortality than largely used scores such as the Charlson, Elixhauser, and Chronic Disease Scores.20–22 ICD-9 CM and ATC codes of diseases and conditions included into MCS, and corresponding weights, are given in Supplementary material online, Table S2.
Four progressively worsening categories of clinical frailty were considered: good (MCS = 0), intermediate (1 ≤ MCS ≤ 4), poor (5 ≤ MCS ≤ 14), and very poor (MCS ≥ 15).
Measuring adherence to statin treatment
For each patient, all statins prescribed during the follow-up were identified. The period covered by statin prescriptions was calculated from the number of tablets in the dispensed canisters, assuming a treatment schedule of one tablet per day.23 For overlapping prescriptions, the patient was assumed to have taken all drugs contained in the first prescription before starting the second one. Adherence was measured by the cumulative number of days covered by prescription divided by the days of the follow-up, the ratio expressing the proportion of days covered by treatment (PDC).24 Because information on drug therapies dispensed during hospitalization was not available, the exposure to statin before hospital admission was assumed to be continued for the entire span of the-hospital stay.25 Four categories of adherence with statin treatment were considered, i.e. very low (≤25%), low (26–50%), intermediate (51–75%), and high (>75%) PDC values.16
Additional information
The information provided by the databases included the (i) statin treatment strategy at the cohort entry (class and potency); (ii) use of other drugs (antihypertensive, antidiabetic, other CV and non-CV medicaments over the 5 years before the index prescription); and (iii) hospitalizations for CV, respiratory, renal, and other non-CV diseases for the 5 years before the index prescription.
Data analysis
Linear regression and χ2 for the trend were used to test trend in covariates along the categories of MCS. In addition, standardized mean differences for binary covariates were used when appropriate to test case–control differences. Equipoise was considered to be reached when the between-group comparison of covariates had a mean standardized difference of <0.1.26
Conditional logistic regression models were fitted to estimate the odds ratio (OR), and its 95% confidence interval (CI), for the association between categories of adherence with statins (with the lowest adherence category as reference) and the outcome onset, while adjusting for the above-mentioned covariates. OR trends were tested according to the statistical significance of the regression coefficient of the recoded variable obtained by scoring the corresponding categories. All estimates were obtained by separately modelling the association of interest according to categories of clinical category. In addition, the impact of adherence on all-cause and CV mortality according to categories of both clinical frailty and age (65–74 years, 75–84 years, and ≥85 years) was measured.
Sensitivity analyses
To verify the robustness of our findings, two further analyses were performed. First, the impact of a possible unmeasured confounder on the relationship between adherence and all-cause mortality was evaluated by the rule-out approach27 whose aim is to detect the extent of the confounding required to fully account for the exposure-outcome association. We set the possible unmeasured confounder: (i) to have a 15% prevalence in the study population; (ii) to increase the risk of the outcome up to 10-fold more in patients exposed to the unmeasured confounder than in those unexposed; and (iii) to be up to 10-fold less common in high than in low adherent patients.
Second, to investigate whether our estimates were affected by healthy user bias (healthier patients are more likely to adhere with therapy than less healthy patients), we assessed the relationship between adherence with statins and the so-called ‘control outcomes’, i.e. outcomes unlikely to be causally related to treatment.28 According to a previous investigation,29 ‘control outcomes’ were regarded to be the composite of hospital admissions for respiratory diseases, bacterial and skin infections, deep vein thrombosis, dental problem, diverticulitis, drug dependency, food-borne bacterial infection, gall stones, gastrointestinal bleeds, gout, kidney stones, malignant melanoma, migraine, and sexually transmitted disease. Because long-term use of statins is unlikely to be associated with these outcomes, we did not expect any relationship between them and adherence with statins in our patients.
The Statistical Analysis System Software (version 9.4; SAS Institute, Cary, NC, USA) was used for the analyses. For all hypotheses tested, P-values less than 0.05 were considered to be significant.
Results
Patients
The distribution of the exclusion criteria is shown in Supplementary material online, Figure S1. Among the 710 550 patients who had ≥3 consecutive prescriptions of a statin during the period 2011–2012, the 460 460 patients meeting the inclusion criteria accumulated 2 693 262 person-years of observation (on average, 5.8 years per patient). During follow-up, 90 288 deaths occurred (mortality rate: 33.5 every 1000 person-year), of whom 18 738 for ischaemic heart disease, 8691 for cerebrovascular disease, and 871 for heart failure (CV mortality rate: 11.0 every 1000 person-year).
The baseline characteristics of cohort members are shown in Table 1 for each clinical category. Age showed only marginal between-category differences, whereas use of high-potency statins and other drugs (including antihypertensive and antidiabetic agents) as well as previous hospitalizations for any disease showed a progressive increase from the category with a good clinical status to the category with very poor clinical status or frailty. Patients with a good clinical status were those with MCS = 0, i.e. cohort members with no conditions contributing to the MCS such as diabetes or treatment reflecting diseases (e.g. anticoagulants).
Comparison of demographic, clinical and therapeutic characteristics of the cohort members according to the clinical category
| Clinical frailtya | P-value | ||||
|---|---|---|---|---|---|
| Good (n = 82 782) | Intermediate (n = 175 771) | Poor (n = 170 483) | Very poor (n = 31 424) | ||
| Baseline | |||||
| Men | 33 533 (40.5%) | 79 633 (45.3%) | 89 152 (52.3%) | 18 623 (59.3%) | <0.001 |
| Age (years): mean (SD) | 73 (6) | 74 (6) | 76 (7) | 76 (6) | <0.001 |
| Statin at cohort entry | |||||
| High-potency statin | 31 459 (38.0%) | 76 103 (43.3%) | 88 560 (52.0%) | 16 905 (53.8%) | <0.001 |
| Statin class | |||||
| Atorvastatin | 19 569 (23.6%) | 47 558 (27.1%) | 58 907 (34.6%) | 12 019 (38.3%) | <0.001 |
| Fluvastatin | 2460 (3.0%) | 4481 (2.6%) | 3047 (1.8%) | 498 (1.6%) | <0.001 |
| Lovastatin | 2059 (2.5%) | 3546 (2.0%) | 2115 (1.2%) | 314 (1.0%) | <0.001 |
| Pravastatin | 4198 (5.1%) | 8433 (4.8%) | 8145 (4.8%) | 1332 (4.2%) | <0.001 |
| Rosuvastatin | 19 145 (23.1%) | 39 730 (22.6%) | 34 200 (20.1%) | 5474 (17.4%) | <0.001 |
| Simvastatin | 33 320 (40.3%) | 67 286 (38.3%) | 58 916 (34.6%) | 10 669 (34.0%) | <0.001 |
| More than 1 | 2031 (2.5%) | 4737 (2.7%) | 5153 (3.0%) | 1118 (3.6%) | <0.001 |
| Other drugs | |||||
| Antihypertensive agents | 61 007 (73.7%) | 147 442 (83.9%) | 162 193 (95.1%) | 30 141 (95.9%) | <0.001 |
| Antiarrhythmic agents | 9 (0.0%) | 9658 (5.5%) | 23 454 (13.8%) | 5653 (18.0%) | <0.001 |
| Antiplatelet drugs | 31 257 (37.8%) | 100 378 (57.1%) | 132 588 (77.8%) | 25 357 (80.7%) | <0.001 |
| Oral anticoagulant agent | 0 (0.0%) | 8998 (5.1%) | 29 509 (17.3%) | 6896 (22.0%) | <0.001 |
| Antidiabetic drugs | 0 (0.0%) | 39 050 (28.6%) | 48 714 (33.6%) | 11 084 (42.8%) | <0.001 |
| Digitalis | 0 (0.0%) | 263 (0.2%) | 9815 (5.8%) | 2459 (7.8%) | <0.001 |
| Nitrates | 0 (0.0%) | 8214 (4.7%) | 64 529 (37.9%) | 13 070 (41.6%) | <0.001 |
| NSAIDs | 39 403 (47.6%) | 94 447 (53.7%) | 94 290 (55.3%) | 17 630 (56.1%) | <0.001 |
| Anti-gout drugs | 37 (0.0%) | 13 510 (7.7%) | 33 151 (19.5%) | 10 992 (35.0%) | <0.001 |
| Antidepressant agents | 10 463 (12.6%) | 27 350 (15.6%) | 35 676 (20.9%) | 9411 (30.0%) | <0.001 |
| Drugs for respiratory disease | 3902 (4.7%) | 42 031 (23.9%) | 58 239 (34.2%) | 13 451 (42.8%) | <0.001 |
| Previous hospitalizations | |||||
| Cardiovascular disease | 1972 (2.4%) | 23 272 (13.2%) | 79 727 (46.8%) | 22 217 (70.7%) | <0.001 |
| Diabetes | 0 (0.0%) | 3743 (2.1%) | 19 761 (11.6%) | 9321 (29.7%) | <0.001 |
| Kidney disease | 23 (0.0%) | 200 (0.1%) | 5223 (3.1%) | 7066 (22.5%) | <0.001 |
| Metal disorders | 152 (0.2%) | 857 (0.5%) | 3527 (2.1%) | 2891 (9.2%) | <0.001 |
| Respiratory disease | 454 (0.6%) | 3300 (1.9%) | 15 303 (9.0%) | 7916 (25.2%) | <0.001 |
| Cancer | 1266 (1.5%) | 4027 (2.3%) | 12 079 (7.1%) | 13 877 (44.2%) | <0.001 |
SD, standard deviation.
Clinical frailty was assessed by the Multisource Comorbidity Score (MCS) and four categories were considered: good (MCS = 0), intermediate (MCS ≥1 to ≤4), poor (MCS ≥5 to ≤14), and very poor (MCS ≥ 15).
Cumulative proportion of survivors during follow-up showed a clear relationship between survival and the MCS-derived categories, the seven-year mortality being 11%, 15%, 30%, and 52% among cohort members in the good, intermediate, poor, and very poor clinical categories, respectively (Figure 1, upper panel).
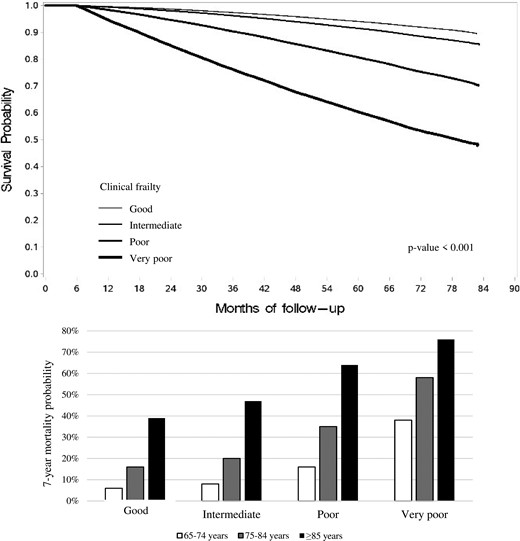
Kaplan–Meier survival curves for all-cause death according to the clinical frailty as determined by Multisource Comorbidity Score (MCS) and 7-year mortality probabilities according to the clinical frailty and age strata.
Statin treatment and outcomes
Table 2 shows the characteristics of cases (n = 90 036) and matched controls (n = 358 789). Compared with controls, cases suffered more often from respiratory diseases and showed a lower adherence with statins. Figure 2, upper panels, shows the relationship of adherence with statins and all-cause-mortality. In each clinical category, there was a progressive reduction of all-cause mortality as adherence increased. The reduction was somewhat greater in patients belonging to the good clinical category (−56%, 95% CI −51% to −59%) than in all other clinical categories (−48%, −45% to −51%; −44%, −41% to −46%; and −47%, −43% to −50%), i.e., in patients in the intermediate, poor, and very poor (and thus frail) clinical category, respectively. Similar results were obtained for CV mortality (Figure 2, bottom panels) and in patients stratified according to age. In particular, in patients aged ≥85 years and a mortality of 76% in 7 years (Figure 1, lower panel), very high adherence to statins was also associated with a reduction of both all-cause mortality and CV mortality compared to a very low adherence (Table 3).
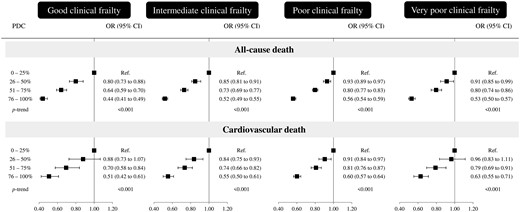
Effect of adherence with statins on the odds ratio (OR) of all-cause and cardiovascular death according to the clinical frailty as measured by Multisource Comorbidity Score (MCS) OR (and 95% confidence intervals, CIs) was estimated with conditional logistic regression. Estimates were adjusted for the covariates listed in Table 1.
Comparison of demographic, clinical, and therapeutic characteristics of the cohort members who died (cases) or survived (controls)
| Cases (n = 90 036) | Controls (n = 358 789) | SMD | |
|---|---|---|---|
| Baseline | |||
| Men | 50 722 (56.3%) | 202 161 (56.3%) | MV |
| Age (years): mean (SD) | 79 (7) | 79 (7) | MV |
| Clinical categorya | |||
| Good | 7288 (8.1%) | 28 997 (8.1%) | MV |
| Intermediate | 22 058 (24.5%) | 87 958 (24.5%) | |
| Poor | 45 423 (50.4%) | 181 300 (50.5%) | |
| Very poor | 15 267 (17.0%) | 60 534 (16.9%) | |
| Statin at cohort entry | |||
| High-potency statin | 42 491 (47.2%) | 169 506 (47.2%) | 0.001 |
| Statin class | |||
| Atorvastatin | 29 904 (33.2%) | 116 293 (32.4%) | 0.017 |
| Fluvastatin | 1873 (2.1%) | 7620 (2.1%) | 0.003 |
| Lovastatin | 1149 (1.3%) | 5048 (1.4%) | 0.011 |
| Pravastatin | 5044 (5.6%) | 18 819 (5.3%) | 0.016 |
| Rosuvastatin | 15 751 (17.5%) | 68 725 (19.2%) | 0.043 |
| Simvastatin | 33 881 (37.6%) | 132 698 (37.0%) | 0.013 |
| More than 1 | 2434 (2.7%) | 9586 (2.7%) | 0.002 |
| Other drugs | |||
| Antihypertensive agents | 84 441 (93.8%) | 332 305 (92.6%) | 0.046 |
| Antiarrhythmic agents | 11 919 (13.2%) | 42 704 (11.9%) | 0.040 |
| Antiplatelet drugs | 67 865 (75.4%) | 264 318 (73.7%) | 0.039 |
| Oral anticoagulant agents | 15 373 (17.1%) | 50 444 (14.1%) | 0.083 |
| Antidiabetic drugs | 31 727 (35.2%) | 109 762 (30.6%) | 0.099 |
| Digitalis | 5530 (6.1%) | 16 020 (4.5%) | 0.075 |
| Nitrates | 28 127 (31.2%) | 108 326 (30.2%) | 0.023 |
| NSAIDs | 46 284 (51.4%) | 195 385 (54.5%) | 0.061 |
| Anti-gout drugs | 19 302 (21.4%) | 65 832 (18.4%) | 0.077 |
| Antidepressant agents | 20 999 (23.3%) | 70 871 (19.8%) | 0.087 |
| Drugs for respiratory disease | 27 950 (31.0%) | 106 974 (29.8%) | 0.027 |
| Previous hospitalizations | |||
| Cardiovascular disease | 37 941 (42.1%) | 141 012 (39.3%) | 0.058 |
| Diabetes | 12 136 (13.5%) | 37 250 (10.4%) | 0.096 |
| Kidney disease | 6822 (7.6%) | 19 285 (5.4%) | 0.090 |
| Metal disorders | 2849 (3.2%) | 9045 (2.5%) | 0.039 |
| Respiratory disease | 11 617 (12.9%) | 32 097 (9.0%) | 0.127 |
| Cancer | 9849 (10.9%) | 40 529 (11.3%) | 0.011 |
| During follow-up | |||
| Adherence with statinsb | |||
| Very low | 9121 (10.1%) | 25 441 (7.1%) | 0.191 |
| Low | 15 710 (17.5%) | 48 945 (13.6%) | |
| Intermediate | 25 118 (27.9%) | 88 762 (24.8%) | |
| High | 40 087 (44.5%) | 195 641 (54.5%) |
MV, matching variable; SD, standard deviation; SMD, standardized mean differences.
Clinical frailty was assessed by the Multisource Comorbidity Score (MCS) and four categories were considered: good (MCS = 0), intermediate (MCS ≥1 to ≤4), poor (MCS ≥5 to ≤14), and very poor (MCS ≥ 15).
Adherence was measured by the ratio between the days with available statin drug prescriptions and all days of follow-up. Adherence categories are: very low: ≤25%; low: 26–50%; intermediate: 51–75%; and high: >75%.
Effect of adherence with statins on the risk of all-cause and cardiovascular mortality according to categories of clinical frailty and age
| Clinical frailtya | |||||
|---|---|---|---|---|---|
| Age strata | Adherence | Good | Intermediate | Poor | Very poor |
| All-cause mortality | |||||
| 65–74 | Very low | 1.00 (Ref.) | 1.00 (Ref.) | 1.00 (Ref.) | 1.00 (Ref.) |
| Low | 0.77 (0.64–0.91) | 0.90 (0.80–1.01) | 0.90 (0.81–1.00) | 0.95 (0.82–1.12) | |
| Intermediate | 0.67 (0.57–0.79) | 0.70 (0.62–0.77) | 0.74 (0.68–0.82) | 0.87 (0.76–1.01) | |
| High | 0.46 (0.39–0.54) | 0.50 (0.45–0.55) | 0.53 (0.49–0.58) | 0.52 (0.45–0.59) | |
| P-trend | <0.001 | <0.001 | <0.001 | <0.001 | |
| 75–84 | Very low | 1.00 (Ref.) | 1.00 (Ref.) | 1.00 (Ref.) | 1.00 (Ref.) |
| Low | 0.76 (0.67–0.87) | 0.90 (0.83–0.98) | 0.92 (0.87–0.98) | 0.92 (0.83–1.03) | |
| Intermediate | 0.57 (0.50–0.65) | 0.78 (0.72–0.84) | 0.80 (0.75–0.84) | 0.79 (0.72–0.87) | |
| High | 0.40 (0.35–0.45) | 0.55 (0.51–0.59) | 0.55 (0.52–0.59) | 0.55 (0.50–0.60) | |
| P-trend | <0.001 | <0.001 | <0.001 | <0.001 | |
| ≥85 | Very low | 1.00 (Ref.) | 1.00 (Ref.) | 1.00 (Ref.) | 1.00 (Ref.) |
| Low | 0.97 (0.79–1.20) | 0.74 (0.66–0.83) | 0.93 (0.86–1.01) | 0.85 (0.72–1.00) | |
| Intermediate | 0.77 (0.62–0.95) | 0.71 (0.63–0.79) | 0.83 (0.77–0.89) | 0.73 (0.63–0.85) | |
| High | 0.56 (0.45–0.69) | 0.49 (0.44–0.55) | 0.61 (0.57–0.65) | 0.53 (0.50–0.62) | |
| P-trend | <0.001 | <0.001 | <0.001 | <0.001 | |
| Clinical frailtya | |||||
| Age strata | Adherence | Good | Intermediate | Poor | Very poor |
| Cardiovascular mortality | |||||
| 65–74 | Very low | 1.00 (Ref.) | 1.00 (Ref.) | 1.00 (Ref.) | 1.00 (Ref.) |
| Low | 1.04 (0.62–1.72) | 0.94 (0.72–1.23) | 0.95 (0.77–1.16) | 1.10 (0.76–1.61) | |
| Intermediate | 0.78 (0.49–1.25) | 0.73 (0.57–0.95) | 0.82 (0.68–0.99) | 0.86 (0.62–1.20) | |
| High | 0.56 (0.35–0.88) | 0.64 (0.50–0.82) | 0.64 (0.53–0.77) | 0.66 (0.48–0.91) | |
| P-trend | <0.001 | <0.001 | <0.001 | <0.001 | |
| 75–84 | Very low | 1.00 (Ref.) | 1.00 (Ref.) | 1.00 (Ref.) | 1.00 (Ref.) |
| Low | 0.75 (0.58–0.98) | 0.81 (0.69–0.96) | 0.90 (0.81–1.00) | 0.95 (0.78–1.16) | |
| Intermediate | 0.58 (0.44–0.75) | 0.77 (0.66–0.90) | 0.79 (0.71–0.87) | 0.81 (0.68–0.97) | |
| High | 0.40 (0.31–0.52) | 0.54 (0.47–0.63) | 0.58 (0.53–0.64) | 0.66 (0.55–0.78) | |
| P-trend | <0.001 | <0.001 | <0.001 | <0.001 | |
| ≥85 | Very low | 1.00 (Ref.) | 1.00 (Ref.) | 1.00 (Ref.) | 1.00 (Ref.) |
| Low | 0.98 (0.70–1.39) | 0.83 (0.70–1.00) | 0.90 (0.80–1.01) | 0.94 (0.72–1.23) | |
| Intermediate | 0.85 (0.61–1.20) | 0.69 (0.58–0.83) | 0.85 (0.76–0.94) | 0.74 (0.57–0.94) | |
| High | 0.68 (0.49–0.96) | 0.52 (0.43–0.62) | 0.63 (0.56–0.70) | 0.58 (0.46–0.74) | |
| P-trend | 0.010 | <0.001 | <0.001 | <0.001 | |
| Clinical frailtya | |||||
|---|---|---|---|---|---|
| Age strata | Adherence | Good | Intermediate | Poor | Very poor |
| All-cause mortality | |||||
| 65–74 | Very low | 1.00 (Ref.) | 1.00 (Ref.) | 1.00 (Ref.) | 1.00 (Ref.) |
| Low | 0.77 (0.64–0.91) | 0.90 (0.80–1.01) | 0.90 (0.81–1.00) | 0.95 (0.82–1.12) | |
| Intermediate | 0.67 (0.57–0.79) | 0.70 (0.62–0.77) | 0.74 (0.68–0.82) | 0.87 (0.76–1.01) | |
| High | 0.46 (0.39–0.54) | 0.50 (0.45–0.55) | 0.53 (0.49–0.58) | 0.52 (0.45–0.59) | |
| P-trend | <0.001 | <0.001 | <0.001 | <0.001 | |
| 75–84 | Very low | 1.00 (Ref.) | 1.00 (Ref.) | 1.00 (Ref.) | 1.00 (Ref.) |
| Low | 0.76 (0.67–0.87) | 0.90 (0.83–0.98) | 0.92 (0.87–0.98) | 0.92 (0.83–1.03) | |
| Intermediate | 0.57 (0.50–0.65) | 0.78 (0.72–0.84) | 0.80 (0.75–0.84) | 0.79 (0.72–0.87) | |
| High | 0.40 (0.35–0.45) | 0.55 (0.51–0.59) | 0.55 (0.52–0.59) | 0.55 (0.50–0.60) | |
| P-trend | <0.001 | <0.001 | <0.001 | <0.001 | |
| ≥85 | Very low | 1.00 (Ref.) | 1.00 (Ref.) | 1.00 (Ref.) | 1.00 (Ref.) |
| Low | 0.97 (0.79–1.20) | 0.74 (0.66–0.83) | 0.93 (0.86–1.01) | 0.85 (0.72–1.00) | |
| Intermediate | 0.77 (0.62–0.95) | 0.71 (0.63–0.79) | 0.83 (0.77–0.89) | 0.73 (0.63–0.85) | |
| High | 0.56 (0.45–0.69) | 0.49 (0.44–0.55) | 0.61 (0.57–0.65) | 0.53 (0.50–0.62) | |
| P-trend | <0.001 | <0.001 | <0.001 | <0.001 | |
| Clinical frailtya | |||||
| Age strata | Adherence | Good | Intermediate | Poor | Very poor |
| Cardiovascular mortality | |||||
| 65–74 | Very low | 1.00 (Ref.) | 1.00 (Ref.) | 1.00 (Ref.) | 1.00 (Ref.) |
| Low | 1.04 (0.62–1.72) | 0.94 (0.72–1.23) | 0.95 (0.77–1.16) | 1.10 (0.76–1.61) | |
| Intermediate | 0.78 (0.49–1.25) | 0.73 (0.57–0.95) | 0.82 (0.68–0.99) | 0.86 (0.62–1.20) | |
| High | 0.56 (0.35–0.88) | 0.64 (0.50–0.82) | 0.64 (0.53–0.77) | 0.66 (0.48–0.91) | |
| P-trend | <0.001 | <0.001 | <0.001 | <0.001 | |
| 75–84 | Very low | 1.00 (Ref.) | 1.00 (Ref.) | 1.00 (Ref.) | 1.00 (Ref.) |
| Low | 0.75 (0.58–0.98) | 0.81 (0.69–0.96) | 0.90 (0.81–1.00) | 0.95 (0.78–1.16) | |
| Intermediate | 0.58 (0.44–0.75) | 0.77 (0.66–0.90) | 0.79 (0.71–0.87) | 0.81 (0.68–0.97) | |
| High | 0.40 (0.31–0.52) | 0.54 (0.47–0.63) | 0.58 (0.53–0.64) | 0.66 (0.55–0.78) | |
| P-trend | <0.001 | <0.001 | <0.001 | <0.001 | |
| ≥85 | Very low | 1.00 (Ref.) | 1.00 (Ref.) | 1.00 (Ref.) | 1.00 (Ref.) |
| Low | 0.98 (0.70–1.39) | 0.83 (0.70–1.00) | 0.90 (0.80–1.01) | 0.94 (0.72–1.23) | |
| Intermediate | 0.85 (0.61–1.20) | 0.69 (0.58–0.83) | 0.85 (0.76–0.94) | 0.74 (0.57–0.94) | |
| High | 0.68 (0.49–0.96) | 0.52 (0.43–0.62) | 0.63 (0.56–0.70) | 0.58 (0.46–0.74) | |
| P-trend | 0.010 | <0.001 | <0.001 | <0.001 | |
ORs (and 95% confidence intervals, CIs) was estimated with conditional logistic regression. Estimates were adjusted for the covariates listed in Table 1.
Clinical frailty was assessed by the Multisource Comorbidity Score (MCS) and four categories were considered: good (MCS = 0), intermediate (MCS ≥1 to ≤4), poor (MCS ≥5 to ≤14), and very poor (MCS ≥ 15).
Adherence to treatment was measured by the ratio between the days with available antihypertensive drug prescriptions and all days of follow-up. Adherence categories are: very low: ≤25%; low: 26–50%; intermediate: 51–75%; and high: >75%.
Sensitivity analyses
The results of the residual confounding analysis obtained by the rule-out approach are shown in Supplementary material online, Figure S2. Assuming that adherent patients had a five-fold lower odds of exposure to the confounder than non-adherent subjects, an unmeasured confounder should have increased the outcome risk by five-fold to nullify the observed protective effect of drug adherence on all-cause mortality among patients in the poor clinical category. Stronger confounder–outcome associations were required for moving to the null the protective effect of adherence observed in the other clinical categories.
With one exception, i.e. for the intermediate clinical category, statin did not show any relationship with ‘control outcomes’ at any adherence level in any clinical category. (Supplementary material online, Table S3).
Discussion
Our study confirms the results obtained by our group and others that in the general population a progressive increase in adherence with prescription of statins is associated with a progressive and steep reduction in the risk of all-cause and CV mortality.16,30,31 The most important new finding of our investigation, however, is that this appeared to be the case regardless the clinical status of the patients and that, in particular, an increased adherence was associated with a reduction of all-cause and CV mortality also in patients with a high rate of comorbidities and a high mortality within a relatively short time. This allows to conclude that the protective effect of statins is not limited to people in good but it extends to people whose very poor health, and thus frailty, is documented by their high mortality rate.
Other findings of our study deserve to be mentioned. One, the conclusion that in old patients an increased adherence to statin treatment is accompanied by a reduction of all-cause and CV mortality from a good to a very poor and frail clinical condition applied to different age strata, up to patients aged ≥85 years, in whom a 7-year mortality rate of 76% made their frail condition incontrovertible. This scores strongly in favour of the conclusion that lipid-lowering treatment is likely to be beneficial even in these extreme conditions, i.e. when age is extremely advanced and patients’ frailty is documented by a large number of comorbidities and a very high incidence of mortality. Two, the same finding speaks against the frequent recommendation to limit or withdraw statins administration in very old individuals, especially when their clinical status appears to be compromised, because, according to our data, this therapeutic choice might deprive them of a lifesaving effect, albeit of a lesser magnitude than in healthier age-matched persons (see below). Three, our results also show that the protective effect of an increased adherence may not be entirely independent on the patients’ background clinical status because the reduction of all-cause and CV mortality from very low to very good adherence was less in frail patients than in those in good health, the difference amounting to −16% and −37% less protection, respectively. This was even more evident in patients with very poor clinical status aged ≥85 years in whom the corresponding adherence-related protection was reduced by 50% and 54%. In this context, however, it must also be mentioned that in the deteriorated or frail clinical category the number of lethal outcomes was much greater than in the good clinical category. This means that, although in frail people the relative benefit of good vs. bad adherence may be less than in people with safe clinical frailty, the absolute number of events saved is in fact greater. Calculations from the present data indicate that 5496 and 3207 lethal events were saved in the former and latter condition, respectively.
Four, assessing the benefit of treatment by an increased adherence with the prescribed treatment regimen is exposed to the criticism that the benefit may originate by a ‘health seeking behaviour’ of the patients (healthier lifestyle, more frequent medical visits, more frequent medical examinations, etc.) rather than specifically from a more regular assumption of the prescribed statin treatment. However, it is unlikely that this affected our results in a substantial fashion because, as shown by one of the two sensitivity analyses, diseases unrelated to statin treatment (control outcomes) did not show any relationship with adherence in virtually all clinical groups. This speaks strongly in favour of the conclusion that the reduction of mortality with improvement of adherence with statins specifically reflected the protective effects of these drugs. Five, the protective effect of high adherence to statin treatment was greater for all-cause mortality than for CV mortality. This might be interpreted as to reflect a protective effect of statins on outcomes of a non-CV nature. However, it should be mentioned that, owing to privacy rules, the causes of death reported in the records were not available for scrutiny, with a consequent lack of full validation.32 This means that estimates of CV mortality do not reach the level of accuracy of estimates of all-cause mortality, making a comparison between the magnitude of the two effects of limited value.
Our study has several elements of strength. First, the investigation was based on a large unselected population, which was made possible because in Italy a cost-free healthcare system involves virtually all citizens.12,14–17 Second, the drug prescription database provides accurate data because pharmacists are required to report prescriptions in detail in order to obtain reimbursement and incorrect reports have legal consequences.33 Third, the choice of active comparison of patients with the same indication at baseline, but with a different level of exposure to the drug of interest, reduces the potential for confounding.34 Finally, the selection of all-cause mortality as the primary outcome avoided any uncertainty about diagnostic accuracy.
Our study has also limitations. Exposure misclassification may have affected our findings in several ways. First, adherence with statins was derived from drug dispensing, i.e. a widely used method to estimate adherence in large populations which requires the assumption, however, that the proportion of days covered by a prescription corresponds to the proportion of days of drug use.14 Second, the prescribed daily doses of statins are not recorded in our database,14 for which reason we assumed that all patients assumed the usual statin dose as one pill per day. However, this might not be true in a subgroup of patients with advanced renal impairment in whom statins are given at smaller doses.35 However, advanced renal impairment accounts for 1% of the Italian population,36 which means that, although presumably more common in the frail patient category, nephropathic people under lower doses of statin were a very small fraction of our cohort. Furthermore, by increasing the duration of the statin canister, patients with an advanced nephropathy might have been more adherent to treatment than what is reflected by our classification. This misclassification might have reduced the outcome difference between low and high adherence patient categories, if anything underestimating the benefit of statin treatment in the poor clinical or frail patient group.
Finally, as other administrative databases, the Lombardy databases do not include data such as serum cholesterol, blood pressure, blood glucose, etc., which precluded the possibility to examine the results in relation to the effects of statin administration and adherence on the intermediate treatment goals (in the present case on-treatment lipid profile) and to adjust for the possible impact of changing clinical variables. However, our data were adjusted for a number of potential confounders, including treatment of several risk factors and CV diseases. Furthermore, and most importantly, the sensitivity analyses show that (i) in order to account for the observed adherence → mortality relationship, exposure to an unmeasured confounder should increase mortality to such an extent (several folds) to make this explanation of the results, although in principle possible, unlikely, and (ii) the ‘control outcome’ (i.e. that is not expected to change in response to the intervention of interest) was not affected by drug adherence, which makes it most likely that adherence was independently responsible for the results. This does not eliminate the possibility of residual confounding which will only be possible by future trials in which relevant clinical information and outcomes will be measured in old and frail patients randomized to take or avoid statin treatment in order to equalize their baseline clinical phenotypes.
Conclusions
In summary, our data support the evidence that therapy with statins reduces the risk of death also among elderly frail patients and that this is true also in the frail very elderly fraction of the population under prescription of these drugs. However, the benefit from the treatment seems to be lower in patients with a short life expectancy than those in good clinical conditions. Given the potential for bias, and the conflicting results from the existing literature on this issue, additional high-quality studies are needed.
Supplementary material
Supplementary material is available at European Journal of Preventive Cardiology online.
Funding
This study was supported by grants from the Italian Ministry of the Education, University and Research (‘Fondo d’Ateneo per la Ricerca’ portion, year 2018), and from the Italian Ministry of Health (‘Ricerca Finalizzata 2016’, NET-2016-02363853). The funding sources had no role in the design of the study, the collection, analysis and interpretation of the data, or the decision to approve publication of the finished manuscript.
Conflict of interest: G.M. received honoraria for participation as speaker/chairman in national/international meetings from Bayer, Boehringer Ingelheim, CVRx, Daiichi Sankyo, Ferrer, Medtronic, Menarini Int., Merck, Novartis, Recordati and Servier. G.C. received research support from the European Community (EC), the Italian Agency of Drug (AIFA), and the Italian Ministry of Education, University and Research (MIUR). He took part to a variety of projects that were funded by pharmaceutical companies (i.e. Novartis, GSK, Roche, AMGEN and BMS). He also received honoraria as member of Advisory Board from Roche. F.R. has no disclosures.
Data availability
The data that support the findings of this study are available from Lombardy Region, but restrictions apply to the availability of these data, which were used under license for the current study, and so are not publicly available. Data are however available from the Lombardy Region upon reasonable request.

Comments