


Abstract
Inconsistent findings are reported on whether insulin-like growth factor-1 (IGF-1) is protective or harmful in predicting hypertension, carotid wall thickness and mortality. We determined the five-year prognostic value of IGF-1 for these outcomes in a large Black population prone to hypertension and cardiovascular disease.
A longitudinal study as part of the PURE (Prospective Urban and Rural Epidemiology) study, North West Province, South Africa.
We measured IGF-1 and IGF binding protein-3 (IGFBP-3) in 1038 HIV-uninfected participants (age range 32–94 years) and assessed blood pressure, carotid intima-media thickness and mortality.
Over five years 116 deaths occurred. Baseline IGF-1 was similar in survivors and non-survivors (p = 0.50), but tended to be higher in survivors upon adjustment for IGFBP-3 and covariates (p = 0.061). Normotensives and hypertensives (p = 0.072), and those with carotid intima-media thickness < 0.9 mm and ≥ 0.9 mm also displayed similar baseline IGF-1 (p = 0.55). Multivariable-adjusted Cox-regression indicated high IGF-1 predicting lower risk for all-cause mortality (hazard ratio 0.45; 0.23–0.88) and cardiovascular mortality (hazard ratio 0.26; 0.08–0.83) when also adjusting for IGFBP-3. When including normo- and hypertensives at baseline, high IGF-1 was related to normotension at follow-up (hazard ratio 0.68; 0.49–0.95). We found no association with carotid intima-media thickness (hazard ratio 0.59; 0.31–1.14).
In a Black South African population with low socio-economic status and harmful health behaviours, we found a protective independent association between IGF-1 and hypertension, cardiovascular and all-cause mortality, with no association with carotid wall thickness.
Introduction
Conflicting findings are consistently reported on the cardiovascular protective versus detrimental effects of insulin-like growth-factor 1 (IGF-1). These contradictory reports span findings relating to hypertension development,1–4 carotid wall thickening,5–10 and all-cause and cardiovascular mortality.11–18
IGF-1 is induced by growth hormone, and forms part of a complex and dynamic system involving at least six IGF-1 binding proteins and binding-protein related proteases19 – all of which affect IGF-1 bioavailability. Free or bioavailable IGF-1 has protective effects on the endothelium20 – exerted mainly via the PI3K (phosphoinositide 3-kinase)/Akt signalling pathway by means of nitric oxide generation,21,22 thereby having a potential blood pressure lowering effect. In contrast, the IGF-1-mediated mitogenic, migratory and proliferatory effects on vascular smooth muscle cells applied via the mitogen-activated protein kinase (MAPK) pathway23 are potent when unbalanced with respect to the IGF-1-typical PI3K activity, and have been under scrutiny, suggesting a link with atherogenesis and coronary heart disease,5,7,3,24 as well as cancer.25
In this study we evaluated the prognostic significance of IGF-1 for hypertension, carotid wall thickness, and all-cause and cardiovascular mortality in 1038 Black individuals followed over five years. This Black population is prone to hypertension26,27 and cardiovascular disease,28–30 and we have previously shown that Black individuals present lower IGF-1 concentrations than Whites from young ages onwards.6,31 Furthermore, the suitability of this study is enhanced by the inclusion of IGF binding protein-3 (IGFBP- 3) (with 80% of IGF-1 being bound to IGFBP-320), a detailed phenotypic characterization of the population, such as obesity32,33 measures, alcohol intake,34,35 inflammation,17,32,36 physical activity34,37 and smoking38 – all known to affect circulating IGF-1 concentrations.
Methods
Study population
This study forms part of the Prospective Urban and Rural Epidemiology (PURE) study, which tracks changing lifestyles, risk factors and chronic disease using periodic standardized data collection in urban and rural areas of 18 countries in transition.39 In 2005 we collected the baseline data of the South African leg in the North-West Province and included 2010 Africans (aged >30 years) from a sample of 6000 randomly selected households. In 2010 we performed the first follow-up, including 1288 participants. From those not taking part, 233 were deceased and 489 refused participation and were regarded as ‘lost to follow-up’ (follow-up rate, 76%).
For this sub-study we focused on those with available IGF-1 data (N = 1660; Figure 1). After excluding HIV-infected participants and those with missing data, and taking into account those lost to follow-up, we had a complete dataset for 1038 participants at baseline (age range 32–94 years), with 922 survivors and 116 non-survivors. Participants lost to follow-up were comparable to survivors (Supplementary Material Table S1 online) for IGF-1 and IGFBP-3, blood pressure and body mass index and inflammatory markers, but were younger and consisted of more men from urban areas.
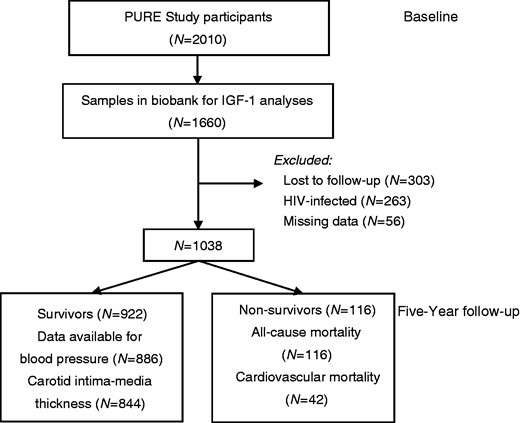
Participant flow chart.
PURE: Prospective Urban and Rural Epidemiology; IGF-1: insulin-like growth factor-1
Participants were fully informed about the objectives and procedures of the study prior to each measurement session. All participants gave written informed consent. The study complied with all applicable requirements of US and international regulations, in particular the Helsinki Declaration of 1975 (and subsequent revisions) for investigation of human participants. The Health Research Ethics Committee of the North-West University approved the study.
Hypertension and carotid intima-media thickness outcome assessment
As brachial blood pressure (BP) was assessed both at baseline and at follow-up, we made use of BP change over five years as a continuous variable, but mainly used hypertension (0/1) based on BPs during follow-up. In all adjusted analyses, we included statistical adjustment for antihypertensive medication.
As carotid ultrasound measurements were not performed at baseline, we were unable to assess the change in carotid wall thickness over time. In all statistical analyses we therefore made use of carotid intima-media thickness (cIMT) as a dichotomous variable (0/1) for cIMT < 0.9 mm or ≥0.9 mm.40
Mortality outcome assessment
Fieldworkers contacted participants every three months over the five-year period. The cause of death was obtained from family death certificates and verbal autopsy and coded by a physician according to the International Classification of Diseases codes for the underlying causes. Cardiovascular mortality included all fatal cardiac and stroke events and death noted as ‘due to hypertension (I10)’. Cardiac-related illnesses that caused death included heart failure (I50), myocardial infarction (I21), congestive heart failure (I50.0) or any other cardiac-related reasons. Death due to stroke included any stroke or cerebral vascular incident (I69-I69).
Further details on methodology are described in the online Supplementary Material.
Statistical analyses
We compared means and proportions of the baseline characteristics of survivors and non-survivors by independent t-tests and χ2 tests, respectively. Variables with a non-Gaussian distribution were logarithmically transformed and reported as geometric mean and 5th and 95th percentile intervals (IGF-1, IGFBP-3, glucose, glycated haemoglobin (HbA1c), triglycerides, C-reactive protein (CRP), interleukin-6, γ-glutamyltransferase, estimated creatinine clearance, albumin–creatinine ratio). We used analyses of covariance (ANCOVAs) to compare multivariable-adjusted baseline levels of IGF-1 between cardiovascular outcome categories (normotensive/hypertensive; cIMT < 0.9 mm/≥ 0.9 mm; survival/all-cause mortality and cardiovascular mortality). By using quintiles of baseline IGF-1, we compared proportions of mortality (using χ2 tests) and percentage change in systolic BP (SBP) (%SBP) and cIMT using analyses of variance (ANOVAs) and ANCOVAs. We finally performed multivariable-adjusted Cox-regression analyses to assess the association of baseline IGF-1 with either hypertension, cIMT ≥0.9 mm, and all-cause and cardiovascular mortality. We considered the listed potential covariates for inclusion in regression models based on single regression analyses with the dependent variables and main independent variables: age, gender, locality (urban versus rural), waist circumference, body mass index, body surface area, weight, physical activity index, tobacco and alcohol use, γ-glutamyltransferase, antihypertensive medication, SBP, diastolic BP (DBP), pulse pressure, heart rate, cIMT, carotid cross-sectional wall area, total cholesterol, high-density lipoprotein (HDL)-cholesterol, low-density lipoprotein (LDL)-cholesterol, triglycerides, CRP, interleukin-6, glucose, HbA1c, estimated glomerular filtration rate, creatinine clearance, urinary albumin–creatinine ratio. Regression models were finally adjusted for IGFBP-3, age, sex, locality (urban versus rural), physical activity index, body mass index, tobacco and alcohol use, SBP, glucose, HDL-cholesterol, triglycerides, interleukin-6, creatinine clearance and antihypertensive medication.
Results
When comparing baseline characteristics of survivors and non-survivors (Table 1), we found that non-survivors were older, had higher BP, lower body mass index, and had higher proportions of men and individuals from urban localities. Non-survivors also had elevated inflammatory markers (CRP and interleukin-6), alcohol and tobacco intake and antihypertensive medication use, but there were no differences in IGF-1 (p = 0.50) or IGFBP-3 (p = 0.64). Upon adjustment for IGFBP-3 and potential confounders (Figure 2), the adjusted mean of IGF-1 of survivors (51.5 ng/ml) tended to be higher than in non-survivors (43.2 ng/ml), not reaching statistical significance (p = 0.061).
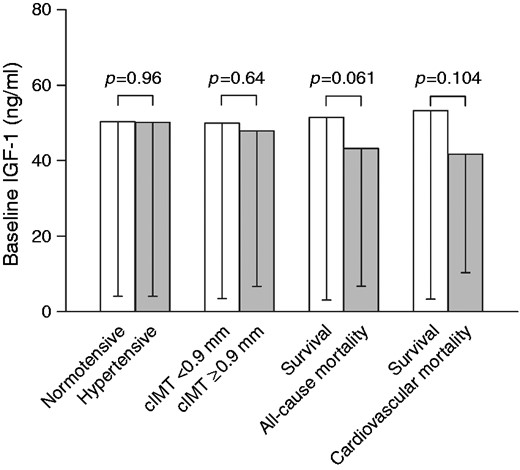
Baseline IGF-1 according to cardiovascular outcome and mortality (adjusted for IGFBP-3, age, sex, locality, physical activity index, body mass index, tobacco and alcohol use, systolic blood pressure, glucose, high-density lipoprotein cholesterol, triglycerides, interleukin-6, creatinine clearance, anti-hypertensive medication).
IGF-1: insulin-like growth factor-1; IGFBP-3: IGF binding protein-3; cIMT: carotid intima-media thickness
Baseline characteristics of Black South African participants.
| Survivors | Non-survivors | p | |
|---|---|---|---|
| N | 922 | 116 | |
| Age, years | 51.6 ± 10.3 | 56.3 ± 11.8 | <0.001 |
| Sex, men, N (%) | 302 (32.7) | 63 (54.3) | <0.001 |
| Locality, urban, N (%) | 412 (44.7) | 65 (56.0) | 0.021 |
| Body mass index, kg/m2 | 25.2 ± 7.00 | 22.7 ± 6.73 | <0.001 |
| Waist circumference, cm | 80.7 ± 13.0 | 79.1 ± 14.5 | 0.26 |
| Systolic blood pressure, mmHg | 135 ± 24.1 | 144 ± 28.4 | <0.001 |
| Diastolic blood pressure, mmHg | 88.3 ± 14.1 | 91.3 ± 16.1 | 0.033 |
| Biochemical variables | |||
| Insulin-like growth factor-1, ng/ml | 48.5 (6.5; 124) | 45.8 (7.20; 111) | 0.50 |
| IGFBP-3, ng/ml | 1353 (91.8; 5677) | 1431 (185; 5150) | 0.64 |
| Glucose, mmol/l | 4.92 (3.50; 7.10) | 4.74 (3.30; 6.70) | 0.12 |
| Glycated haemoglobin, % | 5.67 (4.90; 6.80) | 5.45 (4.50; 6.60) | 0.004 |
| Total cholesterol, mmol/l | 5.23 ± 1.34 | 4.78 ± 1.33 | <0.001 |
| HDL-cholesterol, mmol/l | 1.59 ± 0.62 | 1.56 ± 1.32 | 0.69 |
| Triglycerides, mmol/l | 1.17 (0.57; 2.77) | 1.08 (0.56; 2.35) | 0.079 |
| C-reactive protein, mg/l | 3.16 (0.25; 35.4) | 5.21 (0.43; 53.2) | <0.001 |
| Interleukin-6, pg/ml | 2.80 (0.75; 17.1) | 5.24 (0.75; 33.9) | <0.001 |
| γ-glutamyl transferase, U/l | 55.6 (19.9; 354) | 78.3 (21.0; 488) | <0.001 |
| Creatinine clearance, ml/min | 94.2 (56.3; 168) | 83.6 (39.7; 152) | 0.002 |
| Urinary albumin–creatinine ratio | 0.29 (0.11; 1.07) | 0.33 (0.11; 1.10) | 0.20 |
| Physical activity index | 7.34 ± 1.87 | 6.41 ± 1.85 | <0.001 |
| Self-reported diabetes, N (%) | 12 (1.30) | 1 (0.86) | 0.76 |
| Self-reported tobacco use, N (%) | 487 (52.8) | 78 (67.2) | 0.003 |
| Self-reported alcohol use, N (%) | 377 (40.9) | 61 (52.6) | 0.016 |
| Anti-hypertensive medication, N (%) | 166 (18.0) | 30 (25.9) | 0.042 |
Values are mean ± standard deviation or geometric mean (5th and 95th percentile intervals) for logarithmically transformed variables.
IGFBP-3: insulin-like growth factor binding protein-3; HDL: high-density lipoprotein
We also compared unadjusted and adjusted baseline IGF-1 concentrations between individuals with normotensive and hypertensive blood pressures or those with cIMT < 0.9 mm and ≥ 0.9 mm after five years (Figure 2; Supplementary Table S2). All comparisons indicated similar IGF-1 (unadjusted, partially adjusted and multivariable-adjusted) in these groupings. When dividing our sample into IGF-1 quintiles (Supplementary Table S3), we found that IGFBP-3 also increased along with increasing quintiles (p < 0.001). When viewing cardiovascular outcomes according to quintiles, there were no differences in % change in SBP over five years (p = 0.21), or cIMT (p = 0.94) before and after adjustments for potential confounders. In terms of cardiovascular and all-cause mortality, proportions also did not differ between IGF-1 quintiles (p = 0.29 and 0.67, respectively).
To determine whether baseline IGF-1 (log) concentrations predict cardiovascular outcome, we used multivariable-adjusted Cox-regression analyses, which takes the time to event into account. In Figure 3 we indicate that high IGF-1 predicts lower risk of hypertension (hazard ratio 0.68; 0.49–0.95), all-cause mortality (hazard ratio 0.45; 0.23–0.88) and cardiovascular mortality (hazard ratio 0.26; 0.08–0.83) over five years, becoming more pronounced upon additional adjustment for IGFBP-3. IGF-1 did not predict carotid wall thickness (hazard ratio 0.59; 0.31–1.14). Furthermore, in none of the above models did IGFBP-3 associate significantly with any outcome variable.
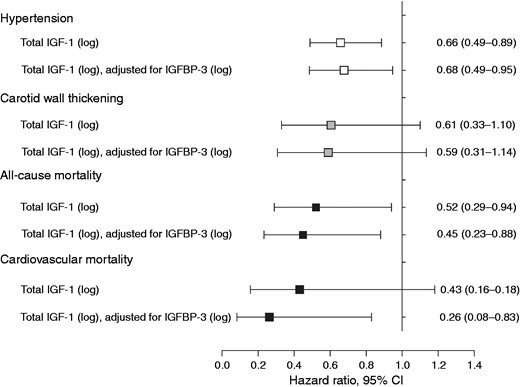
Multivariable-adjusted hazard ratios for hypertension, carotid wall thickening (cIMT≥0.9 mm) and mortality over five years. (Models adjusted for age, sex, locality, physical activity index, body mass index, tobacco and alcohol use, systolic blood pressure, glucose, high-density lipoprotein cholesterol, triglycerides, interleukin-6, creatinine clearance, anti-hypertensive medication.) Data reported as hazard ratio (95% CI).
IGF-1: insulin-like growth factor-1; IGFBP-3: IGF binding protein-3; cIMT: carotid intima-media thickness; CI: confidence interval
Sensitivity analyses
Due to the possible confounding effects of diabetes in IGF-functioning and cardiovascular outcome, we repeated the Cox-regression analyses after removal of 59 participants with HbA1c > 6.5 %. All results remained robust, namely for hypertension (hazard ratio 0.66; 0.47–0.94), all-cause mortality (hazard ratio = 0.45; 0.23–0.87) and cardiovascular mortality (hazard ratio = 0.24; 0.08–0.74). We found no significant association with carotid wall thickness (hazard ratio = 0.54; 0.27–1.10). We also repeated the Cox-regression analyses to determine if IGF-1 predicts incident hypertension over five years. Upon exclusion of participants with hypertension at baseline (N = 592), we found a similar tendency in the hazard ratio, but it was not significant (hazard ratio = 0.82; 0.41–1.65).
Discussion
In a large sample of Black South Africans followed over five years, we found that reduced IGF-1 significantly predicted all-cause and cardiovascular mortality. IGF-1 indicated a protective independent association with hypertension, but was not linked to carotid wall thickness. The majority of Black South Africans, including this population, have a low socio-economic status with one in four of the population unemployed.41 In our cohort (38% without formal education and 39% unemployed) detrimental health behaviours such as excessive alcohol use,42,43 smoking and obesity26,44 are common. These harmful behaviours are known to suppress IGF-1 levels,32–35 resulting in loss of cardiovascular protection.19 In a similar South African population we have found that attenuation of IGF-1 takes place at much younger ages than in Whites,31 which may predispose Blacks to cardiovascular abnormalities at younger ages.
Hypertension
Within our total baseline sample we found that high IGF-1, adjusted for IGFBP-3, was significantly related to having blood pressure in the normotensive range after five years. This is in line with previous cross-sectional findings in Black school teachers, where we reported an independent inverse association between 24-h SBP and IGF-1.6 In Black teachers mean IGF-1 was lower than similarly aged White teachers (137 ng/ml vs. 189 ng/ml, p < 0.001). In the present study we were, however, surprised to note that although IGF-1 seemed rather low in the total population (48.2 (6.50–124) ng/ml), concentrations at baseline were similar between individuals, being normotensive or hypertensive at follow-up, before and after multiple adjustments. This may indicate that viewing IGF-1 as a biomarker in isolation may not be effective to evaluate an individual’s risk for future cardiovascular outcome, possibly since circulating IGF-1 concentrations are not completely indicative of the complex mechanisms involved in maintaining IGF-1 tissue availability. IGF-1 expression and function are affected by growth hormone, other endocrine factors,45 binding proteins, age, ethnicity,46 and genetic47 and environment modulation (such as diet and health behaviours).
Many studies reported on the link between BP and IGF-1. Despite smaller studies reporting hypertensive patients having higher IGF-1 compared with normotensives,1,2 the majority of larger cross-sectional and prospective studies, including this study, confirmed significant inverse associations between BP and IGF-1.3,48–50 We have recently reviewed all papers referring to this relationship and after pooling and re-analysing regression coefficients from all studies, our findings suggested that the relationship between BP and IGF-1 is dependent on, or related to, IGF-1 concentrations, as an expression of direct or reverse causality.4 This was based on the finding that populations with generally low IGF-1 concentrations (such as patients with diabetes, the elderly, hypertensives – similar to the population from the present study) indicated a significant inverse relationship with blood pressure. Healthy populations with IGF-1 in the midranges demonstrate a weak or neutral association with BP,4 which may be explained by a homeostatic balance obtained in maintaining normal BP levels. In conditions with elevated IGF-1, mostly in dysmetabolic states,51,52 it is proposed that a phenomenon of IGF-1 resistance occurs, which may result in a positive association.4
Provided that hypertension is perhaps the most important risk factor for cardiovascular events, such as stroke and myocardial infarction, it is noteworthy to take cognisance of the physiological mechanisms of IGF-1 to induce BP reduction through nitric oxide production, as reflected by intravenous IGF-1 administration.53
Carotid wall thickness
IGF-1 has also been implicated in atherogenesis5,7,24 due to its ability to induce vascular smooth muscle cell proliferation through the MAPK pathway, when its downstream PI3K and MAPK pathways are unbalanced. IGF-1 has previously been considered a promoter of arterial obstructive lesions,54 but experimental models of atherosclerosis show that recombinant IGF-1 infusion causes plaque regression.36 Also, several studies on knock out or hyperexpression of the IGF-1-mediated PI3K-Akt-1 enzymatic pathway clearly show an atheroprotective effect of PI3K activities.55,56
In Black South Africans we found that IGF-1 did not predict increased carotid wall thickness, thereby not supporting the notion that IGF-1 is involved in atherogenesis. The occurrence of hypertension, hypertensive heart disease, heart failure and stroke are common in Black populations, whereas atherosclerosis and coronary heart disease have lower frequency,28 possibly due to favourable lipid profiles.57,58 Whether this may have affected our finding needs to be established in other populations more prone to coronary heart disease.
In a cross-sectional analysis including Black and White school teachers we also failed to find a relationship between cIMT and IGF-1 in Black teachers.6 In White teachers we found a beneficial inverse relationship, confirming previous studies,8,59 but upon adjustment for γ-glutamyltransferase, significance was lost. This may once again confirm the complex mechanisms controlling IGF-1 concentrations but also that IGF-1 is involved in regulating endothelial and vascular smooth muscle cells in a beneficial manner via indirect mechanisms.10
Mortality
In support of our finding that low IGF-1 predicts hypertension – as a precursor of cardiovascular events – we also found low IGF-1 to predict cardiovascular mortality and all-cause mortality. Curiously, when viewing baseline IGF-1 concentrations in survivors and non-survivors, or according to IGF-1 quintiles and cardiovascular outcome, there were no apparent associations. However, the prognostic value of IGF-1 as a continuous variable was very clear in all Cox-regression analyses which take both the time-aspect, as well as numerous co-variates into consideration.
The contrast in results from different studies highlights that clarification on the prognostic value of IGF-1 is needed. The purpose of this study was, however, not to review the literature relating IGF-1 to mortality as we have done regarding the association with blood pressure.4 To briefly summarize: (a) several papers indicate no prognostic value of IGF-1 for cardiovascular and/or all-cause mortality in elderly populations14,16,60,61 and the Third National Health and Nutrition Examination Survey;62 (b) some studies suggest a U-shaped relationship with mortality also in the elderly;13,15,63,64 and (c) a large number of studies support a protective inverse relationship between IGF-1 and mortality11,12,17,65–67 including the Framingham study65 and the present study. Also more recent studies in myocardial infarction, in heart failure11,68,69 and in end stage renal disease or dialysis patients17,70 link low IGF-1 respectively to increased mortality or increased composite of all cause death, recurrent myocardial infarction, and stroke. In contradiction to the above: (d) there are also studies linking high IGF-1 with all-cause mortality in the very elderly.13,71,72 The latter studies suggest that low IGF-1 relates to survival. Due to the proliferative function of IGF-1 linked to cancer,25 it has been suggested that the link between low IGF-1 and survival may be due to protection against cancer as a cause of mortality.73
There are no easy means to understand these contradictory associations between IGF-1 and mortality, but future studies are encouraged to investigate the possibility that the association is based on the IGF-1 concentration of the population studied. As mentioned earlier, we have found the concentration to be important in understanding the contradictory findings between IGF-1 and BP.4 The Black population of the present study exhibited particularly low mean IGF-1 concentrations, which may indicate that this cardiovascular protective peptide is likely suppressed by poor health behaviours such as poor diets, smoking and excessive alcohol use.26,42,43 We have also found previously that interleukin-6 significantly predicts cardiovascular and all-cause mortality in this population.74 A four-year prospective study done in haemodialysis patients (N = 96)17 indicated that patients with a combination of low IGF-1 and high interleukin-6 were particularly at risk for both all-cause and cardiovascular mortality. In light of these results, we suggest that the whole demographic, behavioural and biochemical phenotype of individuals should be accounted for when reviewing the prognostic value of IGF-1.
Our findings should be interpreted in consideration of the limitations of this study. These include the lack of data on growth hormone and other binding proteins, cIMT data at baseline, or follow-up data of circulatory levels of IGF-1 and IGFBP-3. Our baseline sample consisted of 592 hypertensives, which made it difficult to investigate incident hypertension over five years. Our specific population of Black South Africans has certain attributes which may be unique, especially due to associated exposures of this poverty-stricken group. Finally, residual confounding cannot be excluded, although our results remained consistent after multiple adjustments. This study adds to the limited availability of longitudinal studies on mortality in sub-Saharan Africa.
To our best knowledge this is the first prospective study in a large Black population indicating a protective independent association between IGF-1 and hypertension, cardiovascular and all-cause mortality over a period of five years. Despite suggestions that IGF-1 is involved in atherogenesis, we found IGF-1 to have no prognostic value for carotid wall thickness in our population. More research is needed to determine whether IGF-1 concentration, low IGF-1 bioavailability, resistance to IGF-1 and the complex interplay between IGF-1, inflammation and vasoactive hormones affect the observed associations between IGF-1 and mortality.
Author contribution
AES was responsible for the conception, design and analyses of the work and drafted the manuscript. AES, CMCM, WS, RK, SB, LG, HWH contributed to the acquisition of the data. All critically interpreted, reviewed and revised the manuscript, and gave final approval and agree to be accountable for all aspects of the work ensuring integrity and accuracy.
Acknowledgements
The authors would like to thank all supporting staff and the participants of the PURE study:
1. PURE–South Africa: The PURE-NWP-SA research team, field workers and office staff at the North-West University, South Africa.
2. PURE International: The PURE project office staff at the Population Health Research Institute (PHRI), Hamilton Health Sciences and McMaster University, ON, Canada.
Declaration of conflicting interests
The author(s) declared no potential conflicts of interest with respect to the research, authorship, and/or publication of this article.
Funding
The author(s) disclosed receipt of the following financial support for the research, authorship, and/or publication of this article: South Africa Netherlands Research Programme on Alternatives in Development, North-West University, Population Health Research Institute, South African Medical Research Council, Roche Diagnostics (South Africa), South African National Research Foundation (NRF). Any opinion, findings, and conclusions or recommendations expressed in this material are those of the authors, and therefore, the NRF do not accept any liability in regard thereto.

Comments