


Abstract
Chronic kidney disease (CKD) is frequent in patients with cardiovascular (CV) disease and impacts prognosis in these subjects. While current guidelines recommend the CKD-EPI equation for the estimated glomerular filtration rate (eGFR) and recognizing CKD, a new creatinine-based equation – the Berlin Initiative Study-1 (BIS-1) – was generated for elders with a high prevalence of CV disease. We assessed whether BIS-1 provided more accurate risk stratification than the CKD-EPI equation in unselected aged patients with CV disease.
Patients aged ≥70 years who were seen consecutively at the Cardiovascular Centre of Trieste (Italy) between November 2009 and October 2013 were recruited into this study. The correlation and agreement between the BIS-1 and CKD-EPI formulas were evaluated and intra-class correlation coefficients (ICCs) were computed in order to estimate the correlation between the two formulas. Patients were followed for all-cause death, composite outcomes of all-cause death/all-cause hospitalization and all-cause death/CV hospitalization.
A total of 7845 subjects met the inclusion criteria for this study. GFR as estimated with the BIS-1 and the CKD-EPI equation was highly correlated (ICC: 0.81; 95% confidence interval [CI]: 0.79–0.82; p < 0.0001). When allocating patients in Kidney Disease Improving Global Outcomes classes of eGFR, compared to CKD-EPI, the BIS-1 formula reclassified 2720 (34.7%) patients: 53 (1.9%) were placed in a better class and 2667 (98.1%) were placed in a worse class. Multivariable Cox models showed that BIS-1 compared to CKD-EPI had a significantly better accuracy for predicting death (NRI: 0.12; 95% CI: 0.03–0.19; p = 0.001), death/CV hospitalization (net reclassification improvement [NRI]: 0.34; 95% CI: 0.27–0.38; p < 0.001) and death/all-cause hospitalization (NRI: 0.14; 95% CI: 0.06–0.21; p = 0.001).
The BIS-1 formula is better than the CKD-EPI formula for risk stratification of CKD in elderly people with CV disease.
Introduction
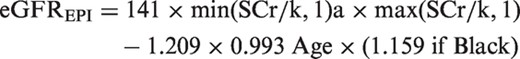
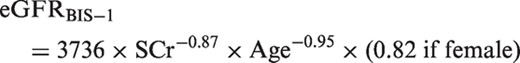
Chronic kidney disease (CKD) is frequent in patients with cardiovascular (CV) disease and is a powerful adverse prognostic factor.1–3 A proper assessment of kidney function has several clinical implications for patients with CV disease, including alterations to diagnostic testing and management programs, the timely involvement of nephrologists and preoperative risk evaluation in the case of surgery. This is especially true for older adults, a population with a high prevalence of both CV disease and CKD. In accordance with current clinical guidelines, the diagnosis of CKD should be reported if the estimated glomerular filtration rate (eGFR) is less than 60 mL/min/1.73 m2. This value is associated with drug toxicity, endocrine and metabolic complications and risk for CV events and death.4 For reporting eGFR in adults, the current guidelines recommended using the 2009 CKD-EPI creatinine equation, which incorporates information for age, sex and race, in addition to serum creatinine levels.5 A recent report comparing CKD-EPI-generated eGFR (eGFREPI) against the measured GFR gold standard demonstrated that the eGFREPI estimation is just as satisfactory in older people as has been reported in younger individuals6; however, in the original CKD-EPI cohort, the mean age was 47 years (with only 13% being older than 65 years) and the underlying risk for CV adverse events was unknown in all but the 29% of patients with diabetes. In 2012, a new creatinine-based equation, the Berlin Initiative Study-1 (BIS-1), developed in community-living white German elders who were aged 70 years or older with a high prevalence of CV disease or CV risk factors, showed good agreement with directly measured GFR.7 External validation Studies comparing the performances of the BIS-1 and CKD-EPI equations in terms of estimating GFR in older patients who were enrolled in nephrology clinics and the community confirmed the good results reported in the original cohort.8–10 However, it is not known whether the use of the new formula results in superior clinical risk categorization. Accordingly, we designed the present study to assess whether the BIS-1 equation provided more accurate risk stratification than the CKD-EPI equation in unselected aged patients with CV disease.
Methods
Patients aged 70 years or older who were consecutively seen at the Cardiovascular Centre of Trieste (Italy) between November 2009 and October 2013 for their scheduled cardiology evaluations were recruited in this study. This represents the elderly subgroup from a larger cohort of Trieste patients included in the “Trieste Registry of Cardiovascular Diseases” that has been previously reported11 – details of data collection and visit frequency and the definitions of all of the clinical variables were given in that paper (and are available as an online supplement to this paper). Subjects who were treated with dialysis or who underwent kidney transplantation were excluded from the present analysis.
Estimation of GFR
Outcome assessment
Patients were followed from their index date until October 31, 2013, for: a) all-cause mortality; b) a composite outcome of all-cause mortality or all-cause hospitalization; and c) a composite CV outcome of all-cause mortality or hospitalization for CV events. CV hospitalization was automatically derived from the hospital registry of the discharge diagnosis according to the presence of CV diagnosis-related groups.
Statistical analysis
Correlation and agreement between the BIS-1 and CKD-EPI formulas were evaluated using the Bland–Altman method.12 Intra-class correlation coefficients (ICCs) were computed in order to estimate numerically the correlation between the two formulas. In accordance with Kidney Disease Improving Global Outcomes (KDIGO) guidelines,4 we categorized eGFR into: ≤90, 60–89, 45–59, 30–44 and <30 mL/min/1.73 m2. A 5 × 5 cross-tabulation of eGFREPI and eGFRBIS-1 categories was created for the computation of the proportion of participants in each category of eGFREPI that was reclassified by eGFRBIS-1. The baseline characteristics of the population were compared across reclassification status by the BIS-1 equation (reclassified upward to a higher eGFR category, not reclassified or reclassified downward to a lower eGFR category); continuous data were presented as median and interquartile ranges (IQRs) and discrete parameters were reported as counts and percentages. The analysis of variance test or the Brown–Forsythe test were calculated in order to compare mean values of continuous parameters across groups according to the presence or absence of variance in homogeneity; post-hoc comparisons were calculated by using the Bonferroni or Tamhane correction as appropriate. For non-Gaussian continuous parameters, the median test was computed. The Chi-square test was used for discrete parameters. Unadjusted and adjusted hazard ratios were estimated in order to directly assess the effect of the reclassification status on the outcomes by means of Cox uni- and multi-variable regression models, adjusting for sex, prior myocardial infarction, heart failure, peripheral artery disease/stroke, diabetes and persistent/permanent atrial fibrillation. Kaplan–Meier survival curves were estimated and plotted in order to visually represent the effect of the reclassification status on outcomes. Finally, net reclassification improvement (NRI) for survival data was estimated using the R library “survIDINRI” by comparing the predicted risks as estimated by pairs of Cox multivariable models using CKD-EPI classes and BIS-1 classes, respectively; the event horizon was fixed at 24 months of follow-up for each model; NRI results are presented by computing the average NRI (1/2 NRI; i.e. the average value between NRIs for events and non-events).13 Moreover, time-dependent receiver–operator characteristic (ROC) areas under the curve (AUCs) for censored data were also computed for the same time horizon and compared by using the R library “timeROC”. All statistical analyses were performed by using the IBM SPSS statistical package (version 19) and the R software (version 3.1.2).
Results
Among the 12,394 patients enrolled in the “Trieste Registry of Cardiovascular Diseases” who met the criteria for being included in the analysis, 7845 subjects were 70 years of age or older and represented the final study population. GFR as estimated with the BIS-1 and CKD-EPI equations was highly correlated (ICC: 0.81; 95% confidence interval [CI]: 0.79–0.82; p < 0.0001) (Figure 1), and the agreement was particularly strong for eGFR values below 60 mL/min/1.73 m2 (ICC: 0.90; 95% CI: 0.89–0.91; p < 0.0001). The distributions of eGFR according to the CKD-EPI and BIS-1 equations were similar between males and females (see Supplemental Figure 1). However, a systematic difference was found between the two formulas, with the BIS-1 mean value of 8.9 mL/min being lower than that of CKD-EPI (95% limits of agreement: +3.4 to –21.3). The distribution of patients in terms of the KDIGO classes of the eGFR changed accordingly, showing an overall shift to worse classes with lower eGFR using the BIS-1 equation (Figure 2). The distribution changed in the same way in females and males (see Supplemental Figure 1). Compared to CKD-EPI, the BIS-1 formula reclassified 2720 (34.7%) patients (see Supplemental Table 1): 2667 (98.1%) were reclassified to a lower eGFR category (i.e. a higher-risk group) and the remaining 53 patients (1.9%) were placed in a higher eGFR category (thus being reclassified to a lower-risk group). Notably, 1573 patients (20.1%) who were classified as not having CKD with the CKD-EPI formula were reclassified as having eGFR <60 mL/min with the BIS-1 formula; consequently, when using BIS-1 instead of CKD-EPI, the prevalence of CKD in our cohort rose from 35.4% to 55.5%. The characteristics of patients with concordant or reclassified eGFR categories are summarized in Table 1.
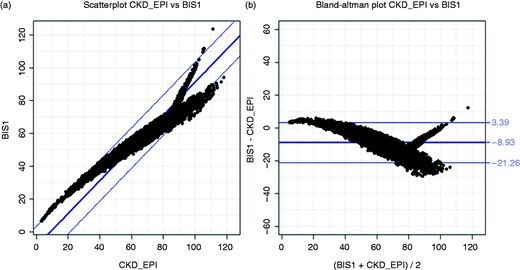
Correlation and agreement between BIS-1 and CKD-EPI formulas: scatterplot (A) and Bland–Altman analysis (B).
BIS-1: Berlin Initiative Study-1.
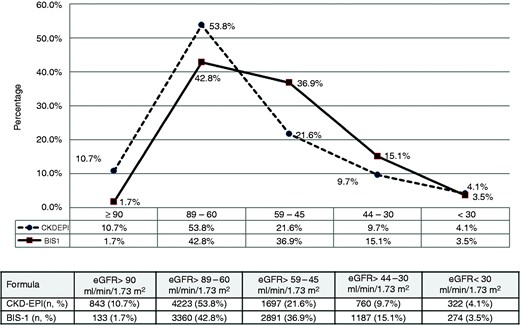
Distribution of eGFR classes according to the CKD-EPI and BIS-1 equations.
BIS-1: Berlin Initiative Study-1; eGFR: estimated glomerular filtration rate.
Characteristics of 7845 study patients divided according to the concordance or discordance between estimated glomerular filtration rate based on the Berlin Initiative Study-1 equation and the CKD-EPI equation.
| GFR | |||||
|---|---|---|---|---|---|
| Variable | Total (n = 7845) | Reclassified upward (n = 53) | Concordant (n = 5125) | Reclassified downward (n = 2667) | p-value |
| Clinical | |||||
| Age, median (Q1–Q3)a,b | 79 (74–84) | 76 (72–82) | 78 (74–83) | 80 (76–85) | <0.0001 |
| Femalea | 3998 (51%) | 23 (43.4%) | 2748 (53.6%) | 1227 (46.0%) | <0.0001 |
| Charlson Index, median (Q1–Q3)a,b,c | 2 (1–4) | 5 (4–7) | 2 (1–4) | 2 (0–3) | <0.0001 |
| GUCH | 114 (1.5%) | – | 79 (1.5%) | 35 (1.3%) | NS |
| Coronary artery diseaseb,c | 3145 (40.1%) | 31 (35.8%) | 2076 (40.5%) | 1038 (38.9%) | 0.009 |
| Myocardial infarctiona,b,c | 1404 (17.9%) | 19 (35.8%) | 944 (18.4%) | 441 (16.5%) | <0.0001 |
| Heart failurea,b,c | 1395 (17.8%) | 18 (33.9%) | 947 (18.5%) | 430 (16.1%) | <0.0001 |
| Valve heart diseaseb,c | 1910 (24.3%) | 22 (41.5%) | 1237 (24.1%) | 651 (24.4%) | 0.01 |
| Atrial arrhythmiasb | 2667 (34.0%) | 20 (37.7%) | 1723 (33.6%) | 924 (34.6%) | NS |
| Atrial fibrillation | 1036 (13.2%) | 5 (9.4%) | 641 (12.5%) | 390 (14.6%) | NS |
| LV hypertrophy | 3006 (38.3%) | 23 (43.4%) | 1959 (38.2%) | 1024 (38.4%) | NS |
| PAD/strokeb,c | 1766 (22.5%) | 20 (37.7%) | 1145 (22.3%) | 601 (22.5%) | 0.02 |
| Very high CV riska,b,c | 5117 (65.2%) | 43 (81.1%) | 3371 (65.8%) | 1703 (63.8%) | 0.01 |
| Hypertensionb,c | 6281 (80.1%) | 51 (96.2%) | 4102 (80.0%) | 2128 (79.8%) | 0.01 |
| Diabetesa,b,c | 2372 (30.2%) | 32 (60.4%) | 1584 (30.9%) | 756 (28.3%) | <0.0001 |
| Smokers | 507 (6.5%) | 3 (5.6%) | 333 (6.5%) | 171 (6.4%) | NS |
| Dyslipidemiaa | 5023 (64.0%) | 38 (71.7%) | 3353 (65.4%) | 1632 (61.2%) | 0.001 |
| Anemiaa,b,c | 1385 (17.7%) | 22 (41.5%) | 967 (18.9%) | 396 (14.8%) | <0.0001 |
| Neoplasia | 915 (11.7%) | 5 (9.4%) | 614 (12.0%) | 296 (11.1%) | NS |
| Drugs potentially affecting renal function | |||||
| ACE-i/ARB | 5116 (65.2%) | 36 (67.9%) | 3328 (64.9%) | 1752 (65.7%) | NS |
| Anti-aldosterone agentsa,b,c | 532 (6.8%) | 11 (20.7%) | 367 (7.1%) | 154 (5.7%) | <0.0001 |
| Digoxin | 705 (9.0%) | 7 (13.2%) | 445 (8.7%) | 253 (9.5%) | NS |
| Furosemidea,b,c | 2183 (27.8%) | 32 (60.4%) | 1483 (28.9%) | 668 (25.0%) | <0.0001 |
| Other diureticsb,c | 2073 (26.4%) | 8 (15.1%) | 1356 (26.4%) | 709 (26.6%) | NS |
p < 0.05 concordant versus worse.
p < 0.05 better versus worse.
p < 0.05 concordant versus better.
GFR: glomerular filtration rate; Q1–Q3: interquartile range; GUCH: grown-ups with congenital heart defects; NS: non-significant; LV: left ventricle; PAD: peripheral artery disease; CV: cardiovascular; ACE-I: angiotensin-converting enzyme inhibitor; ARB: angiotensin receptor blocker.
Outcomes
The prognosis was known in 7787 patients, being equal to 99.3% of the entire cohort. The median duration of follow-up to death or censoring was 25 months (IQR: 13–36 months), to death or CV hospitalization or censoring was 20 months (IQR: 8–32 months) and to death or all-cause hospitalization or censoring was 14 months (IQR: 5–26 months). Over the follow-up period, 883 deaths (11% of the total study population), 2200 deaths or hospitalizations for CV causes (28%) and 3771 deaths or all-cause hospitalizations (48%) occurred. As expected, we observed a linear relationship between death and severity of renal impairment, while a non-linear distribution (J curve) was observed for composite outcomes. However, given the high prevalence of mild to moderate CKD, the largest number of events occurred in KDIGO classes II–III (Figure 3). The distribution of events according to eGFR classes was similar between females and males (see Supplemental Figure 2A and 2B).
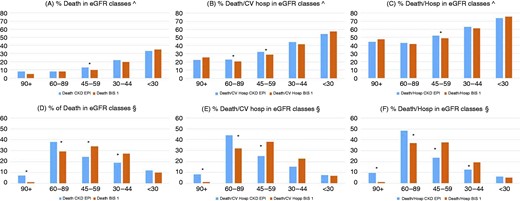
Distribution of events according to eGFR classes. The relationship between death and severity of renal dysfunction was linear, whereas a non-linear distribution (J curve) was observed for composite outcomes. In (A–C), percentages are calculated with respect to the number of patients in each eGFR class, whereas in (D–F), percentages are calculated with respect to the total number of events. In consideration of the high prevalence of mild to moderate chronic kidney disease grade, the largest number of events in the entire cohort is registered in Kidney Disease Improving Global Outcomes classes II–III, and BIS-1 has led to a better allocation of events in accordance with the degree of impairment in renal function compared to CKD-EPI.
*Significant differences in proportions.
BIS-1: Berlin Initiative Study-1; eGFR: estimated glomerular filtration rate; CV hosp: cardiovascular hospitalization.
Categorization based on the BIS-1 formula more accurately predicted events than classification based on the CKD-EPI equation (Table 2). The NRIs for survival data derived from the comparisons of predicted risks from multivariable Cox models by using CKD-EPI classes or BIS-1 classes, respectively (adjusted for sex, prior myocardial infarction, heart failure, peripheral artery disease/stroke, diabetes and persistent/permanent atrial fibrillation) showed that, compared to CKD-EPI, BIS-1 had a significantly better accuracy for death (average NRI: 0.12; 95% CI: 0.03–0.19; p = 0.001) and for the prediction of composite outcomes: death or CV hospitalization (average NRI: 0.34; 95% CI: 0.27–0.38; p < 0.001) and death or all-cause hospitalization (average NRI: 0.14; 95% CI: 0.06–0.21; p = 0.001). Time-dependent ROC AUCs for the model with CKD-EPI classes were 0.70 (95% CI: 0.68–0.73) for death, 0.67 (95% CI: 0.66–0.70) for death or CV hospitalization and 0.63 (95% CI: 0.61–0.65) for death or all-cause hospitalization. For the model with BIS-1 classes, we obtained 0.70 (95% CI: 0.68–0.72) for death, 0.69 (95% CI: 0.67–0.70) for death or CV hospitalization and 0.64 (95% CI: 0.62–0.65) for death or all-cause hospitalization. No significant differences between the two time-dependent AUCs was observed for death (p = 0.941); instead, borderline significance was obtained for death or CV hospitalization (p = 0.046) and for death or all-cause hospitalization (p = 0.061). It has to be noted here that the AUC hardly moves after a few good risk factors are included in the model, and this is the main reason why the NRI has been introduced (13). Kaplan–Meier survival curves according to the state of renal function for death (Supplemental Figure 3), death or CV hospitalization (Supplemental Figure 3B) and death or all hospitalization (Supplemental Figure 3C) are provided.
Events at follow-up in patients grouped according to concordance and discordance between estimated glomerular filtration rate based on the Berlin Initiative Study-1 equation with respect to the CKD-EPI equation.
| Criterion | Total | CKD-EPI and BIS-1 > 60a | BIS-1 <60 but CKD-EPI >60 | CKD-EPI and BIS-1 <60 |
|---|---|---|---|---|
| Patients, n (%) | 7787 (100%) | 3448 (44.8%) | 1573 (20.2%) | 2766 (35.5%) |
| Death, n (%)* | 883 (11.3%) | 261 (7.6%) | 142 (9%) | 480 (17%) |
| Unadjusted HR (95% CI) | 1 | 1.20 (0.98–1.47) | 2.35 (2.02–2.74) | |
| p-value | – | 0.08 | <0.0001 | |
| Adjusted HRb (95% CI) | 1 | 1.13 (0.92–1.39) | 2.01 (1.72–2.35) | |
| p-value | – | 0.134 | <0.0001 | |
| Death or CV hospitalization (%)* | 2200 (28.3%) | 724 (21.0%) | 428 (27%) | 1048 (38%) |
| Unadjusted HR (95% CI) | 1 | 1.35 (1.20–1.53) | 2.01 (1.82–2.20) | |
| p-value | – | <0.0001 | <0.0001 | |
| Adjusted HRb (95% CI) | 1 | 1.26 (1.11–1.42) | 1.69 (1.53–1.86) | |
| p-value | – | <0.0001 | <0.0001 | |
| Death or all-cause hospitalization (%)* | 3761 (48.3%) | 1432 (41.5%) | 744 (47%) | 1585 (57%) |
| Unadjusted HR (95% CI) | 1 | 1.18 (1.08–1.30) | 1.58 (1.47–1.69) | |
| p-value | – | <0.0001 | <0.0001 | |
| Adjusted HRb (95% CI) | 1 | 1.12 (1.03–1.22) | 1.40 (1.33–1.53) | |
| p-value | – | 0.012 | <0.0001 |
BIS-1: Berlin Initiative Study-1; CV: cardiovascular; HR: hazard ratio; CI: confidence interval.
p < 0.0001.
Reference group for adjusted HRs: CKD-EPI and BIS-1 >60 mL/min/1.73 m2.
Adjusted for gender, prior myocardial infarction, heart failure, peripheral artery disease/stroke, diabetes and persistent/permanent atrial fibrillation.
Discussion
To our knowledge, this is the first study to evaluate the clinical impact of the new eGFR formula BIS-1 on estimates of prevalence and prognosis in elderly individuals with heart disease. In this large “real-life” cohort of CV disease outpatients aged 70 years or older, approximately 35% of participants were reclassified to a different KDIGO stratum (virtually all into lower eGFR categories) if the BIS-1 equation was used in place of the CKD-EPI equation, with the prevalence of CKD increasing from 35.4% to 55.5%. We also found that categorization based on the BIS-1 formula significantly improved risk prediction for mortality, all-cause hospitalizations and CV hospitalizations.
While taking into consideration the different case mix and study design, with particular reference to the older age of our patients and the presence of any CV disease, our results mirror those that have been reported in the literature: in the original group of 570 German community-dwelling subjects (mean age: 78.5 years; 42.8% female), BIS-1 classified 55 more participants (approximately 10%) to an eGFR of <60 mL/min/1.73 m2 than did the CKD-EPI and showed better precision and excellent agreement with measured GFR.7 In the external validation study by Koppe et al. in a cohort of 224 white patients aged over 70 years (mean age: 75.3 ± 4.1 years; 42.8% female; 21.9 diabetics) and who were referred to a nephrology clinic in order to undergo inulin clearance for suspected or established renal dysfunction, the BIS-1 equation found 17 (nearly 8%) more patients than the CKD-EPI equation as having an eGFR of <60 mL/min/1.73 m2, with excellent accuracy and precision in patients with measured GFR of >30 mL/min/1.73 m2.8 In an English group of 394 white people aged 74 years or older (median age: 80 years [IQR: 74–97]) consisting of patients known to the Kent Kidney Care Centre or residents of the local population, Alshaer et al. found that the BIS-1 equation was negatively biased (i.e. underestimated) compared to measured GFR, especially in those with a GFR of >60 mL/min/1.73 m2; however, the equation demonstrated good precision and percentages of estimates within 30% of measured GFR (P30) values.9 In a community cohort of 95 individuals aged 80 years and older (mean age: 85.3 ± 4.3 years; 70% women; 93% Caucasian), Lopes et al. showed that the BIS-1 equation underestimated the measured GFR, but outperformed CKD-EPI and Modification of Diet in Renal Disease (MDRD) in terms of precision.10 In 805 adults enrolled in the community-based AGES-Reykjavik Study (mean age: 80.3 ± 6.4 years; 45.9% female; 23.6% with diabetes), the prevalence rates of CKD as defined as measured GFR <60 mL/min/1.73 m2 using the CKD-EPI and BIS-1 formulas were 39.0%, 34.8% respectively. The CKD-EPI compared with BIS-1 had lower bias, but also showed a lower P30 and the same precision.14 As recently highlighted in a systematic review,15 neither the CKD-EPI nor the MDRD study equation16 are optimal for all populations and eGFR ranges, and the performance of any eGFR formula depends on the type of population studied.17 The study population from which the MDRD equation was created did not include persons aged >70 years and was developed in a cohort of CKD patients with substantial impairment of renal function (mean GFR: 40 mL/min/1.73 m2). The CKD-EPI creatinine equation was derived and validated in a broader set of patients with better renal function (mean GFR: ∼65–70 mL/min/1.73 m2), but with a mean ages of 47 ± 15 years, including very few elderly people (approximately 4–8% of the total patients) or patients with CV disease.5,6,8 The BIS-1 equation was generated in a set of community patients with a mean age of 78.5 years and mild to moderate CKD (mean GFR: 60.3 mL/min/1.73 m2), a quarter of whom had diabetes, more than three-quarters of whom had hypertension and nearly a quarter of whom had suffered a myocardial infarction or stroke,7 making this a fundamentally similar population to that which is seen in cardiac outpatient clinics in current clinical practice. Such considerations may largely explain why BIS-1 better prognosticates clinical outcomes in our elderly patients with CV disease than the CKD-EPI equation.
In very old people, the accuracy of eGFR is uncertain due to the complex relationship between the physiological decline in renal function, the amount of muscle mass and the amount of dietary protein intake, all of which influence serum creatinine levels.17–20 Although in a recent meta-analysis15 CKD-EPI better predicted the risk for adverse clinical events than MDRD, its accuracy was lower in individuals who were older than 65 years. Furthermore, a paradoxically increased mortality at higher eGFR levels was evident after age adjustment,20 suggesting that the CKD-EPI equation does not fully overcome the limitations that are inherent to creatinine-based eGFR equations. This impression was confirmed in the Cardiovascular Health Study,21,22 in which community-dwelling elderly subjects aged >65 years or older with eGFREPI ≥90 mL/min/1.73 m2 presented with a higher prevalence of frailty – a functional status that is characterized by loss of muscle mass (sarcopenia) – compared to those with eGFREPI between 60 and 89 mL/min/1.73 m2. Observational studies evaluating GFR by means of cystatin, a marker of kidney function that is not affected by muscle mass, have shown that the development of frailty is directly proportional to the degree of impairment in renal function, and a state of pre-frailty is frequent in middle-aged patients with mild to moderate renal dysfunction.23 Frailty is an ominous functional state that is particularly frequent in elderly patients with CV disease, especially if CV disease is coexistent with renal dysfunction.24–28 Our data suggest that the BIS-1 equation is particularly accurate for risk prediction in this setting of patients.
Limitations and strengths of the study
Our investigation has several limitations. First, we have not measured the eGFR in our patients, so we cannot assess the degree of accuracy and precision of eGFREPI and eGFRBIS-1 against a direct GFR measure; we can only assess the degree of correlation between their estimates. Second, the observation period is long, and in the present study, the estimated renal function is based on a single sample of creatinine. As confirmation of the diagnosis of CKD requires at least two samples of creatinine within 3 months, we cannot exclude the possibility that some patients may have had fluctuations in renal function. Clinical evidence from patients with heart failure28 shows that this phenomenon exists, but the number of patients with CKD who significantly improve in terms of renal function during such a time period is very limited. The strengths of our study include the very large number of participants of both genders who were unselected and considered consecutively, the relatively long duration of the follow-up period, the complete nature of the dataset and the ability to adjust for several CV risk factors and potential confounders.
Conclusions
Our data confirm that the BIS-1 formula is better than the CKD-EPI formula for the risk stratification of CKD in elderly people with CV disease. Use of the BIS-1 formula could improve the management of individual patients through the earlier detection of CKD, the earlier involvement of nephrologists and the more careful prescription of drugs and procedures with a contrast medium.
Declaration of conflicting interests
The author(s) declared no potential conflicts of interest with respect to the research, authorship and/or publication of this article.
Funding
The author(s) received no financial support for the research, authorship and/or publication of this article.
Disclosures
The authors take responsibility for all aspects of the reliability and freedom from bias of the data presented and their discussed interpretation.
Authorship
All authors have made substantial contributions to the article. Their particular roles were as follows.
L Tarantini and G Cioffi: conception, design of the study, analysis and interpretation of data and drafting the article.
G Pulignano: conception, design of the study and revising it critically for important intellectual content.
G Barbati: statistical analysis and interpretation of data.
FA McAlister: conception, design of the study and revising it critically for important intellectual content.
JA Ezekowitz: conception, design of the study and revising it critically for important intellectual content.
A Cherubini: conception, acquisition of data, design of the study, and revising it critically for important intellectual content.
P Faggiano: conception, design of the study and revising it critically for important intellectual content.
EG Franceschini: conception, design of the study and revising it critically for important intellectual content.
A Di Lenarda: conception, acquisition of data, design of the study and revising it critically for important intellectual content.
All authors have approved the final version of the article.

Comments