


Abstract
To simplify the assessment of the recording and control of coronary heart disease risk factors in different countries and regions.
The SUrvey of Risk Factors (SURF) is an international clinical audit.
Data on consecutive patients with established coronary heart disease from countries in Europe, Asia and the Middle East were collected on a one-page collection sheet or electronically during routine clinic visits. Information on demographics, diagnostic category, risk factors, physical and laboratory measurements, and medications were included and key variables summarized in a Cardiovascular Health Index Score.
Coronary heart disease patients (N = 10,186; 29% women) were enrolled from 79 centres in 11 countries. Recording of risk factors varied considerably: smoking was recorded in over 98% of subjects, while about 20% lacked data on laboratory measurements relevant to cardiovascular disease risk. Sixteen per cent of participants reported smoking, 29% were obese, and 46% had abdominal obesity. Sixty per cent of participants had blood pressure <140/90 mmHg (140/80 mmHg for diabetics), 48% had HbA1c<7%, 30% had low-density lipoprotein <1.8 mmol/l and 17% had a good cardiovascular health index score. There were substantial regional variations. Less than 3% of patients attended cardiac rehabilitation in Asia or the Middle East, compared with 45% in Europe. In Asia, 15% of patients had low-density lipoprotein cholesterol <1.8 mmol/l compared with 33% in Europe and 36% in the Middle East. Variations in medications were noted, with lower use of statins in Asia.
SURF proved to be practical in daily practice. Results indicated poor control of risk factors with substantial variation between countries, calling for development and implementation of clinical standards of secondary prevention of coronary heart disease.
Introduction
Cardiovascular disease (CVD), particularly coronary heart disease (CHD), is the biggest cause of death worldwide.1 Although cardiovascular death rates have declined in some high-income countries, rates of CHD have risen significantly in low- and middle-income countries.2 The major risk factors for CHD are known, and there is good evidence that controlling them reduces morbidity and mortality.3
The main purpose of CHD prevention is the control and management of modifiable risk factors. Explicit, evidence-based guidelines exist to assist health care professionals with risk factor management.4 Despite this, most studies report poor risk factor control even in high-risk patients with established CHD.5–9
EUROASPIRE is the best-known audit of risk factors in CHD patients in Europe. It obtains detailed information in a standardized manner.6–8,10 It does, however, require considerable resources from participating centres, including additional staff and a dedicated clinic, which may reduce the number of centres able to participate thus limiting the representativeness of the data. To complement EUROASPIRE, the SURF (SUrvey of Risk Factors) audit was developed in collaboration with the European Association for Cardiovascular Prevention and Rehabilitation. It is designed to be undertaken as part of routine clinic visits. The feasibility of SURF was tested in a pilot study conducted in seven countries, which demonstrated that the audit was indeed quick to perform.9 This led to SURF I, which assesses risk factor recording and management in 11 countries from Europe, Asia and the Middle East.
Methods
Study setting and population
The SURF audit was carried out between 2012 and 2013 in 11 countries across three regions: Europe (Belgium, Croatia, Denmark, Ireland, Italy, Northern Ireland, Romania, Russia), the Middle East (Saudi Arabia), and Asia (Taiwan and China) (Table 1). Consecutive CHD patients aged ≥18 years were recruited from cardiology outpatient clinics in participating centres (see Supplementary Material online, Appendix part A).
Participating countries and centres in SUrvey of Risk Factors I.
| Country | Region | Number of centres | Number of patients |
|---|---|---|---|
| Belgium | Europe | * | 604 |
| Croatia | Europe | 9 | 1514 |
| Denmark | Europe | * | 300 |
| Ireland | Europe | 11 | 1826 |
| Italy | Europe | 19 | 1223 |
| Northern Ireland | Europe | 2 | 166 |
| Romania | Europe | 8 | 625 |
| Russia | Europe | 8 | 464 |
| Saudi Arabia | Middle East | 5 | 1580 |
| China | Asia | 11 | 1150 |
| Taiwan | Asia | 4 | 734 |
| Total | 79 | 10,186 | |
: Centre information is not available; it will be counted as one single centre.
Data collection and management
Information on demographics, diagnostic category, risk factors, physical and laboratory measurements and medications was obtained by following a standardized procedure and recorded on a one-page data collection sheet (Supplementary Appendix part B). Details on collected data are given in Table 2.4,11
Information and definition of collected data, SUrvey of Risk Factors I.
| Demographic information |
| Age: >18 years old; gender: men and women |
| Risk factors |
| Smoking history: current smoker; ex-smoker: quit smoking more than six months ago; non-smoker |
| Physical activity: less, more, and equal to recommended level (30 min of moderately vigorous activity three to five times a week) |
| Family history: a first-degree relative with a history of atherosclerotic CVD before age 55 years for a male or 65 years for a female. |
| History of hypertension, dyslipidaemia, or diabetes and cardiac rehabilitation attendance: self-reported |
| Diagnostic category |
| CABG; PCI; ACS; SAP |
| ACS: indicates cardiac chest pain at rest with objective evidence of acute ischaemia or infarction; SAP: clinical angina with objective confirmation from a clearly positive exercise ECG or ischaemia on perfusion imaging, or a coronary angiogram showing a narrowing of 70% or more in at least one coronary artery |
| Physical measurements |
| Systolic/diastolic blood pressure, heart rate, height/weight, and waist circumference measurements on the day. BMIa: calculated by height and weight. The BMI categories were as follows: underweight<18.5 kg/m2, normal weight 18.5–24.9 kg/m2, overweight 25–29.9 kg/m2, obese I 30–34.9 kg/m2, obese II 35–39.9 kg/m2, obese III ≥40 kg/m2.11 |
| Abdominal obesity defined as waist circumference ≥ 88 cm in women and ≥102 cm in men.11 |
| Laboratory measurements and therapeutic targets |
| Most recent laboratory measurements: systolic/diastolic blood pressure; heart rate; height; weight; waist circumference |
| Blood pressure target: <140/90 mmHg (for diabetic patients, blood pressure <140/80 mmHg); total cholesterol target <4.5 mmol/l; LDL cholesterol target <2.5 mmol/l; stricter target of <1.8 mmol/l; HbA1c target <7%4 |
| Medications |
| Antiplatelet agents; statins; other lipid-lowering agent; beta-blocker; calcium-channel blocker; diuretic; ACE inhibitor; angiotensin-II receptor; other antihypertensive agent; nitrate; insulin; oral hypoglycaemic agents; drug class only |
| CHIS and categories |
| CHIS was defined by six risk factors. They are: non-/ex-smoker, BMI <25, moderate/vigorous physical activity, controlled blood pressure (blood pressure<140/90 mmHg; 140/80 mmHg for diabetics), controlled LDL cholesterol (<2.5 mmol/l), and controlled blood sugar (HbA1c<7%; if HbA1c is not available, glucose<7 mmol/l). The number of controlled risk factors was summed, ranging from 0 (poor) to 6 (good). CHIS categories were defined as follows: poor ≤2, intermediate =3 or 4, good =5 or 6 |
aThe same definitions of obesity and abdominal obesity have been used for Asian, Middle Eastern and European populations.
CVD: cardiovascular disease; ECG: electrocardiogram; CABG: coronary artery bypass grafting; PCI: percutaneous coronary intervention; ACS: acute coronary syndrome; SAP: stable angina pectoris; BMI: body mass index; LDL: low-density lipoprotein; ACE: angiotensin-converting enzyme; CHIS: Cardiovascular Health Index Score
Data were entered online using Survey Monkey (www.surveymonkey.com). Alternatively, anonymous data could be submitted on a spreadsheet with a unique security code. All data were downloaded and stored securely in restricted and password protected divisions.
Risk factor management
Risk factor management was assessed against targets specified by the 2012 version of European guidelines on CVD prevention.4 As a summary measure to assess overall adherence to risk factor management, a simplified Cardiovascular Health Index Score (CHIS) was used adapted from the ideal Cardiovascular Health Score.12 CHIS categories were defined by the summation of the number of six risk factors (smoking status, body mass index, physical activity, blood pressure, low-density lipoprotein (LDL) cholesterol, and blood sugar) that were at target. Details are available in Table 2.
Statistical analysis
Statistical analyses were undertaken using STATA (StataCorp. 2013, College Station, TX, USA). For continuous variables, mean and standard deviations were calculated if the distribution was normal. One-way analysis of variance was used to assess for statistically significant differences between regions. For categorical variables, the Chi-square test was used to assess for differences between regions. Lipid (total cholesterol, LDL cholesterol and high-density lipoprotein cholesterol) and glucose distributions were positively skewed, so comparison of results between regions was based on medians and the Kruskal–Wallis test.
Results
Overall, data from 10,186 participants from 79 centres in 11 countries was included in SURF I (Table 1 and Supplementary Appendix part C). The mean age of all patients was 65.2 ± 11.2 years and 29.3% were women.
Recordings of fundamental demographic variables like age and gender were missing occasionally (0.7% and 1.3%, respectively). Completeness of data recording for other variables was variable. In general, modifiable risk factors and physical measurements had higher recording rates compared with laboratory measurements. Cigarette smoking and blood pressure were recorded in over 98% but data on lipids, blood glucose, waist circumference and family history of premature CVD were missing in about 20%. Details on data recording are available in the Supplementary Appendix part D.
A small proportion of Asian (2.6%) and Middle Eastern (2.8%) patients participated in a cardiac rehabilitation programme compared with 45% in Europe (p < 0.001). The highest attendance of cardiac rehabilitation was in Ireland (65.9%), and the lowest was observed in China (1.4%) (Figure 1). Smoking rates were 16.2% with higher levels of smoking in Europe (17.5%) compared with Asia (16.0%) and the Middle East (10.4%). All three regions reported low levels of patients reaching the recommended level of physical activity. Over 70% of patients were overweight or obese, varying from 47.4% in Asia to 83% in the Middle East (p < 0.001). Overall medication usage with antiplatelets, statins and beta-blockers were 90.1%, 81.2% and 71.6%, respectively. A higher usage of statins was noted in Europe (86.8%) and the Middle East (93.2%) than in Asia (51%, p < 0.001). Details are given in Table 3.
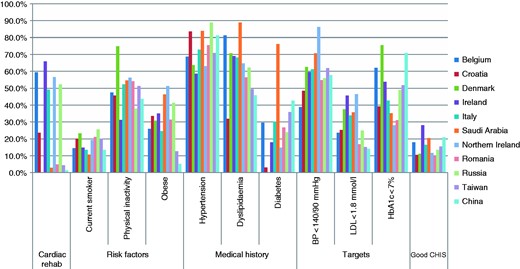
Risk factors, therapeutic targets, and Cardiovascular Health Index Score, SUrvey of Risk Factors I by country.
rehab: rehabilitation; BP: blood pressure; LDL: low-density lipoprotein; CHIS: Cardiovascular Health Index Score
Demographic characteristics, lifestyle risk factors and medication usage, SUrvey of Risk Factors I, by region.
| Overall | Europe | Asia | Middle East | p valuea | |
|---|---|---|---|---|---|
| Patients | 10,186 | 6722 | 1884 | 1580 | |
| Sex | <0.001 | ||||
| Men, % | 70.8 | 73.0 | 60.4 | 73.9 | |
| Women, % | 29.3 | 27.0 | 39.6 | 36.1 | |
| Age, years | 65.2 ± 11.2 | 65.4 ± 10.9 | 66.8 ± 11.1 | 62.1 ± 12.0 | <0.001 |
| CHD category, % | |||||
| CABG | 19.5 | 21.5 | 6.2 | 26.9 | <0.001 |
| PCI | 47.0 | 47.4 | 35.0 | 59.4 | <0.001 |
| ACS | 35.6 | 43.4 | 12.7 | 29.5 | <0.001 |
| SAP | 30.8 | 26.7 | 58.4 | 15.5 | <0.001 |
| Admitted to hospital within one year, % | 32.1 | 37.7 | 20.1 | 16.6 | <0.001 |
| Cardiac rehabilitation, % | 30.2 | 45.0 | 2.6 | 2.8 | <0.001 |
| Family history, % | 31.7 | 37.7 | 20.1 | 16.6 | <0.001 |
| Risk factor history, % | |||||
| Smoking history | <0.001 | ||||
| Current smoker | 16.2 | 17.5 | 16.0 | 10.4 | |
| Ex-smoker | 39.2 | 45.7 | 27.4 | 25.8 | |
| Never smoked | 44.7 | 36.8 | 56.6 | 63.8 | |
| Physical activity | <0.001 | ||||
| Less than recommended | 46.6 | 44.8 | 46.6 | 54.6 | |
| Moderate | 38.3 | 39.4 | 38.4 | 33.4 | |
| More than recommended | 15.1 | 15.8 | 15.0 | 12.0 | |
| Physical measurements | |||||
| BMI, kg/m2b | 28.1 ± 4.9 | 28.5 ± 4.7 | 25.2 ± 3.4 | 30.3 ± 5.9 | <0.001 |
| Overweight or obese (%) | 72.5 | 77.9 | 47.4 | 83.0 | <0.001 |
| Waist circumference, cmc | 96.9 ± 14.8 | 99.9 ± 14.7 | 86.7 ± 9.4 | 100.2 ± 14.8 | <0.001 |
| Women | 92.8 ± 14.9 | 95.9 ± 15.4 | 84.3 ± 9.4 | 100.3 ± 15.0 | <0.001 |
| Men | 98.6 ± 14.4 | 101.4 ± 14.2 | 88.2 ± 9.0 | 100.2 ± 14.7 | <0.001 |
| Abdominal obesity, %c | 45.8 | 54.3 | 16.7 | 56.3 | <0.001 |
| Medications | |||||
| Anti-platelet | 90.1 | 91.4 | 82.3 | 93.7 | <0.001 |
| Statin | 81.2 | 86.8 | 51.0 | 93.2 | <0.001 |
| Other lipid lowering agent | 8.0 | 10.0 | 2.6 | 5.9 | <0.001 |
| Beta blocker | 71.6 | 77.5 | 38.4 | 86.3 | <0.001 |
| Calcium antagonist | 27.2 | 20.9 | 51.0 | 25.4 | <0.001 |
| Other anti-hypertensive | 7.4 | 7.0 | 3.2 | 14.4 | <0.001 |
| ACE inhibitor | 50.8 | 57.7 | 20.5 | 57.5 | <0.001 |
| Diuretic | 23.3 | 24.9 | 14.9 | 26.7 | <0.001 |
| ARB | 18.2 | 13.9 | 33.0 | 19.1 | <0.001 |
| Nitrate | 32.3 | 26.6 | 57.3 | 26.6 | <0.001 |
| Insulin | 9.8 | 6.6 | 6.6 | 26.8 | <0.001 |
| Oral hypoglycaemic agent | 22.4 | 14.9 | 28.0 | 47.8 | <0.001 |
Numeric variables are mean ± standard deviation and categorical variables are percentage. p values obtained from one-way analysis of variance test for numeric variables and Chi-square test for categorical variables.
Comparison between regions.
BMI was calculated by weight and height. Its categories were defined as follows: underweight<18.5 kg/m2, normal weight 18.5–24.9 kg/m2, overweight 25–29.9 kg/m2, obese I 30–34.9 kg/m2, obese II 35–39.9 kg/m2, obese III ≥40 kg/m2.
Abdominal obesity defined as waist circumference ≥88 cm in women and ≥102 cm in men.
CHD: coronary heart disease; CABG: coronary artery bypass surgery; PCI: percutaneous coronary intervention; ACS: acute coronary syndrome; SAP: stable angina pectoris; BMI: body mass index; ACE inhibitor: angiotensin-converting enzyme; ARB: angiotensin receptor blocker
Table 4 shows therapeutic control of lipids, blood pressure and glucose. About two-thirds of patients reported previously diagnosed dyslipidaemia. For patients from the Middle East a considerably higher prevalence of dyslipidaemia, compared with those from Europe and Asia, was reported (88.9%, 68.7% and 47.2%, respectively). Asian patients seemed less likely to achieve the stricter LDL cholesterol target (14.6%) compared with European (32.9%) and Middle Eastern patients (35.6%). Among participating countries, the best LDL cholesterol control was observed in patients from Northern Ireland, whereas patients from China showed the lowest (Figure 1).
Recording and control of lipids, blood pressure, glucose and HbA1c, and Cardiovascular Health Index Score, SUrvey of Risk Factors I, by region.
| Overall | Europe | Asia | Middle East | p valuea | |
|---|---|---|---|---|---|
| Lipid | |||||
| Known history of dyslipidaemia, % | 67.6 | 68.7 | 47.2 | 88.9 | <0.001 |
| Total cholesterol, mmol/l | 4.1 (8320) | 4.1 (5506) | 4.2 (1598) | 3.7 (1216) | 0.001 |
| LDL cholesterol, mmol/l | 2.3 (7672) | 2.2 (4872) | 2.6 (1532) | 2.0 (1268) | 0.001 |
| HDL cholesterol, mmol/l | 1.1 (7780) | 1.1 (5036) | 1.1 (1533) | 0.9 (1211) | 0.001 |
| Triglycerides, mmol/l | 1.4 (8130) | 1.4 (5291) | 1.4 (1610) | 1.4 (1229) | 0.083 |
| At targets, %b | |||||
| Total cholesterol, mmol/l | 62.3 | 59.2 | 60.3 | 79.4 | <0.001 |
| LDL cholesterol, mmol/l | 59.4 | 60.2 | 45.2 | 73.4 | <0.001 |
| Stricter LDL cholesterol, mmol/l | 29.7 | 32.9 | 14.6 | 35.6 | <0.001 |
| Blood pressure | |||||
| Known history of hypertension | 74.5 | 71.7 | 77.2 | 83.9 | <0.001 |
| Physical measurements | |||||
| Systolic blood pressure, mmHg | 131.5 ± 18.6 | 132.4 ± 19.5 | 130.7 ± 16.4 | 128.4 ± 17.2 | <0.001 |
| Diastolic blood pressure, mmHg | 76.1 ± 11.0 | 77.0 ± 10.8 | 77.0 ± 10.9 | 71.5 ± 10.4 | 0.111 |
| Heart rate, beats/min | 70.9 ± 12.7 | 70.2 ± 13.0 | 73.6 ± 12.4 | 70.8 ± 11.4 | <0.001 |
| At target, %b | |||||
| Blood pressure | 60 | 57.6 | 59.4 | 70.6 | <0.001 |
| Known history of diabetes, % | 34.5 | 25.2 | 40 | 76.1 | <0.001 |
| Type I diabetes | 2.1 | 1.6 | 0.1 | 15.3 | <0.001 |
| Type II diabetes | 32.9 | 23.8 | 39.8 | 73.7 | <0.001 |
| Glucose, mmol/l | 5.7 (7891) | 5.6 (5167) | 5.8 (1524) | 6.6 (1200) | 0.001 |
| Non-diabetics | 5.5 (5688) | 5.5 (4082) | 5.3 (899) | 6.0 (707) | 0.001 |
| Diabetics | 7.4 (2203) | 7.4 (1085) | 6.9 (625) | 8.3 (493) | 0.001 |
| HbA1c, % | 7.4 ± 1.6 | 7.3 ± 1.5 | 7.3 ± 1.5 | 7.9 ± 1.8 | 0.001 |
| Non-diabetics | 7.1 ± 1.7 | 6.8 ± 1.4 | 6.0 ± 0.9 | 7.7 ± 1.8 | 0.001 |
| Diabetics | 7.5 ± 1.6 | 7.6 ± 1.5 | 7.0 ± 1.4 | 8.3 ± 1.8 | 0.001 |
| HbA1c at target, %b | |||||
| Overall | 48.2 | 47.6 | 64.5 | 35.2 | <0.001 |
| Non-diabetics | 57.8 | 63.7 | 90.6 | 42 | <0.001 |
| Diabetics | 42.1 | 38.6 | 56.6 | 26.2 | <0.001 |
| CHIS, %c | |||||
| Poor | 21.4 | 19.9 | 19.1 | 31.2 | <0.001 |
| Intermediate | 61.9 | 63.0 | 62.0 | 57.3 | |
| Good | 16.7 | 17.1 | 18.9 | 11.6 | |
Numeric variables are mean ± standard deviation or median (number of measurements) and categorical variables are percentage. p values obtained from one-way analysis of variance test for numeric variables and Chi-square test for categorical variables.
Comparison between regions.
Total cholesterol target is <4.5 mmol/l; LDL cholesterol target is <2.5 mmol/l and stricter LDL cholesterol target is 1.8 mmol/l; blood pressure target is defined as: <140/90 mmHg, and <140/80 mmHg for diabetics.
CHIS categories were defined by the summed number of controlled risk factors: poor ≤2, intermediate =3 or 4, good =5 or 6.
LDL: low-density lipoprotein; HDL: high-density lipoprotein; CHIS: Cardiovascular Health Index Score
The overall prevalence of hypertension was high (74.5%), ranging from 71.7% in Europe to 83.9% in the Middle East. Overall 60% of all patients participating in SURF I met the guideline target (<140/90 mmHg; 140/80 mmHg for diabetics). Despite the highest frequency of a known history of hypertension, 70.6% of Middle Eastern patients were at blood pressure target.
Reported diabetes was prevalent in patients from all regions, especially the Middle East (76.1% compared with 40% in Asia and 25.2% in Europe (p < 0.001)). An HbA1c of <7% was rarely achieved. Figures were 47.6%, 64.5% and 35.2% for patients in Europe, Asia and the Middle East, respectively.
Good, intermediate and poor CHIS were noted in 16.7%, 61.9% and 21.4%, respectively. CHD patients in the Middle East seemed less likely to reach good CHIS (11.6%) compared with those in Europe (17.1%) and Asia (18.9%) (p < 0.001). Figures are shown in Table 4.
The Supplementary Appendix part E documents the considerable variations between countries with regard to risk factor management, therapeutic targets, CHIS and medication usage.
Discussion
SURF proved to be quick and easy to undertake as part of a routine clinic attendance, making it an attractive clinical audit tool applicable in a wide range of settings. SURF I shows inadequate control of cardiovascular risk factors, even in these high-risk patients with established CHD, particularly with regard to continued smoking, high rate of obesity, insufficient achievement of therapeutic targets, and underuse of cardiac medications. It documents substantial variations between regions and countries of participating centres with regard to both risk factor management and cardiac medications.
The high prevalence of modifiable risk factors like smoking, body weight and physical activities remains a major problem in CVD prevention. Among these modifiable risk factors, the high rate of obesity is of particular concern as it is strongly associated with raised blood pressure, cholesterol and glucose.13 Current uniform body mass index (BMI) cut-off values for obesity may not be appropriate, especially for ethnic minorities, resulting in either over- or under-estimation of obesity prevalence. Reflecting this, the World Health Organization has recommended additional lower BMI cut-off for Asian countries but this issue remains controversial11 as a large prospective cohort study in China indicated the association between cardiovascular mortality and BMI to be similar to those observed in Western populations, suggesting the use of uniform BMI cut-off points in all populations.14 In addition, for the Middle East, there was limited evidence for defining separated BMI cut-off points.15 Irrespective of discussion on BMI cut-off points, the prevalence of obesity has risen substantially in the last few decades, particularly in developing countries.1 This situation is creating concern about a potential future worldwide increase in CHD rates.
Cardiac rehabilitation, involving advice and supervision on the management of modifiable risk factors, has been recommended as a cost-effective tool for CHD prevention. A Cochrane Review on 47 randomized control trials demonstrated that exercise-based cardiac rehabilitation is effective in reducing both total and cardiac mortality.16 However, the availability and the quality of cardiac rehabilitation services differ, which contributes to poor participating rates in many countries.17,18 SURF also noted large variations in cardiac rehabilitation participation, which was observed to be grossly underused, especially in Asia and the Middle East. The inequalities in access to cardiac rehabilitation may relate to lack of an appropriate, defined health care policy at central, regional or hospital level, inadequate funding and/or lack of professional guidelines.
Lipid management remains a cause for concern. Correction of dyslipidaemia, particularly LDL cholesterol, is recommended by all guidelines for CVD prevention.4,19 The Treating to New Target trial suggested that aggressive lipid lowering therapy, especially statin therapy, improves clinical outcomes for CHD patients.20 This audit showed that to achieve the recommended LDL cholesterol target level (1.8 mmol/l) and take such lipid-lowering therapy is problematic, especially for Asia. In Asia, only 15% of CHD patients achieved the 1.8 mmol/l goal, with only 51% taking statins. These results are in line with results from the PURE study, observing that optimal LDL cholesterol targets are hard to achieve for CHD patients in daily clinical practice.21 There are several possible explanations for the poor control of lipids in Asia including health economic issues, professional attitudes, patient preferences and ineffective implementation of guidelines.
Apart from the high prevalence of dyslipidaemia and large number of patients not at cholesterol targets, SURF I also demonstrated a high prevalence of hypertension and inadequate anti-hypertensive treatment not only in Europe but also in countries from Asia and the Middle East. The known history of hypertension was even higher in Asia and the Middle East, which may be partly explained by excess salt intake. A global review found that populations in East Asia and the Middle East had much higher salt intakes compared with those in Western regions.22 Salt intake has continued to increase, regardless of the strong evidence of the benefits of salt reduction. Thus, the control of hypertension in day-to-day life continues to pose substantial challenges.
Diabetes at least doubles the risk for CVD, independently of other conventional risk factors.23 It has been estimated that the prevalence of diabetes will increase progressively, particularly in developing countries.1 This is likely to give rise to a rapid increase in CHD. Glycaemic control in CHD patients is normally assessed by HbA1c and an HbA1c<7% for CHD patients with diabetes is recommended in the current European Society of Cardiology guideline.4 A large proportion of CHD patients have raised HbA1c values which are frequently unrecognized.24 It is necessary, especially for CHD patients with diabetes, to check HbA1c regularly and assess their diabetes risk. In this regard availability of HbA1c information in daily clinical practice in only 57% of our diabetic patients is of concern (Supplementary Appendix part D). Thus, there may be appreciable under-diagnosis of diabetes, which is related to a poor prognosis in CHD. Our results underline the importance of including diagnostic testing for diabetes for CHD patients with diabetes.
The overall risk factor management of SURF I participants was summarized by the use of a simplified CHIS. Over 80% had poor or intermediate CHIS, indicating inadequate risk factor control. A large collaborative analysis, based on three randomized controlled trials, confirmed the difficulty in achieving a healthy lifestyle and attaining therapeutic targets for CHD patients.25 The CHIS does not reflect the fact that the relative importance of each risk factor may not be equal, but underlines need for an integrated, multi-disciplinary approach to risk factor modification.
SURF, as a pragmatic audit, collects its data when patients attend routine clinics and thus helps to track data recording in daily practice with very little increase in workload. So, another important finding of our study is the high frequency of missing data in current data recording systems; in the current study we observed a rate of missing data above 20% and even variables like sex and age are occasionally not recorded (Supplementary Appendix part D). Effective risk factor control is clearly impossible if there is no record of the factors concerned no matter how good prevention guidelines may be. Routine clinical practice standards remain sub-optimal. SURF does provide a good opportunity to monitor routine clinic practice, improve data quality in future and, hopefully, to support the development of standard operating procedures appropriate to local conditions.
There are several limitations to this study. It should be stressed that SURF is a simple audit. Unlike EUROASPIRE, laboratory measurements are not standardized. The high frequency of missing data might reduce the reliability of prevalence estimates. Participating centres from each country were identified by personal contact and as a result of presentations at meetings and thus may not be representative of health care facilities treating CHD patients in participating countries. So, we cannot judge their representativeness. It is possible that the standard of care is in fact higher than the local average, because of the interest of the centres in participating in SURF. Following SURF I, a new phase, SURF II, will use a more formal recruitment procedure to enhance representativeness of centres and patients.
The simplicity of SURF is its strength. It is easy to undertake at low cost and with minimal workload for health care providers. It is particularly suitable as an audit instrument for use in low-resource settings and allows multiple comparisons of risk factor management in different regions. In addition, SURF may serve to validate, support and complement other audits to describe the on-going burden of risk factor management in CVD prevention. This, and the potential to generate international and local publications, provides added value for participating centres. Many countries also require evidence for participation in clinical audits for training and accreditation purposes. SURF underlines the need for structured data documentation and standard operating procedures to assist in guideline implementation with a view to improving both risk factor recording and control.
In conclusion, this international audit study of CHD patients has shown the applicability of SURF I in different settings. The results indicate patchy recording and poor control of risk factors in CHD patients, with substantial regional variations. These observations call for judicious and validated approaches to the development and implementation of clinical standards, operating procedures and performance measures.
Acknowledgements
The SURF study group is grateful to all participating centres and their staffs for their enthusiastic participation and support. We also thank Isabella Higgins for helping with data management.
Declaration of conflicting interests
The author(s) declared no potential conflicts of interest with respect to the research, authorship, and/or publication of this article.
Funding
The author(s) disclosed receipt of the following financial support for the research, authorship, and/or publication of this article: This project was funded in part by an unrestricted educational grant from MSD Ireland. MZ has been supported by a grant from the Netherlands Organization for Scientific Research (NWO; grant number 0.22.005.021). MSD and NWO had no input into the design, execution, analysis, or writing up of the study.

Comments