


Abstract
The prevalence of undernutrition among hospitalized patients is common and it has been associated to worse clinical outcomes, especially in heart failure and coronary artery disease patients. Female gender has been associated with major adverse events after a ST-segment myocardial infarction (STEMI).
Assess the relationship between gender-based differences in nutritional status and one-year all-cause mortality among hospitalized patients after a primary angioplasty (PA) for STEMI.
Cohort of 321 consecutive patients (64.4 years [54.3–75.2]; 22.4% women) admitted to our general ICU after a PA for STEMI between November-2013 and February-2017. NRI was calculated as 1.519 × serum albumin (g/L) + 41.7 × (actual body weight [kg] / ideal weight [kg]). Patients were dichotomized in no to mild (NRI ≥97.5) and moderate to severe nutritional risk (NRI <97.5). The Clinical Frailty Scale (CFS) was used to assess biological frailty. Analyses were made using crosstab tables with Pearson's chi-squared and likelihood-ratio goodness-of-fit tests. Cramér's V test or Kendall rank correlation coefficient were used to measure the degree of association between variables.
Gender distribution among nutritional risk categories showed a significant degree of association (value 0.251; P=0.017) between female gender and moderate to severe NRI (55.7% women vs. 34.9% men, P=0.002) (Figure 1), independently of frailty (P=0.172). Women had significantly greater one-year mortality rate than men (20.8% vs. 5.2%: OR 4.78, 95% confidence interval [CI], 2.15–10.60, P<0.001). Combination of moderate to high nutritional risk (NRI <97.5) and biological vulnerability (CFS ≥4) significantly increased one-year mortality rate in women (53.3% in women vs. 26.7% in men; P<0.001).
Among STEMI patients undergoing PA, women had a greater nutritional risk than men, regardless of biological frailty, and a greater one-year mortality rate. Undernutrition may be a risk factor implicated in the worse clinical outcome of female gender after STEMI.
Nutritional risk, frailty and mortality
| Groups | N (%) | Gender | One-year mortality | Cardiogenic shock | |||
|---|---|---|---|---|---|---|---|
| P<0.001 | P<0.001 | P=0.003 | |||||
| Women (n=70) | Men (n=249) | Women (n=70) | Men (n=249) | Women (n=70) | Men (n=249) | ||
| NRI ≥97.5 and CFS <4 | 179 (56.1) | 24 (34.3) | 155 (62.2) | 2 (8.3) | 2 (1.3) | 2 (8.3) | 1 (0.6) |
| NRI <97.5 and CFS <4 | 96 (30.1) | 24 (34.3) | 72 (28.9) | 4 (16.7) | 5 (6.9) | 3 (12.5) | 2 (2.8) |
| NRI ≥97.5 and CFS ≥4 | 14 (4.4) | 7 (10) | 7 (2.8) | 1 (14.3) | 2 (28.6) | 0 (0) | 1 (14.3) |
| NRI <97.5 and CFS ≥4 | 30 (9.3) | 15 (21.4) | 15 (6.0) | 8 (53.3) | 4 (26.7) | 5 (33.3) | 1 (6.7) |
CFS: Clinical frailty scale; NRI: Nutritional risk index.
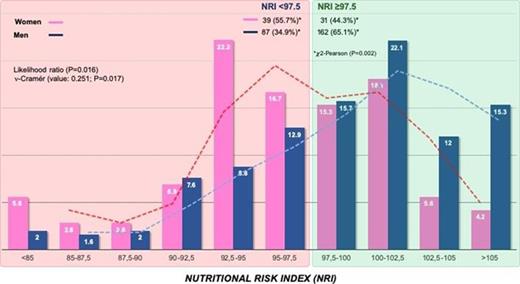
Figure 1. Gender distribution among NRI categories
Type of funding source: None

