


Abstract
Malnutrition and sarcopenia are common features of frailty. Prevalence of frailty among ST-segment elevation myocardial infarction (STEMI) patients is higher in women than men.
Assess gender-based differences in the impact of nutritional risk index (NRI) and frailty in one-year mortality rate among STEMI patients following primary angioplasty (PA).
Cohort of 321 consecutive patients (64 years [54–75]; 22.4% women) admitted to a general ICU after PA for STEMI. NRI was calculated as 1.519 × serum albumin (g/L) + 41.7 × (actual body weight [kg]/ideal weight [kg]). Vulnerable and moderate to severe NRI patients were those with Clinical Frailty Scale (CFS)≥4 and NRI<97.5, respectively. We used Kaplan-Meier survival model.
Baseline and mortality variables of 4 groups (NRI-/CFS-; NRI+/CFS-; NRI+/CFS- and NRI+/CFS+) are depicted in the Table. Prevalence of malnutrition, frailty or both were significantly greater in women (34.3%, 10% y 21.4%, respectively) than in men (28.9%, 2.8% y 6.0%, respectively; P<0.001). Women had greater mortality rate (20.8% vs. 5.2%: OR 4.78, 95% CI, 2.15–10.60, P<0.001), mainly from cardiogenic shock (P=0.003). Combination of malnutrition and frailty significantly decreased cumulative one-year survival in women (46.7% vs. 73.3% in men, P<0.001)
Among STEMI patients undergoing PA, the prevalence of malnutrition and frailty are significantly higher in women than in men. NRI and frailty had an independent and complementary prognostic impact in women with STEMI.
Baseline characteristics
| NRI≥97.5 and CFS<4 | NRI<97.5 and CFS<4 | NRI≥97.5 and CFS≥4 | NRI<97.5 and CFS≥4 | P value | |
|---|---|---|---|---|---|
| Prevalence, n (%) | 179 (56.1) | 96 (30.1) | 14 (4.4) | 30 (9.3) | – |
| Age, years | 59 [52–67] | 68 [58–79] | 77 [66–83] | 75 [67–85] | <0.001 |
| Female gender, n (%) | 24 (13.4) | 24 (25) | 7 (50) | 15 (50) | <0.001 |
| Mortality, n (%) | 4 (2.2) | 9 (9.4) | 3 (21.4) | 12 (40) | <0.001 |
| Cardiogenic shock, n (%) | 3 (1.7) | 5 (5.2) | 1 (7.1) | 6 (20) | 0.003 |
| GRACE 2.0 | 105 [89–127.5] | 132.5 [108.8–156.5] | 140 [108.3–164.8] | 154 [129.5–178.8] | <0.001 |
| Left ventricle ejection fraction, n (%) | 54 [45–60] | 55 [45–60] | 57.5 [36.8–64] | 50 [38.5–60] | 0.095 |
| High-sensitivity troponin I (pg/mL) | 10226.1 [61.4–70196.1] | 249.9 [43.5–42907.7] | 1449 [62.2–48911.6] | 5687 [86.9–51028] | 0.309 |
| Creatin-phosphokinase (IU/L) | 1950 [887–3715] | 1242 [447.5–2329] | 869.5 [243.5–2776] | 1023 [290–1855] | 0.002 |
| B-natruretic peptide (pg/mL) | 84 [24–195.8] | 185.5 [69.3–542.1] | 156.7 [75.7–425.5] | 478.7 [133.5–1160.1] | <0.001 |
| Inotropic agents, n (%) | 12 (6.7) | 15 (15.6) | 2 (14.3) | 9 (30) | 0.004 |
| Mechanical ventilation, n (%) | 7 (3.9) | 10 (10.4) | 1 (7.1) | 9 (30) | 0.007 |
CFS: Clinical frailty scale; MI: Myocardial infarction; NRI: Nutritional risk index.
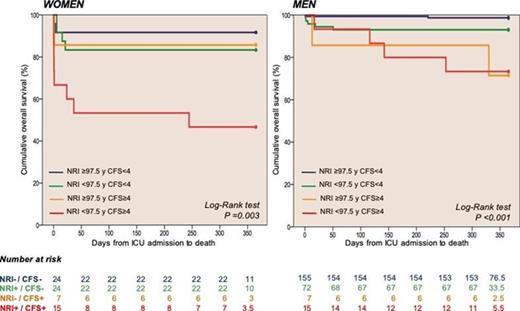
Kaplan-Meier and Cox survival curves
Type of funding source: None

