


Abstract
Interest in targeted screening programmes for atrial fibrillation (AF) has increased, yet the role of genetics in identifying patients at highest risk of developing AF is unclear.
A total of 36,662 subjects without prior AF were analyzed from four TIMI trials. Subjects were divided into quintiles using a validated polygenic risk score (PRS) for AF. Clinical risk for AF was calculated using the CHARGE-AF model. Kaplan–Meier event rates, adjusted hazard ratios (HRs), C-indices, and net reclassification improvement were used to determine if the addition of the PRS improved prediction compared with clinical risk and N-terminal pro-B-type natriuretic peptide (NT-proBNP). Over 2.3 years, 1018 new AF cases developed. AF PRS predicted a significant risk gradient for AF with a 40% increased risk per 1-SD increase in PRS [HR: 1.40 (1.32–1.49); P < 0.001]. Those with high AF PRS (top 20%) were more than two-fold more likely to develop AF [HR 2.45 (1.99–3.03), P < 0.001] compared with low PRS (bottom 20%). Furthermore, PRS provided an additional gradient of risk stratification on top of the CHARGE-AF clinical risk score, ranging from a 3-year incidence of 1.3% in patients with low clinical and genetic risk to 8.7% in patients with high clinical and genetic risk. The subgroup of patients with high clinical risk, high PRS, and elevated NT-proBNP had an AF risk of 16.7% over 3 years. The C-index with the CHARGE-AF clinical risk score alone was 0.65, which improved to 0.67 (P < 0.001) with the addition of NT-proBNP, and increased further to 0.70 (P < 0.001) with the addition of the PRS.
In patients with cardiovascular conditions, AF PRS is a strong independent predictor of incident AF that provides complementary predictive value when added to a validated clinical risk score and NT-proBNP.
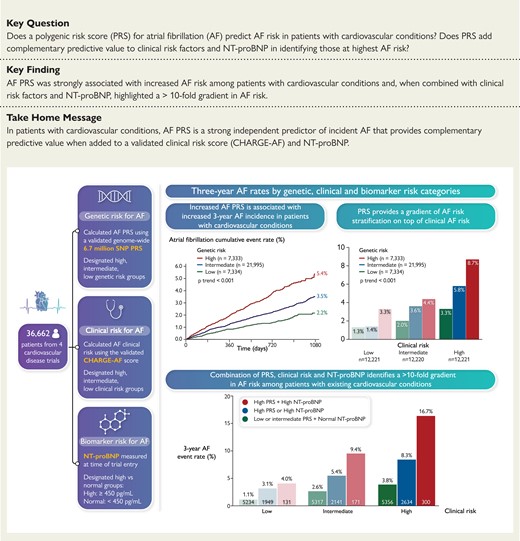
Classification of study population by genetic, clinical, and biomarker risk for atrial fibrillation (AF). PRS, polygenic risk score; CHARGE-AF, Cohorts for Heart and Aging Research in Genomic Epidemiology for Atrial Fibrillation (risk score including age, height, weight, systolic blood pressure, diastolic blood pressure, current tobacco use, antihypertensive medication use, diabetes, heart failure, and prior myocardial infarction). Rates of incident AF by genetic, clinical, and biomarker risk categories are shown.
See the editorial comment for this article ‘Genomic risk scores, biomolecules, and clinical conditions to predict atrial fibrillation: time to integrate what we can measure’, by S. Kääb et al., https://doi.org/10.1093/eurheartj/ehac527.
Introduction
Atrial fibrillation (AF) is the most common cardiac arrhythmia, with an estimated lifetime risk of 20–40% among adults worldwide.1 It carries significant morbidity and mortality, largely because of its increased risk of cardioembolic stroke. As early detection of AF may permit earlier initiation of anticoagulation to reduce embolic stroke risk, there is particular interest in targeted screening programmes to identify those at highest risk of developing AF.
A growing body of evidence has demonstrated that AF risk is highly influenced by heritable factors,2–5 yet existing tools for AF risk stratification rely on traditional risk factors6 or biomarkers such as N-terminal pro-B-type natriuretic peptide (NT-proBNP)7–9 without incorporation of genetic data such as polygenic risk scores (PRSs). We and others have studied non-genome-wide PRS for AF in multiple heterogeneous, community-based cohorts, and PRS have consistently yielded improved AF prediction compared with traditional risk factors alone.10–14 However, the utility of genetics in improving AF prediction in patients with established cardiovascular conditions and in addition to NT-proBNP remains unknown.
We sought to determine whether a new genome-wide 6.7 million single-nucleotide polymorphism (SNP) AF PRS adds value to clinical risk factors and NT-proBNP in predicting incident AF in a cohort of patients from four trials across the spectrum of cardiovascular disease.
Methods
Study design and population
We performed a genetic cohort study pooling individual patient-level data from four cardiovascular clinical trials: SOLID-TIMI 52 (Stabilization of Plaques Using Darapladib),15 SAVOR-TIMI 53 (Saxagliptin Assessment of Vascular Outcomes Recorded in Patients with Diabetes Mellitus),16 PEGASUS-TIMI 54 (Prevention of Cardiovascular Events in Patients With Prior Heart Attack Using Ticagrelor Compared to Placebo on a Background of Aspirin),17 and FOURIER (TIMI 59) (Further Cardiovascular Outcomes Research With PCSK9 Inhibition in Subjects With Elevated Risk).18 This combined study population represents a broad spectrum of cardiovascular conditions including previous myocardial infarction, diabetes, stroke, and peripheral arterial disease. Brief descriptions of each trial are included in the Supplemental Appendix. Patients who consented for genetic analysis, passed quality control, were of European ancestry, and had no known history of AF at time of trial entry were included. Baseline characteristics and incident AF rates for each trial are listed in see Supplementary material online, Table S1. Of note, among the therapies tested in these trials, none of them reduced incident AF. Each site’s institutional review board or ethics committee approved the trial protocols which included genetic analysis.
Genotyping and imputation
Genotyping was performed using the Illumina Multi-Ethnic Genotyping Array (SAVOR-TIMI 53 and PEGASUS-TIMI 54), Affymetrix Biobank Array (SOLID-TIMI 52), and Infinium Global Array (FOURIER). Imputation, quality control, and ancestry identification were performed using the same methods for all four trials. Pre-imputation quality control was performed using PLINK v2.0.19 Variants with a call rate <98% as well as duplicated variants and those with a Hardy-Weinberg equilibrium test in European ancestry samples of P < 1E-6 were removed. Samples with call rate <98% and heterozygosity rate deviating more than three standard deviations (SDs) from the mean were removed. Imputation was performed on the Michigan Imputation server20 using Minimac421 and TOPMed Freeze5 reference panel [National Heart, Lung, and Blood Institute’s Trans-Omics for Precision Medicine (TOPMed) programme].22 Eagle software was used for phasing.23,24 Variants with an imputation quality of less than 3 Rsq were filtered out. Unrelated samples were identified by calculating cryptic relatedness through identity by descent and a pi-hat threshold of 0.2. Post-imputation quality control was performed, followed by identification of patients with European ancestry using the 1000 Genomes Phase 3 v5 reference panel25 and ADMIXTURE tool26 and cut-off >0.8.
Polygenic risk score
The effect weights used in this analysis were obtained from a previously published AF genome-wide PRS that was calculated using the LDPred algorithm27 and the tuning parameter ρ = 0.003. Starting with the discovery GWAS,28 the original score was validated using the UK Biobank phase I dataset, and then tested and calculated using an independent UK Biobank Phase II testing data set (https://cvd.hugeamp.org/downloads.html).29 Of the 6 730 541 SNPs from the original score, 6 399 160 were available across all four trials (see Supplementary material online, Table S2). A PRS was calculated for each subject using the genotype dosage for each allele, multiplied by its weight, and then summed across all variants.30 The study population was divided into genetic risk quintiles, with the top quintile classified as high genetic risk, the second through fourth quintiles designated as intermediate genetic risk, and the bottom quintile defined as low genetic risk as per prior analytic approaches.31,32
CHARGE-AF clinical risk score
Clinical risk for AF was calculated for each subject using the validated CHARGE-AF model, which incorporates age, height, weight, systolic blood pressure, diastolic blood pressure, antihypertensive medication use, diabetes, heart failure, myocardial infarction, and smoking.6 Patients were designated as low, intermediate, or high clinical risk for AF based on tertiles of CHARGE-AF score.
NT-proBNP assay
NT-proBNP level was measured in all consenting participants at time of trial entry. Serum NT-proBNP concentrations were measured at the first thaw using a sandwich immunoassay (Roche Diagnostics in PEGASUS, SOLID, and SAVOR; Abbott in FOURIER). The analytic range is 5–35 000 pg/mL for the Roche assay and 8.2–35 000 pg/mL for the Abbott assay. The reported within-run coefficient of variation is 4.2% at a level of 44 pg/mL and 2.7% at a level of 33 606 pg/mL. Subjects were classified as having normal (defined as <450 pg/mL) or elevated NT-proBNP (≥450 pg/mL).
Study endpoint and follow-up
The endpoint of interest was incident AF, including AF and atrial flutter events. For each trial, AF and atrial flutter events were reported by investigators as adverse events. Two independent reviewers (N.A.M. and A.C.G.) identified instances of AF and atrial flutter in safety event databases for the present study. The median follow-up across trials ranged from 2.1 to 2.8 years.
Statistical analyses
Individual patient-level data were pooled from the four clinical trials. Analyses were performed in the overall genetic cohort, as well as in subgroups of interest including by age, CHARGE-AF clinical risk, and NT-proBNP. Time-to-event data were used to create Kaplan–Meier curves. Cox proportional hazard models were used to calculate hazard ratios (HRs) for AF across genetic risk categories. Analyses were adjusted for age, sex, genetic ancestry (by principal components 1–5), trial, and for clinical comorbidities including hypertension, diabetes, obesity, smoking, heart failure, and prior myocardial infarction. This analysis was also performed in 4873 patients of non-European ancestry. A trend test was used to assess differences in AF risk across genetic risk categories, and a log rank test was used for statistical comparison of Kaplan–Meier curves. Using continuous variables for CHARGE-AF score, NT-proBNP level, and PRS, three predictive models were created; the first included clinical risk alone, the second added NT-proBNP to clinical risk, and the third included clinical risk, NT-proBNP, and PRS. The C-index and category-less net reclassification improvement index (NRI) were calculated for each continuous variable to determine the additive value of biomarker and genetic data to clinical risk factors in predicting AF. The likelihood ratio test was used to compare these three models. Stratification by clinical risk, PRS, and NT-proBNP was also performed. All P-values were two-sided and assessed at a threshold of 0.05.
Results
Across the four trials, 36 662 subjects were included. The mean age was 64 years and 25% were female. Baseline characteristics by genetic risk category are shown in Table 1. There were no clinically meaningful differences between patients stratified by genetic risk score. Distribution of AF PRS was similar across the trials studied (see Supplementary material online, Figure S1). The relative contribution of each trial to these genetic risk categories is listed in see Supplementary material online, Table S1. A total of 1018 new AF cases (2.8%) were identified over a median follow-up of 2.3 years.
Baseline characteristics by genetic risk category
| Overall | Low genetic risk | Int. genetic risk | High genetic risk | P-value | |
|---|---|---|---|---|---|
| N | 36 662 | 7334 | 21 995 | 7333 | |
| Demographics | |||||
| Age, years | 64.1 (8.7) | 64.4 (8.9) | 64.1 (8.7) | 63.8 (8.6) | <0.001 |
| Age ≥ 65 years | 18 076 (49.3) | 3709 (50.6) | 10 844 (49.3) | 3523 (48.0) | 0.009 |
| Female sex | 9263 (25.3) | 1863 (25.4) | 5533 (25.2) | 1867 (25.5) | 0.835 |
| Medical history | |||||
| Hypertension | 28 621 (78.1) | 5787 (78.9) | 17 198 (78.2) | 5636 (76.9) | 0.009 |
| Diastolic BP, mmHg | 77.78 (9.77) | 77.70 (9.60) | 77.83 (9.80) | 77.70 (9.82) | 0.473 |
| Systolic BP, mmHg | 132.39 (16.57) | 132.12 (16.23) | 132.52 (16.63 | 132.27 (16.71) | 0.156 |
| Hyperlipidaemia | 22 281 (60.8) | 4514 (61.5) | 13 318 (60.6) | 4449 (60.7) | 0.314 |
| Diabetes | 15 716 (42.9) | 3120 (42.5) | 9518 (43.3) | 3078 (42.0) | 0.123 |
| Smoking | 8043 (21.9) | 1589 (21.7) | 4767 (21.7) | 1687 (23.0) | 0.047 |
| Prior MI | 30 244 (82.5) | 6112 (83.3) | 18 045 (82.0) | 6087 (83.0) | 0.018 |
| PAD | 3827 (10.4) | 752 (10.3) | 2325 (10.6) | 750 (10.2) | 0.600 |
| HF | 7027 (19.2) | 1512 (20.6) | 4147 (18.9) | 1368 (18.7) | 0.002 |
| Obesity | 15 441 (42.2) | 3005 (41.0) | 9283 (42.3) | 3153 (43.1) | 0.036 |
| eGFR, mL/min | 75.49 (19.50) | 75.22 (19.45) | 75.28 (19.40) | 76.42 (19.80) | <0.001 |
| Antihypertensives | 34 766 (95.9) | 6980 (96.4) | 20 829 (95.7) | 6957 (95.7) | 0.057 |
| NT-proBNP, pg/mL | 282 (555) | 301 (650) | 280 (532) | 269 (521) | 0.018 |
| CHA2DS2-VASc | 3.4 (1.4) | 3.5 (1.4) | 3.4 (1.4) | 3.4 (1.4) | <0.001 |
Values represent n (%) or average (standard deviation). P-values represent ×2 test for categorical variables and 1-way ANOVA for continuous variables.
Performance of AF PRS
Across the entire study population, AF PRS predicted a significant risk gradient for AF with a 40% increased risk per 1-SD increase in PRS [HR 1.40 (95% CI: 1.32–1.49), P < 0.001]. Three-year Kaplan–Meier event rates for those in the low, intermediate, and high genetic risk categories were 2.17% (n = 126), 3.53% (n = 585), and 5.36% (n = 307), respectively at 3 years of follow-up, with a 3-year event rate of 3.63% (n = 1018) for the full study cohort (Figure 1). After adjusting for clinical risk factors, a higher PRS remained strongly associated with AF risk (P-trend < 0.001) (Figure 2). Those with high genetic risk had an adjusted HR of 2.45 (95% CI: 1.99–3.03) compared with subjects in the low genetic risk category, and those with intermediate genetic risk had an adjusted HR of 1.54 (95% CI: 1.26–1.87). An analysis among 4873 subjects of non-European ancestry demonstrated consistent AF risk prediction with the PRS [HR: 2.15 (95% CI: 1.57–2.95) per 1-SD increase, P < 0.001] (see Supplementary material online, Table S3). Sensitivity analyses using smaller scores demonstrated similar risk prediction (see Supplementary material online, Table S4).
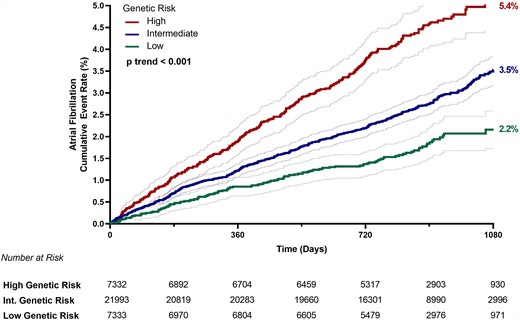
Kaplan–Meier event rates for atrial fibrillation by genetic risk category (low risk = bottom PRS quintile; intermediate risk = quintiles 2–4; high risk = top PRS quintile) at 3 years with 95% confidence intervals for each group. Int. indicates intermediate.
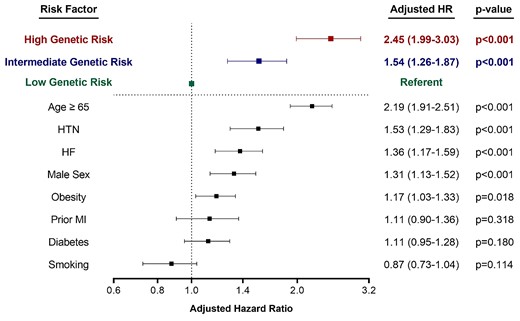
Hazard ratios for atrial fibrillation by genetic risk category (low risk = bottom PRS quintile; intermediate risk = quintiles 2–4; high risk = top PRS quintile) and clinical risk factors. Hazard ratios are adjusted for age, sex, genetic ancestry (by principal components 1–5), trial, hypertension, diabetes, obesity, smoking, heart failure, and prior myocardial infarction. 95% confidence intervals are shown for all analyses. HR indicates hazard ratio.
The magnitude of AF risk prediction by genetic risk category was on par with age and stronger than other clinical risk factors including hypertension, heart failure, and prior myocardial infarction (Figure 2). In subgroup analyses by age, PRS also provided a significant gradient of AF risk stratification within each age strata (see Supplementary material online, Figure S2). Individuals with high genetic risk who were ≥75 years of age had the highest risk of AF, with an 11.3% AF rate over the 3-year follow-up period. The risk prediction from the AF PRS was consistent across all subgroups, including sex, obesity, and other cardiovascular risk factors and disease states (see Supplementary material online, Figure S3). Those who did develop AF during the follow-up period were also nearly 3× more likely to experience an ischaemic stroke [odds ratio 2.86 (95% CI: 1.98–3.99), P < 0.001].
Addition of AF PRS to clinical risk
When the study population was divided into clinical risk tertiles based on CHARGE-AF score, PRS provided an additional gradient across each clinical risk group (all P-trend < 0.001) (Figure 3). When using both the CHARGE-AF score and the AF PRS together, there was a nearly seven-fold increase in risk from the lowest risk to the highest risk subgroups (1.3% in those with low clinical risk and low genetic risk; 8.7% in those with high clinical risk and high genetic risk). Clinical risk for AF also provided a significant gradient of risk stratification within each genetic risk category, with lower clinical risk group associated with significantly decreased incidence of AF at every level of genetic risk (P-trend < 0.001).

Three-year Kaplan–Meier event rates for AF by genetic risk category (low risk = bottom PRS quintile; intermediate risk = quintiles 2–4; high risk = top PRS quintile) and clinical risk group (defined by CHARGE-AF tertile). Within each clinical risk group, increased genetic risk conferred significantly increased risk of AF (P-trend <0.001 within each clinical risk group).
Incorporation of NT-proBNP for AF risk stratification
A total of 23 233 patients had NT-proBNP levels measured. Among this cohort, 14.3% (N = 3328) had NT-proBNP levels ≥450 pg/mL which carried a three-fold increased risk of incident AF (unadjusted HR: 2.96, 95% CI: 2.49–3.52). NT-proBNP was not associated with the AF PRS (r = −0.021) and their risk prediction was additive, identifying subsets of very high-risk individuals when used in combination (Figure 4). The subgroup of patients with high clinical risk, high NT-proBNP, and high PRS developed AF at a rate of 16.7% over the study period, compared with a rate of 3.8% in those with high clinical risk but lower PRS and NT-proBNP (P < 0.001), and 1.1% in those in the low clinical, genetic, NT-proBNP subgroup, representing a >10-fold risk gradient across this patient population with established cardiovascular conditions. When NT-proBNP and polygenic risk were added in a stepwise fashion to clinical risk in a model for AF prediction, the C-index improved significantly with each. The C-index for AF prediction by CHARGE-AF alone was 0.65 (0.63–0.67), improved to 0.67 (0.65–0.69) (P < 0.001) with the inclusion of NT-proBNP, and increased further to 0.70 (0.68–0.72) (P < 0.001) with the addition of the AF PRS. In addition, the category-less NRI for the AF PRS was 0.112 (0.087–0.163, P < 0.001) when added to CHARGE-AF and sex, 0.149 (0.093–0.220, P < 0.001) when added to CHARGE-AF, sex, and NT-proBNP, and 0.181 (0.125–0.24) with both the AF PRS and NT-proBNP were added to CHARGE-AF + sex (see Supplementary material online, Table S5). Again, sensitivity analyses using smaller AF PRSs demonstrated similar improvements in risk discrimination (see Supplementary material online, Table S4).
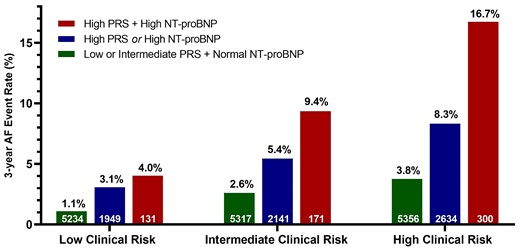
Combination of clinical risk, AF PRS, and NT-proBNP to predict the incidence of AF at 3 years. Analysis limited to patients with NT-proBNP available. Within each clinical risk group, incorporation of PRS and NT-proBNP data resulted in a significant gradient of AF rates (P-trend <0.001 for all clinical risk groups). Patients with high clinical risk, high genetic risk, and elevated NT-proBNP at time of trial entry had an AF rate of 16.7% over 3 years.
Discussion
Previously undiagnosed AF is detected in ∼10% of all ischaemic strokes, prompting AF screening initiatives in many countries around the world.33,34 However, the optimal approach to risk-based AF screening is a topic of ongoing debate and requires accurate risk assessment and stratification. In this analysis, we demonstrate that genetic risk can be a valuable component of AF risk assessment and should be integrated into risk stratification when available. Our key findings include: (i) validation that a 6.7 million SNP AF PRS provides strong, independent risk prediction for incident AF in patients with established cardiovascular conditions that is stronger than many established clinical risk factors; (ii) the addition of the AF PRS to clinical risk scores and biomarkers provides significant improvement in AF risk prediction; and (iii) the combination of clinical risk, AF PRS, and NT-proBNP provides the best risk discrimination and may be the optimal approach to assess risk of developing AF (Structured Graphical Abstract).
This work builds off the original discovery paper that developed a 6.7 million SNP PRS for AF and provides novel insights into its clinical application. The authors of that article found that the top 6% of patients were at >three-fold increased risk of incident AF;29 however comparisons to established clinical risk factors, subgroup analyses, and incorporation of the CHARGE-AF score and NT-proBNP were not performed. In this analysis, we address these outstanding questions in a cardiovascular patient population using a large multi-trial cohort with well-defined clinical risk factors, detailed phenotyping, and rigorous ascertainment of events. This analysis also assesses incident AF cases as opposed to prevalent cases which were used to derive the PRS. This demonstrates the PRS’ ability to predict future events, which carries potential implications for both AF clinical trials and AF screening algorithms. In addition to validating the strong risk prediction for incident AF in this prospective cohort, we found that the AF PRS is complimentary to established clinical risk factors and NT-proBNP, demonstrating that it may warrant clinical integration. Finally, we analyzed subgroups and demonstrated that this score appears to work similarly well in men and women, across age ranges, in individuals of European and non-European ancestry, and in those with and without established atherosclerotic cardiovascular disease. These findings help bridge the gap from using this score as a promising research tool to its clinical application with the potential to improve patient care.
Polygenic risk for AF is a rapidly growing area of interest and others have published on this topic. For example, Borschel et al. incorporated a 145-SNP AF PRS with NT-proBNP in 6945 patients and found that the PRS and NT-proBNP had similar risk prediction and provided incremental value in AF detection. The authors concluded that further improvements in the PRS are likely with the discovery of additional SNPs.12 In our analysis, we build on these results by using a much larger 6.7 million SNP PRS in a cardiovascular cohort that is five times larger and includes non-European ancestries. Lazarte et al. also used the 6.7 million SNP score and compared it to a smaller 1168 SNP PRS for the detection of lone AF in 609 subjects. The authors demonstrated that the full 6.7 million SNP score was superior to the smaller score.35 In our analysis, we used this larger score but then tested it in a cohort 50 times larger and in patients with cardiovascular comorbidities, representative of the patients that are typically seen in cardiology clinics. In contrast to the findings by Lazarte, we did not observe significant differences in risk discrimination between the scores. These observations raise the notion that while larger risk scores may offer additional insights into potentially relevant proteins and pathways, from the standpoint of pure risk prediction, it is not a given that a larger risk score will substantially outperform a smaller one that already contains the strongest genetic risk factors. Choi et al. evaluated the monogenic and polygenic contributions of AF and found that polygenic risk explained a larger proportion of genetic susceptibility for AF, confirming the potential value of its clinical application and validating the aim of our study.4
The 2018 US Preventive Services Task Force concluded that there was insufficient evidence to assess the benefits or harms associated with AF screening in asymptomatic adults aged 65 years or older.36,37 Conversely, the European Society of Cardiology recommends opportunistic screening for patients aged ≥65 years old, with hypertension, or with obstructive sleep apnoea, and systematic ECG screening in those ≥75 years old or at high risk of stroke.33 However, patients may exist outside of these age and clinical parameters that carry similar or greater AF risk and a comprehensive risk assessment incorporating genetics may provide more precision regarding who should undergo AF screening. For example, our findings support the use of genetics as an additional risk enhancer to determine who to screen for AF, much in the same way hypertension is used in the ESC guidelines.
In an era of big data and personalized medicine, incorporation of biomarkers and genetics provides an opportunity to understand the entirety of a patient’s risk for a given disease, which in our study increased the spectrum of AF risk from two- to three-fold with clinical risk alone, to more than 10-fold. This significant gradient of risk may help clarify who would benefit from AF screening. For example, consider an individual with intermediate clinical risk based on the CHARGE-AF score, which in this study carried a 3-year AF risk of 3.4%. When genetics and NT-proBNP were applied to these patients, those with low PRS and normal NT-proBNP carried an AF risk on par with low clinical risk patients (<1%/year); patients with either high PRS or elevated NT-proBNP carried a risk of AF similar to the high clinical risk individuals (5.4% and 5.9% over 3 years, respectively); and those with both high PRS and elevated NT-proBNP carried an even higher AF risk of 9.4%, which can be extrapolated to an ∼30% risk over 10 years. As a result, this comprehensive approach has the potential to re-stratify risk in a large proportion of intermediate clinical risk individuals.
The high incidence of AF that is identified using this approach is also noteworthy. With the 10-fold gradient of AF risk identified in our clinical trial cohort, the annualized incidence of AF ranged from <0.5%/year to >5%/year. The latter is much higher than the annual incident AF rates in the usual care arm of AF screening trials, which is typically ∼1–2%.38,39 This is in part related to the population in our study comprising individuals with established cardiovascular conditions, whose high risk factor burden impart higher absolute rates of AF. However, the relative risk of AF associated with this genetic risk score is consistent with what has been seen in a general population, although direct comparisons are limited due to the use of different polygenic scores.11 Our study also quantifies the incidence of clinical AF as opposed to the subclinical AF detected with implantable loop recorders (ILRs) in the CRYSTAL-AF, STROKE-AF, and LOOP trials40–42 and with continuous electrocardiogram monitoring in the SEARCH-AF trial.34 While less common, clinical AF events likely represent greater AF burden and may be more relevant in determining stroke risk.42 This was evident in our analysis, where the recognition of clinical AF was associated with a significantly increased risk of ischaemic stroke, even during a median follow-up period of just 2.3 years.
It is worth noting that evaluation with NT-proBNP and the AF PRS may not be necessary in everyone and will depend on screening thresholds that are yet to be determined.
Furthermore, precise AF risk assessment is just one step in determining whether specific populations should be screened for AF. It will also require further elucidation of whether AF identified through screening can reduce the risk of embolic stroke compared with the standard of care. While it seems biologically plausible that early AF detection and early anticoagulation should reduce embolic stroke rate, the recently published LOOP and STROKESTOP trials addressed this question with mixed results.42,43 The LOOP trial showed no benefit in anticoagulating patients with ILR-detected AF, whereas patients in STROKESTOP whose AF was detected by twice weekly ECG screening experienced lower stroke rates than controls. These findings suggest that not all subclinical AF carries equal stroke risk, and AF screening strategies will likely need to incorporate data on an individual’s subclinical AF burden.
There are also potential costs and harms to consider in designing strategies for AF screening. With the increased availability of mobile technologies, AF screening can be done continuously for long periods of time. However, this can be costly (especially when done in large proportions of the population) and will identify more subclinical AF, the optimal treatment of which is still undefined. Nonetheless, such an approach would likely lead to much more anticoagulation use, which also carries increased costs and bleeding risks. Ongoing research will need to address these issues, but complete and accurate risk assessment will be an integral component of the decision to screen.
Limitations
In this study, we specifically studied subjects with established cardiovascular conditions from randomized clinical trials. While this is a unique strength of our study and allows for the examination of subgroups with high risk factor burden and elevated NT-proBNP, our findings may not be applicable to the broader general population. In addition, consistent with many genetic studies, our analysis is limited by the inclusion of European ancestry subjects. However, we did perform the primary genetic analysis in the non-European trial participants and found consistent results. The non-European analysis was limited in sample size and therefore further data are needed to understand how genetic risk prediction performs in diverse patient cohorts. Furthermore, while we excluded all patients with a clinical diagnosis of AF at the time of study entry, it is possible that some patients were included that had subclinical AF that had not yet been identified. However, this is consistent with clinical practice. Finally, while our data identify a strong gradient of AF risk using clinical, genetics, and biomarker data in a comprehensive approach, we are not able to determine in which populations screening would reduce stroke in a cost-effective manner. This will ultimately be required to inform guideline recommendations.
Conclusion
In patients with cardiovascular disease, AF PRS was a strong, independent predictor of AF that significantly improved risk prediction when added to a validated clinical risk score and the established biomarker NT-proBNP. The combination of clinical risk factors, NT-proBNP, and genetic risk identified subgroups of patients at very high risk who may benefit from targeted AF screening.
Supplementary data
Supplementary data is available at European Heart Journal online.
Acknowledgements
N.A.M. and A.C.G. contributed to study design, literature search, statistical analysis, data interpretation, figures, and drafting of the manuscript. F.K.K., G.M.M., C.R., and P.J. contributed to data preparation, study design, and statistical analysis. D.D.B., D.L.B., MPB, C.P.C., R.P.G., M.O.D., I.R., B.M.S., E.B., and D.A.M. contributed to data interpretation and critical review of the manuscript. P.T.E., S.A.L., M.S.S., and C.T.R. contributed to study design, statistical analysis, data interpretation, figures, and critical review of the manuscript. M.S.S. and C.T.R. are the guarantors of this work and, as such, had full access to all the data in the study and takes responsibility for the integrity of the data and the accuracy of the data analysis.
Funding
FOURIER, IMPROVE-IT, SAVOR, and SOLID were funded by Amgen, Merck, AstraZeneca and Bristol-Myers Squibb, and GlaxoSmithKline, respectively.
Data availability
The trial data from this analysis cannot be shared, but we encourage individuals to contact the corresponding author for collaboration.
References
Author notes
co-first author.
co-senior author.
Conflict of interest: N.A.M. reports grant support from the National Institutes of Health and involvement in clinical trials with Amgen, Pfizer, Novartis, AstraZeneca, and Ionis without personal fees, payments, or increase in salary. A.C.G., F.K.K., and G.M.M. report no disclosures. C.R. is supported by a grant from Bayer AG to the Broad Institute focused on the development of therapeutics for cardiovascular disease. P.J. reports research support from Abbott Laboratories, Amgen, Inc., AstraZeneca, LP, Daiichi-Sankyo, Inc., Eisai, Inc., GlaxoSmithKline, Merck & Co., Inc., Regeneron Pharmaceuticals, Inc., Roche Diagnostics Corporation, Siemens Healthineers, Takeda Global Research and Development Center, and Waters Technologies Corporation, and consulting fees from Roche Diagnostics Corporation. D.D.B. is supported by Harvard Catalyst KL2/CMeRIT (NIH/NCATS UL 1TR002541) and has received research grant support to his institution from AstraZeneca and Pfizer and consulting fees from AstraZeneca. D.L.B. reports grants from AstraZeneca, during the conduct of the study; grants from Amarin, AstraZeneca, Bristol-Myers Squibb, Garmin, Owkin, HLS Therapeutics, Eisai, Ethicon, Medtronic, 89Bio, sanofi aventis, Contego Medical, The Medicines Company, Roche, Pfizer, Forest Laboratories/AstraZeneca, Stasys, Ischemix, Amgen, Lilly, Chiesi, Ironwood, Merck, Abbott, Regeneron, Idorsia, Faraday Pharmaceuticals, Javelin, Reid Hoffman Foundation, Moderna, Beren, Aker Biomarine, Recardio, Acesion Pharma, Synaptic, Fractyl, Afimmune, Ferring Pharmaceuticals, Lexicon; other from FlowCo, Clinical Cardiology, VA, Takeda, Endotronix, Vascular Solutions, and Svelte, grants and other from PLx Pharma, Novartis, NirvaMed, MyoKardia/BMS, Janssen, Novo Nordisk, Cardax, and Boston Scientific, PhaseBio, Novo Nordisk, Cereno Scientific, CellProthera; personal fees from Duke Clinical Research Institute, Oakstone CME, High Enroll, Bristol-Myers Squibb, Mayo Clinic, Arnold and Porter law firm, Piper Sandler, Cowen and Company, Assistance Publique-Hôpitaux de Paris, Rutgers University, Wiley, AngioWave, K2P, Canadian Medical and Surgical Knowledge Translation Research Group, Journal of the American College of Cardiology, TobeSoft, Bayer, MJH Life Sciences, Level Ex, Population Health Research Institute, Belvoir Publications, Slack Publications, WebMD, Elsevier, Harvard Clinical Research Institute (now Baim Institute for Clinical Research), HMP Global, Cleveland Clinic, Mount Sinai School of Medicine, Medtelligence/ReachMD, CSL Behring; personal fees from from DRS. LINQ, non-financial support, and other from American College of Cardiology; other from Medscape Cardiology, Philips, Regado Biosciences, Boston VA Research Institute, St. Jude Medical (now Abbott), Biotronik, CSI; personal fees and non-financial support from Society of Cardiovascular Patient Care; non-financial support from American Heart Association; grants, personal fees, and other from Boehringer Ingelheim, outside the submitted work. M.P.B. discloses grant support from Amgen, AstraZeneca, Bayer, and Sanofi and consulting fees from Amgen, AstraZeneca, Bayer, and Sanofi. C.P.C. reports research grants from Amgen, Boehringer Ingelheim (BI), Bristol-Myers Squibb (BMS), Daiichi-Sankyo, Janssen, Merck, Novo Nordisk, and Pfizer. Consulting fees from Aegerion, Alnylam, Amarin, Amgen, Applied Therapeutics, Ascendia, BI, BMS, Corvidia, Eli Lilly, HLS Therapeutics, Innovent, Janssen, Kowa, Merck, Pfizer, Rhoshan, and Sanofi. R.P.G. reports grants from Amgen and Daiichi-Sankyo, during the conduct of the study; personal fees from Akcea, GlaxoSmithKline, Janssen, Lexicon, American College of Cardiology, Bristol-Myers Squibb, CVS Caremark, Pfizer, Servier, outside the submitted work; grants and personal fees from Amarin, Daiichi-Sankyo, Merck, Amgen; and Institutional research grant to the TIMI Study Group at Brigham and Women’s Hospital for research he is not directly involved in from Abbott, Amgen, Aralez, AstraZeneca, Bayer HealthCare Pharmaceuticals, Inc., BRAHMS, Daiichi-Sankyo, Eisai, GlaxoSmithKline, Intarcia, Janssen, MedImmune, Merck, Novartis, Pfizer, Poxel, Quark Pharmaceuticals, Roche, Takeda, The Medicines Company, and Zora Biosciences. M.L.O. reports institutional research grants from Amgen, Janssen, The Medicines Company, Eisai, GlaxoSmithKline, and Astra Zeneca. I.R. received personal fees from AstraZeneca, Bristol-Myers Squibb, Boehringer Ingelheim, Concenter BioPharma, and Silkim, Eli Lilly, Merck Sharp & Dohme, Novo Nordisk, Orgenesis, Pfizer, Sanofi, SmartZyme Innovation, Panaxia, FutuRx, Insuline Medical, Medial EarlySign, CameraEyes, Exscopia, Dermal Biomics, Johnson & Johnson, Novartis, Teva, GlucoMe, and DarioHealth. B.M.S. reports research grants from AstraZeneca, Eisai, Novartis, and Merck and consulting fees from AstraZeneca, Biogen Idec, Boehringer Ingelheim, Covance, Dr Reddy’s Laboratories, Eisai, Elsevier Practice Update Cardiology, GlaxoSmithKline, Lexicon, Merck, Novo Nordisk, Sanofi, and St Jude’s Medical; and has equity in Health [at] Scale. E.B. reports research grants through the Brigham and Women’s Hospital from Astra Zeneca, Daiichi-Sankyo, Merck, and Novartis. Consultancies with Amgen, Cardurion, MyoKardia, NovoNordisk, Boehringer Ingelheim/Lilly, IMMEDIATE, and Verve. Uncompensated consultancies and lectures with The Medicines Company. D.A.M. reports grants to Brigham and Women’s Hospital from Abbott Laboratories, AstraZeneca, BRAHMS, Daiichi-Sankyo, Eisai, GlaxoSmithKline, Medicines Company, Merck, Novartis, Pfizer, Quark Pharmaceuticals, Roche Diagnostics, Takeda, and Zora Biosciences. He has received consulting fees from Aralez, AstraZeneca, Bayer Pharma, InCarda, Novartis, and Roche Diagnostics. P.T.E. receives sponsored research support from Bayer AG and IBM Health, and he has consulted for Bayer AG, Novartis, MyoKardia, and Quest Diagnostics. S.A.L. receives sponsored research support from Bristol-Myers Squibb/Pfizer, Bayer AG, Boehringer Ingelheim, Fitbit, and IBM and has consulted for Bristol-Myers Squibb/Pfizer, Bayer AG, and Blackstone Life Sciences. Dr. Lubitz is supported by NIH grants R01HL139731, R01HL157635 and American Heart Association 18SFRN34250007. C.T.R. Honoraria; Modest; Bristol-Myers Squib, Pfizer, Portola, Honoraria; Significant; Bayer, Boehringer Ingelheim, Daiichi-Sankyo, Janssen, Research Grant; Modest; Daiichi-Sankyo, MedImmune, National Institute of Health, Research Grant; Significant; Boehringer Ingelheim. M.S.S.: Other; Modest; Anthos Therapeutics, AstraZeneca, Bristol-Myers Squibb, CVS Caremark, DalCor, IFM Therapeutics, Intarcia, Medicines Company, MedImmune, Merck, Other; Significant; Amgen, Research Grant; Significant; Amgen, AstraZeneca, Bayer, Daiichi-Sankyo, Eisai; Intarcia, Medicines Company, MedImmune, Merck, Novartis, Pfizer, Quark.

